
HayeTrading
@t_HayeTrading

What symbols does the trader recommend buying?
Purchase History
پیام های تریدر
Filter
HayeTrading
Wild XRP Moves on Legal News ⚖️

XRP Legal Case Update📜 The SEC has appealed Judge Torres' decision on XRP's status 🏛. Ripple wants the primary lawsuit to move forward despite the appeal ⚖️. The appeal's acceptance can shape the lawsuit's future 🔄. SEC's focus: XRP sales, not the asset itself 💵. SEC's appeal might extend the lawsuit by 3-6 months ⏳. XRP price doubled following the temporary lawsuit conclusion on July 13 📈. SEC's appeal might resonate with Coinbase and Dragonchain cases 🌐. Ripple's deadline for the SEC motion response: Sept. 1, 2023 ⏰. XRP's Market Position:📊 XRP's recent performance: +16% from lows, but -20% this week 🔺🔻. XRP is 50% down from its yearly peak 📉. XRP price showed resilience, bouncing back 18% after a 28% drop 🪂.
HayeTrading
Impending Gold Channel Breakout?

Gold has been in a clean, tightening descending channel and may be ready to breakout. I wouldn't be entering until a clear breakout signal is shown, but a push back into the 1920s and possibly beyond seems like a possible scenario if the channel breaks to the upside.Well this has aged well, almost perfect timing for the breakout and path so far, currently at 1918, the predicted push to the 1920s should be imminent
HayeTrading
Gold Breakout or Reversal?

Gold has continued bouncing within it's huge triangle on the Daily, a massive range of consolidation featuring a perfect series of Higher Lows and Lower Highs. The further we get into the peak of this triangle the more explosive I expect the breakout to be. My last idea was to short the top of this range, and price did bounce down and continue the formation, reaching the bottom before bouncing back up again. We've just had new CPI data showing the largest YOY inflation increase for 40 years. The general wisdom is that Gold performs well in periods of high inflation, and while the CPI data on Thursday actually saw a red day, the close of the week was a big green day for Gold. From a purely technical standpoint, while I do believe a breakout will be coming soon my instinct is to continue trading the formation - that would be a short in this instance, with Gold price at the top of it's range, nearing strong resistance and having seen a potential End Of Week overreaction, with some rotation out of the US indexes on Friday as they took another dive. However, the combination of the dramatic inflation numbers and a falling stock market is giving me pause. While I think there's solid potential for a 2 R short here with a stop above the resistance (marked yellow on the chart), I'm going to hold back until after NYSE open on Monday. I've been looking at this consolidation phase for a while now and there is almost a perfect storm brewing for a bullish breakout. Note - I have adjusted the upper boundary of the triangle in the chart above, but in the range I previously drew in my last chart the Friday action actually drove up and closed above the upper boundary, signaling a potential breakout. Previous chart idea -
HayeTrading
BTCUSDT Don't be a hero!

If you enjoy the idea please leave a like 👍 In my last 2 posts on BTC I've shown a strong bearish bias, as seen in the charts below. First with an idea of bearish continuation of the developing trend and then more recently with the Head and Shoulders idea, looking for a break of the neckline which we've recently seen with a sharp break down of the market, dragging the entire crypto market with it. So now that we've seen a huge drop, where do we expect to go from here? In the H+S idea I listed 30k as a potential target, and I still believe that's reasonable. As the trend continues the risk/reward begins to shift and a relief rally may be coming soon, but it may be short lived. As the title says - don't be a hero! We saw the peak price on the 10th November, and when we zoom out we see a steady decline since. For those looking to go long, what are the odds that you pick the exact bottom here? If you want to be long, I can understand using this as an opportunity to DCA in, or waiting for a rally on shorter timeframes to try and catch a small leg up. But don't enter this market thinking you're going to catch a perfect bottom - it's highly unlikely, and especially if you're using leverage you will likely get burned. Trust the trend. If you're late to the party, there's still further room to run. If you'd rather wait for a pullback before going short there's a decent chance we could see the 38-40k range again in the coming days, but make no mistake - Crypto is in a bear market right now.
HayeTrading
XAUUSD Awaiting breakout, but not yet

Gold has is trading within a huge triangle, with a lower trendline support spanning back to 2018 and an upper trendline resistance spanning back to mid 2020, with a good number of clear rejections of these levels from each. Gold has just entered the upper boundary again, coming in with a little momentum this time, with RSI just breaking above 70 on the 4H. I expect to see another rejection in the area of this upper trendline back into the triangle to continue this huge consolidation, but price is getting wound tighter and tighter and may be due for an explosion in the near future. Expect to see a rejection from this level - which could be taken as a good risk/reward short with stop loss above the trendline - and price to squeeze further into the peak of the triangle, at which point we will be primed for a big breakout. Whenever it happens, the breakout of this triangle will be one to watch, and I'll be taking a position intending to following the trend in whichever direction it breaks out with the intention of a medium-term hold, which for me would be approx. 7 - 30 days.
HayeTrading
BTC - 2 Head and Shoulders scenarios

BTC has formed what looks to be a head and shoulders formation on the Daily, indicating more pain could be ahead for the OG crypto that's down 37% from it's peak earlier this year. The typical way to trade a head and shoulders pattern is to sell when we see a break through the neckline, which is currently acting as support but a break of this level could see price drop to the previous key level around 30k. That is, of course, if you consider the huge wick on December 4th down to the neckline to be a valid component this formation. If we use a line chart, ignoring the lows of the day and just focusing in on the closes, it changes the formation completely. This gives us just a second touch of the neckline, with a right shoulder yet to form. If this is the real pattern forming, we could see a surge back to the ~52k level in the coming weeks. The market is reaching a decision point, and price action driving us above or below this support level/neck line will give the indication of a short term trend we can jump on.
HayeTrading
ETH + Alts Beating Bitcoin

With the help of my most recent script ROC vs BTC we can see that on the 4H chart we've been seeing some strong divergence, with Ethereum and Altcoins outperforming Bitcoin on a relative basis.Bear in mind this isn't a case of comparing apples and oranges, where Alts always tend to "outperform" BTC during waves up and down due to higher volatility, the volatility is accounted for by measuring each ticker's ROC against it's own historical ROC and ranking it as a percentile. Then the same is done for BTC and the 2 are compared.What does this tell us? Well one thing could be that if we wanted to play the long side on BTC in the short term it may be better to go long on an Alt that has been diverging and seeing strength during Bitcoin's weakness. On a larger scale it may be a sign that in the short to medium term, we could be seeing a drop in Bitcoin dominance and a rise in the Alts.
HayeTrading
MANAUSDT Respecting Trendline/Support

MANA has been respecting a short term upward trendline perfectly, with a horizontal supply zone directly below.Long idea is to wait for another touch of the trendline and go long, with stop loss below support and short term target for 2.1 R trade.This is NOT financial advice, you are responsible for your own trading decisions.** If you enjoyed the idea please LIKE and FOLLOW **Let me know what you think below!
HayeTrading
SANDUSDT next leg of parabolic move up?

Can SAND continue it's parabolic run?With monster gains since October we can break the movements of SAND down into 2 cycles of 3 phases - and if history repeats (or rhymes) it would lead us up, up and away.This one's just for fun but anything is possible in a parabolic move up like this, often a sharp move down is just the buying pressure taking a breather before resuming.This is not financial advice, you're responsible for your own trading decisions.Leave a like and follow for more!
HayeTrading
BNB Huge Triangle Formation
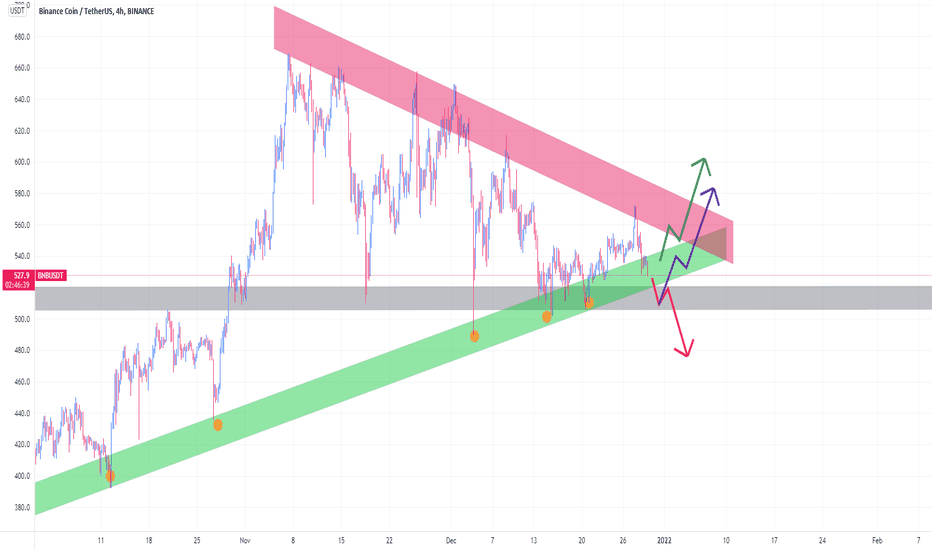
BNBUSDT has formed a huge triangle, with a very strong longstanding trendline that has seen 7 significant rejections since June.Price is currently testing that lower trendline after a series of lower lows have driven us into a consolidating triangle. Expect price to break sharply out of this triangle.Immediately below the bottom trendline is an area that has also acted as strong support recently, which could set up for a potential fakeout - a sharp break below the trendline only to meet support and bounce right back through the top side of our triangle (shown as the purple line on the chart).Short term expectation is to see a bounce unless we see a break below the lower support level, in which case we could expect to see a drop to the low 400s.This is not financial advice. You are responsible for your own trading decisions.Comment your idea below, give a like and follow for more!
Disclaimer
Any content and materials included in Sahmeto's website and official communication channels are a compilation of personal opinions and analyses and are not binding. They do not constitute any recommendation for buying, selling, entering or exiting the stock market and cryptocurrency market. Also, all news and analyses included in the website and channels are merely republished information from official and unofficial domestic and foreign sources, and it is obvious that users of the said content are responsible for following up and ensuring the authenticity and accuracy of the materials. Therefore, while disclaiming responsibility, it is declared that the responsibility for any decision-making, action, and potential profit and loss in the capital market and cryptocurrency market lies with the trader.