
Harmonic.Traders
@t_Harmonic.Traders
What symbols does the trader recommend buying?
Purchase History
پیام های تریدر
Filter
Signal Type

Harmonic.Traders
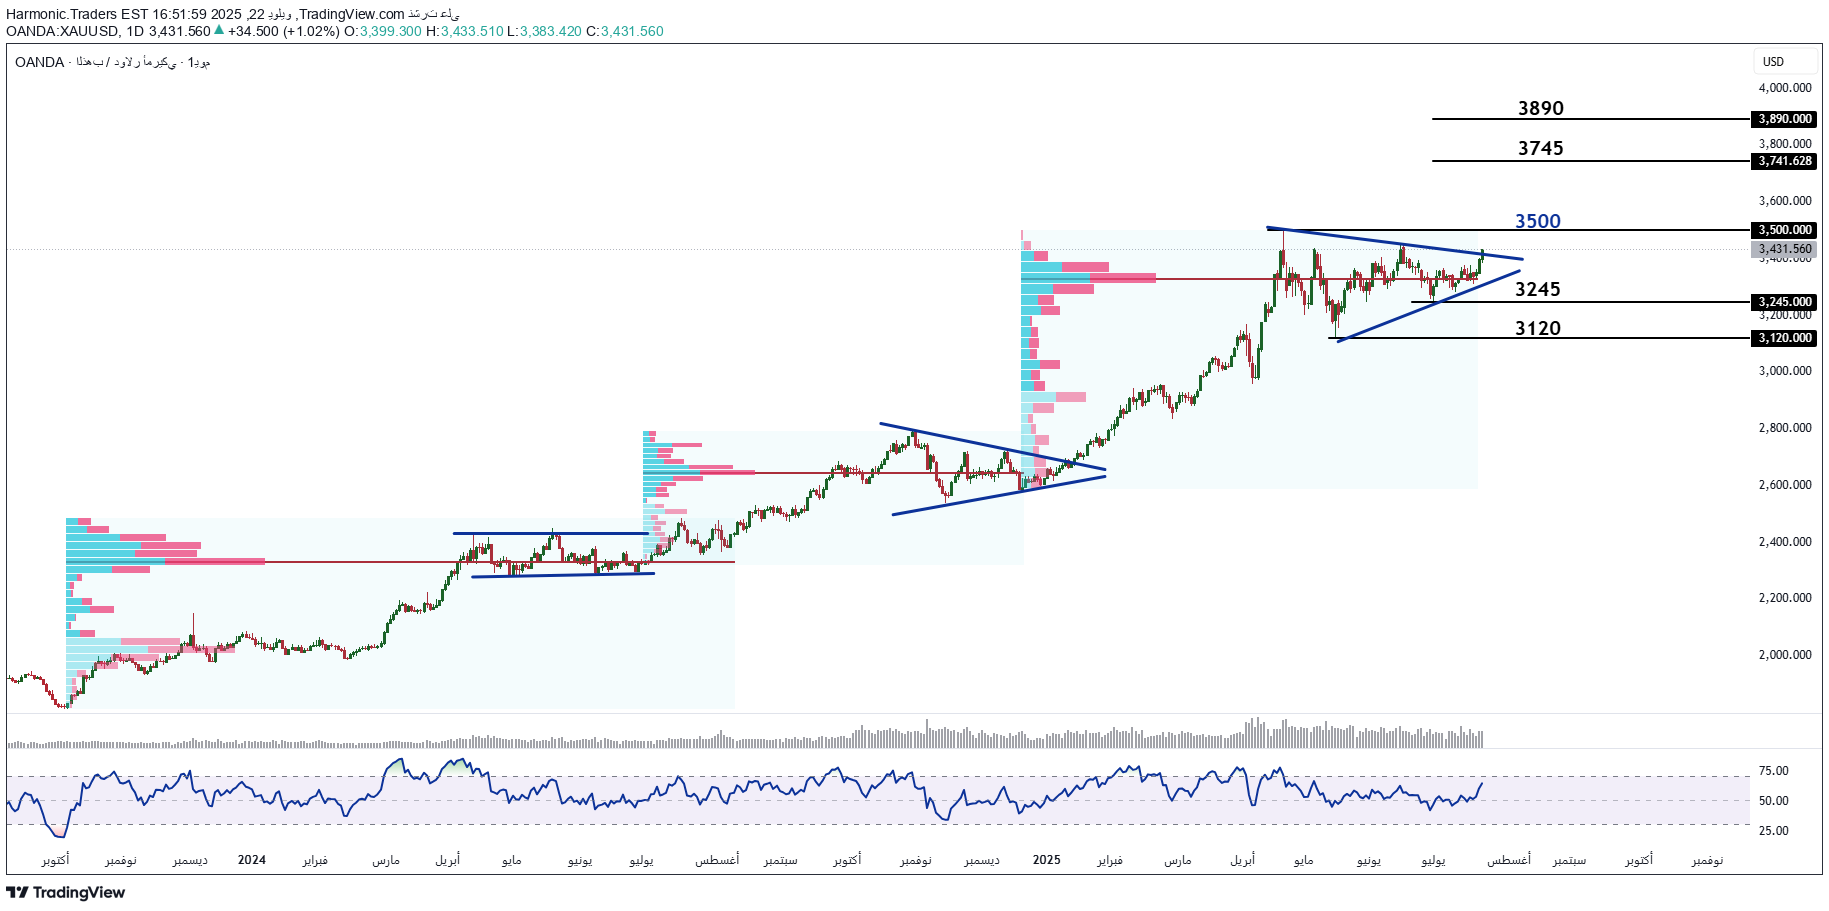
Gold in the short term The time frame used (day) For a short -term investor Technical tools used in the analysis of the price movement, the volume of profile and the RSI relativity index We note that the prices are in a rising general trend, whether in the medium term or in the short term, which is confirmed by the RSI RSI movement, which bounces down from the support of the middle area We also note that the prices in each transverse corrective movement appear, after which the purchasing power appears to begin a new wave of rise, which confirms the indicator of cumulative trading sizes (Volume Profile) With the closure of the day at the top of the upper limit of the similar triangle model, we expect that the prices will start a new wave of rise in which the resistance is tested 3500, which is the resistance of the last historical summit, which is expected to penetrate up to the top of the resistors test 3745 and then 3890 and on the other side this positive view remains and effective as long as the prices did not confirm the breaking of support 3245

Harmonic.Traders
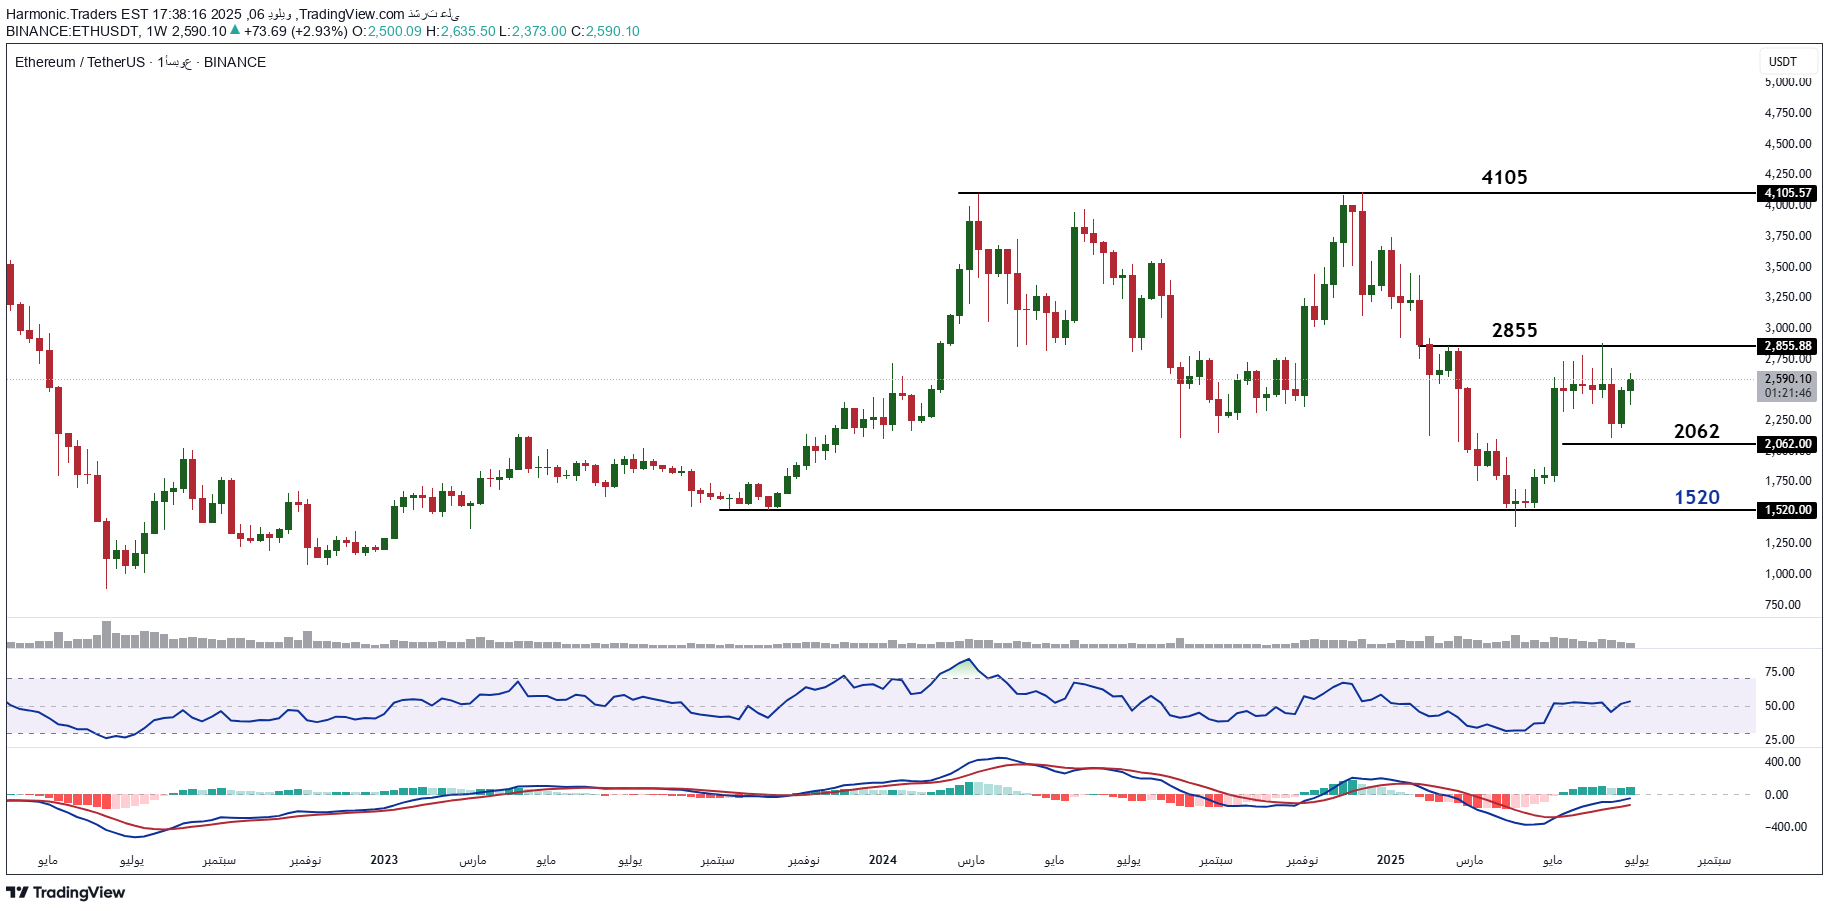
The timetable used a week based on the previous analysis of the acquisition rate of ethereum The prices face strong resistance 2855, which confirm its penetration above it opens the way to continue to climb to test the following strong resistance 4105 (we launch a strong word when prices fall from the same resistance more than once or drop from them by a large percentage) and in the event of decline we recommend building purchasing centers on the support 2062 with the confirmation of confirmation of the fracture of the support of 1520 as a limit to stop Loss

Harmonic.Traders
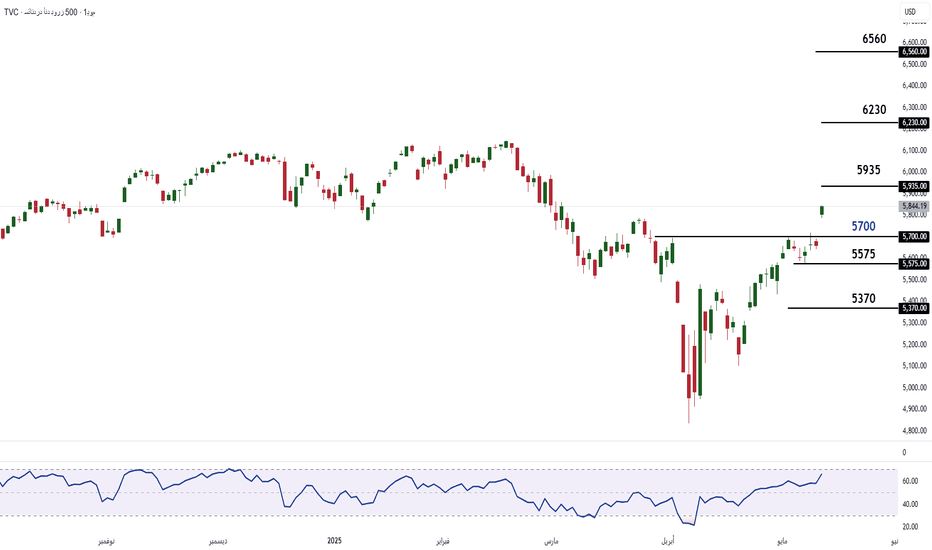
شاخص اس اند پی 500 در کوتاه مدت امروز سطح 5700 را رو به بالا شکست که راه را برای ادامه صعود و هدف قرار دادن مقاومت 5935 به عنوان هدف اول صعودی و سپس مقاومت 6230 به عنوان هدف دوم صعودی (که دلیل دیدگاه مثبت ما نسبت به داو جونز در تحلیل قبلی بود) باز می کند. در صورت بروز سودگیری، آن را یک حرکت اصلاحی نزولی تلقی می کنیم که در آن با حمایت 5700 و سپس 5575 مواجه شد.

Harmonic.Traders
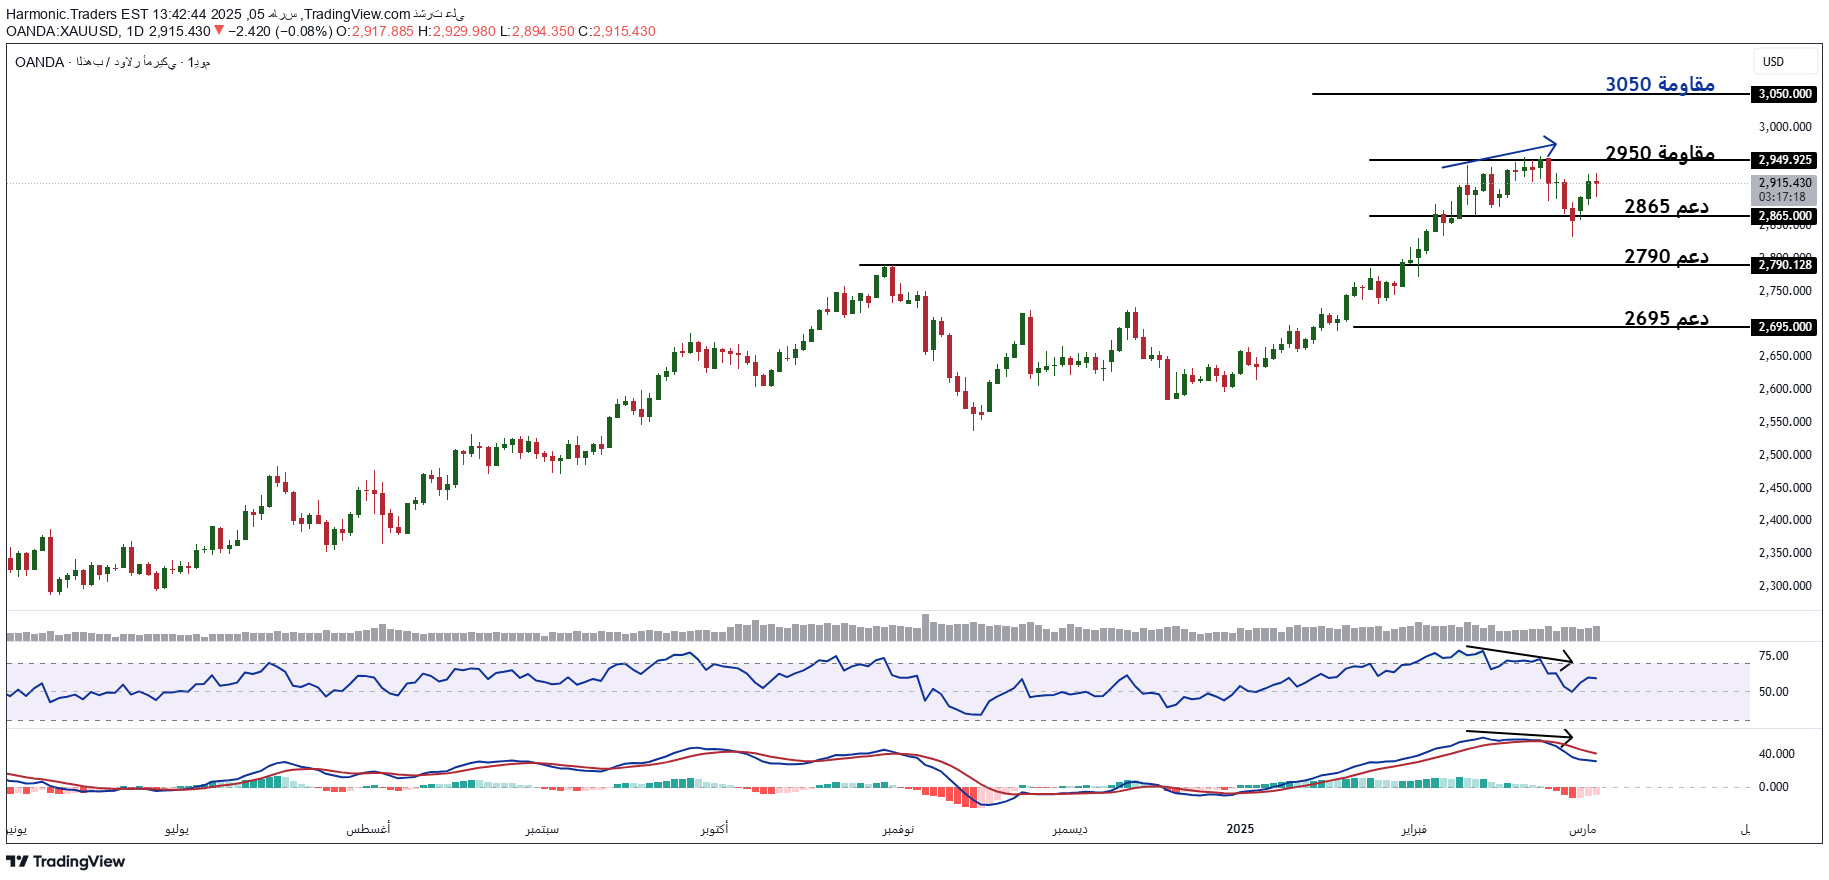
ما در تحلیل قبلی اشاره کردیم که سرمایهگذار کوتاهمدت ما از بازه زمانی "روزانه" استفاده میکند. همچنین، به نشانههای ضعف در آخرین حرکت صعودی اشاره کردیم که شامل واگرایی منفی بین قیمت و اندیکاتورهای فنی MACD و RSI بود؛ به این معنی که قیمتها در حال افزایش بودند، در حالی که اندیکاتورهای فنی به این افزایش واکنش نشان نمیدادند. توصیه ما این بود که تا زمانی که این نشانههای ضعف به سیگنال فروش تبدیل نشوند، از خرید خودداری کنید. این اتفاق افتاد و قیمتها شاهد بازگشت رو به بالا بودند که ما آن را به عنوان یک اصلاح صعودی برای ادامه روند نزولی تلقی میکنیم. بنابراین، توصیه میکنیم حجم معاملات خود را کاهش دهید. از آنجایی که حد ضرر 3050 واحد از قیمتهای فعلی فاصله زیادی دارد، توصیه میکنیم در هر صعودی اقدام به فروش کنید. تا زمانی که قیمتها زیر مقاومت دوم 3050 واحد قرار دارند، انتظار میرود که یک حرکت اصلاحی نزولی را تجربه کنند و سطح حمایت 2865 واحد (مجدداً) را به عنوان اولین هدف نزولی، سپس سطح حمایت 2790 واحد را به عنوان دومین هدف نزولی و در نهایت سطح حمایت 2695 واحد را به عنوان سومین هدف نزولی آزمایش کنند.

Harmonic.Traders
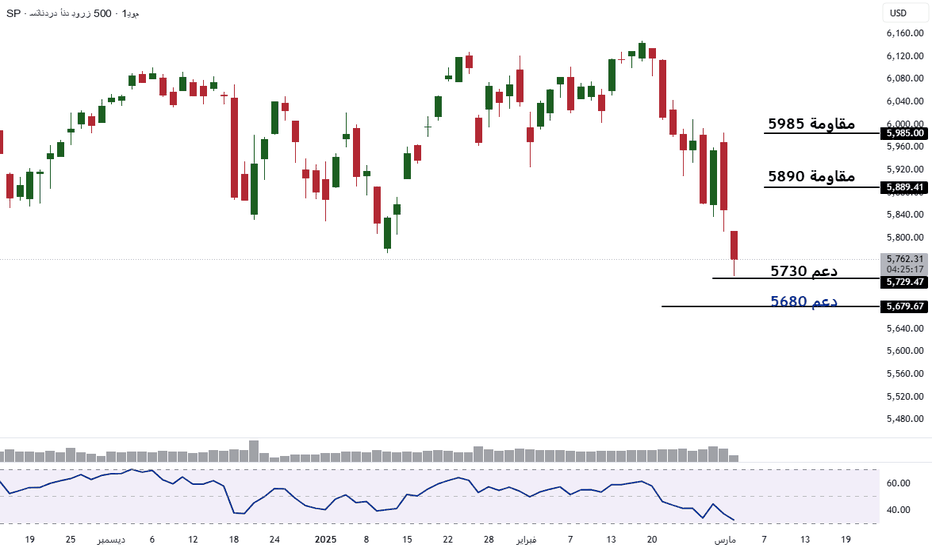
دیدگاه زمانی روزانه برای سرمایهگذار کوتاهمدت همچنان روند نزولی قوی خود را حفظ کرده و اکنون در حال آزمایش سطوح حمایتی است که انتظار میرود از آنها به سمت بالا بازگردد. حمایت ۵۷۳۰ و حمایت دوم ۵۶۸۰ از اهمیت بیشتری برخوردارند، زیرا باقی ماندن S&P بالاتر از این سطوح، ما را به بازگشت به روند صعودی برای آزمایش مقاومت ۵۸۹۰ به عنوان هدف صعود اول و مقاومت ۵۹۸۵ به عنوان هدف صعود دوم امیدوار میکند. با توجه به اینکه قیمتها به شدت از میانگینهای متحرک خود دور شدهاند و طبق اصل "قیمتها حول میانگینهای خود نوسان میکنند"، این بازگشت مورد انتظار است. علاوه بر این، الگوهای مثبت فیبوناچی نیز وجود دارند.

Harmonic.Traders
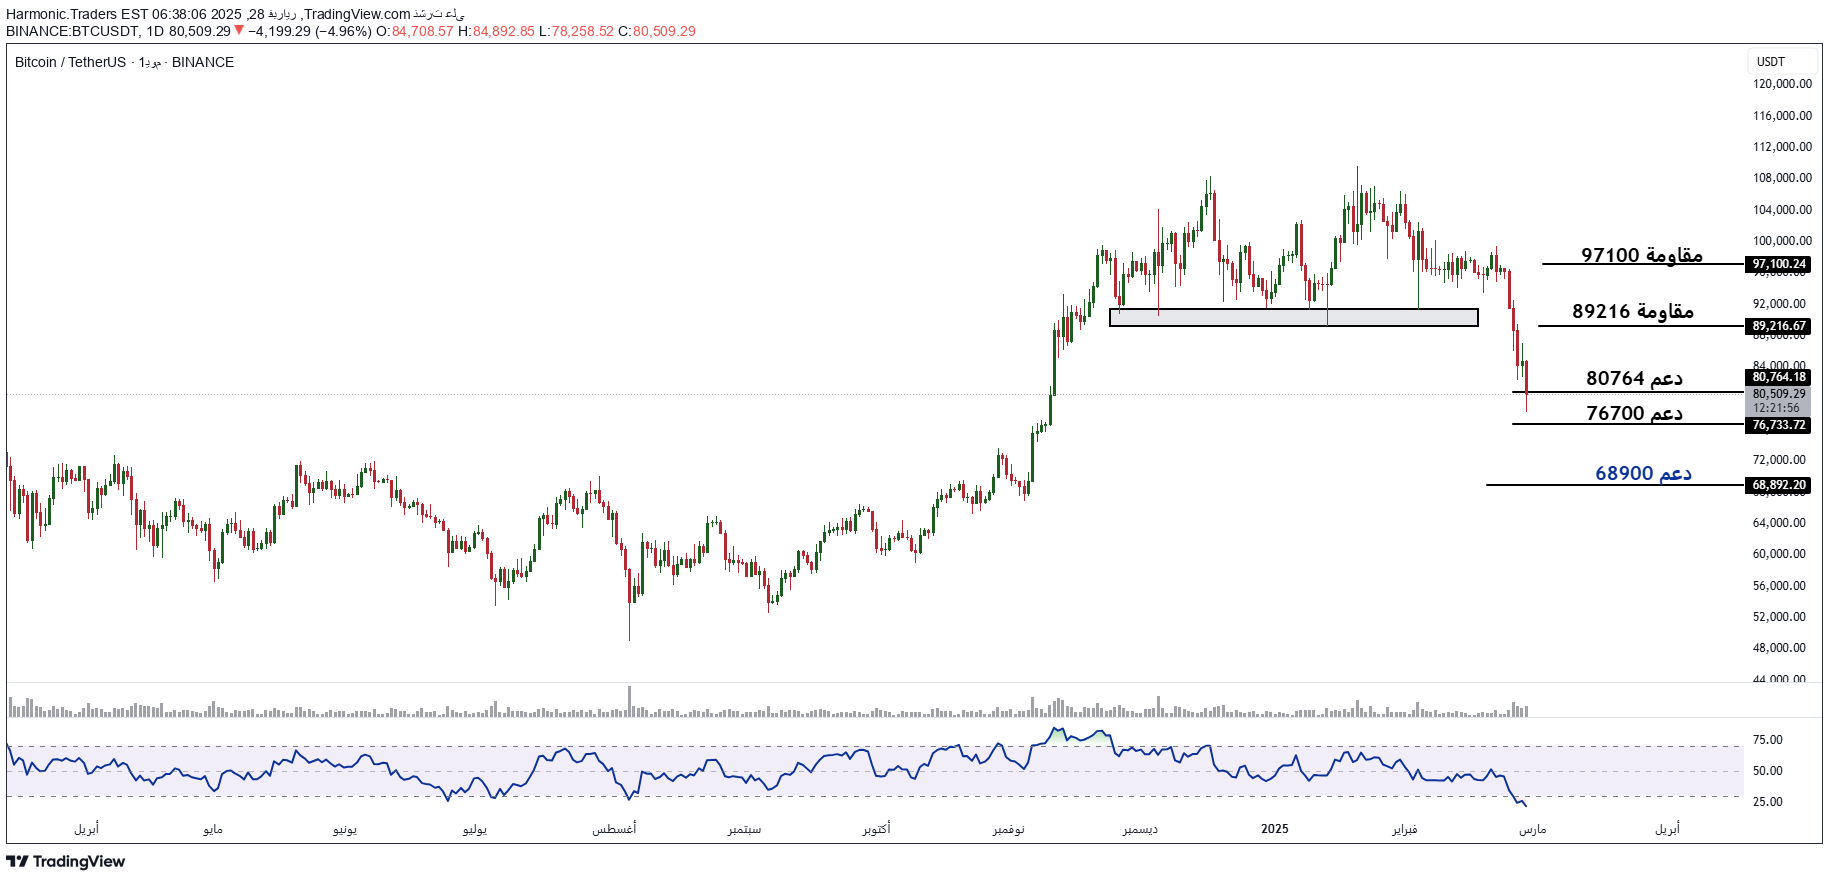
The timetable used on the day of the short -term investor is a sharp decline in prices in particular after the prices were broken down the 89000 region, which has long been maintained by prices to interfere in areas of laws expected to a lifetime, which is 80764 and 76700 and the third support is the most important 68900 because the survival of the above prices did not confirm its breaking down at the bottom makes it expected to appear in the purchasing forces to target the resistances 89216 and 97100 As a first and second rise in the arrangement as a corrective movement up, we recommend building purchasing centers in the declines when the calls shown to target the mentioned resistors as long as the highest 68900

Harmonic.Traders
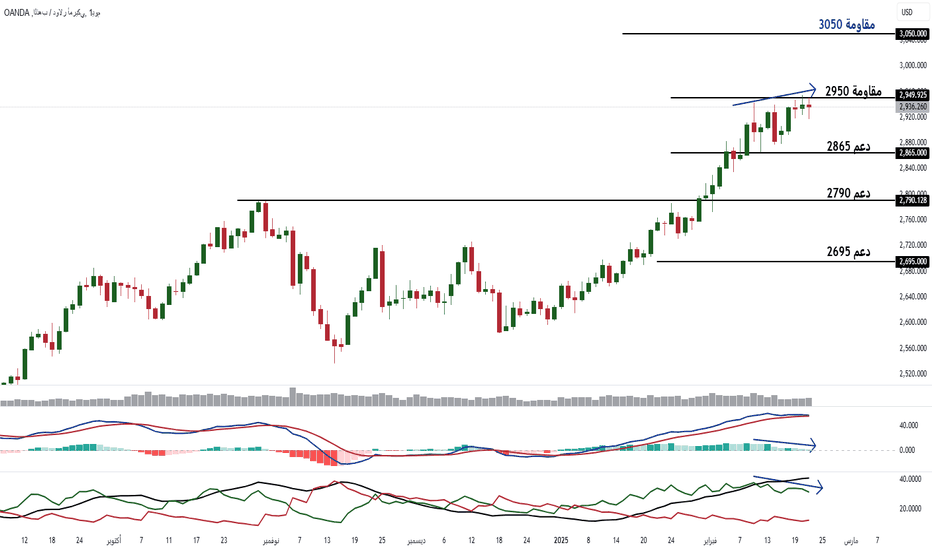
Gold in the short term, the time frame used "Day" for the short -term investor, the resistance is operating 2950 effectively with the prices, which is expected, but technical indicators, despite the aspects of weakness from excessive purchase and negative deviation, have not given signals of sale until now, which is expected to happen Resistance 2950 is an expected pressure area for sales forces, we have identified it since it was penetrated to the top of 2790 and remains so as long as it is below the resistance The second is 3050, so the emergence of sales powers is not excluded and expected as long as we will be confirming from technical indicators, which are mainly taken away from the movement of price and in the event of the emergence of sales forces already we expect prices to target support 2865 as a target of the first drop and then the second support 2790 as a second decline in a second decline and from Guy The support is unlikely 2695 as a target of the third decline in the advice now is to stop buying and monitor the movement of price in the current region Even the second resistance is 3050, the view is negative

Harmonic.Traders
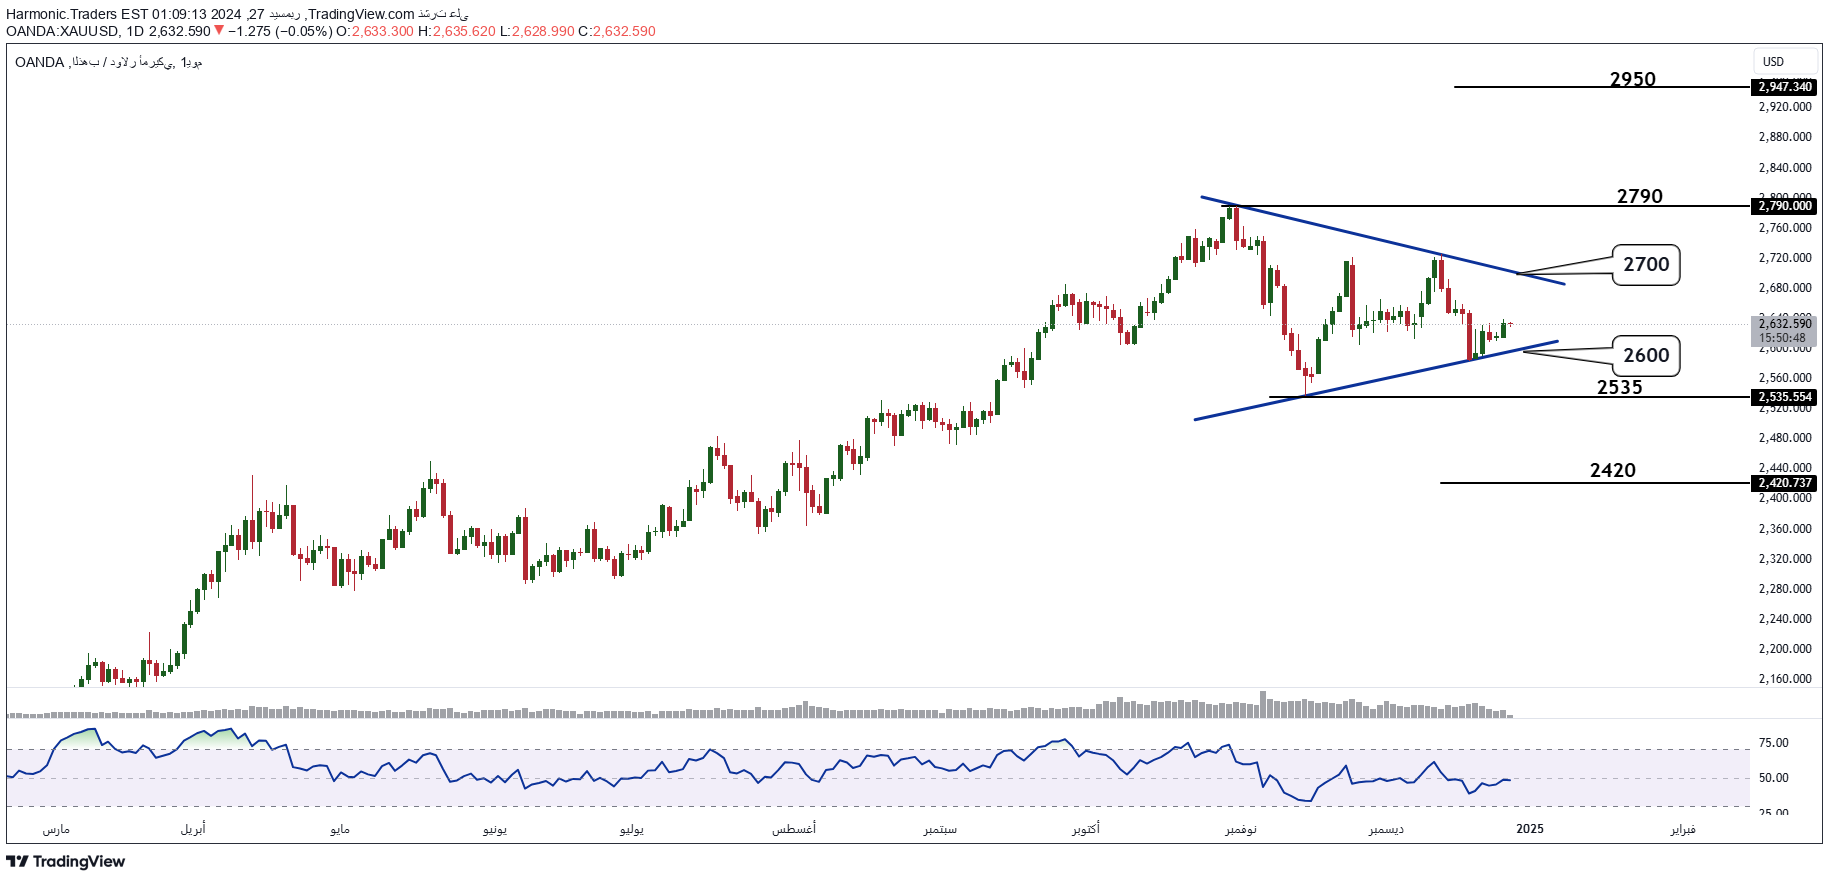
The time frame used is daily for the short-term investor. Prices are trading in a sideways movement at a lower high versus a higher low within a shape that may be a symmetrical triangle with its upper limit at the resistance of 2700. Confirming its upward breakout opens the way for testing the historical peak at 2790. Confirming its upward breakout expects continued upward movement to test the resistance of 2950. On the other hand, it has support at 2600 and confirming its downward breakout faces support at 2535, which is the support of the lowest price at the maximum decline it reached during the recent short period. Confirming its downward breakout opens the way for further decline to test support 2420. Technical indicators confirm the sideways movement. Conclusion: Trading until exiting the current sideways movement, either by breaking the resistances of 2700 and 2790 to adopt positivity or by breaking the supports of 2600 and 2535 to adopt negativity.

Harmonic.Traders
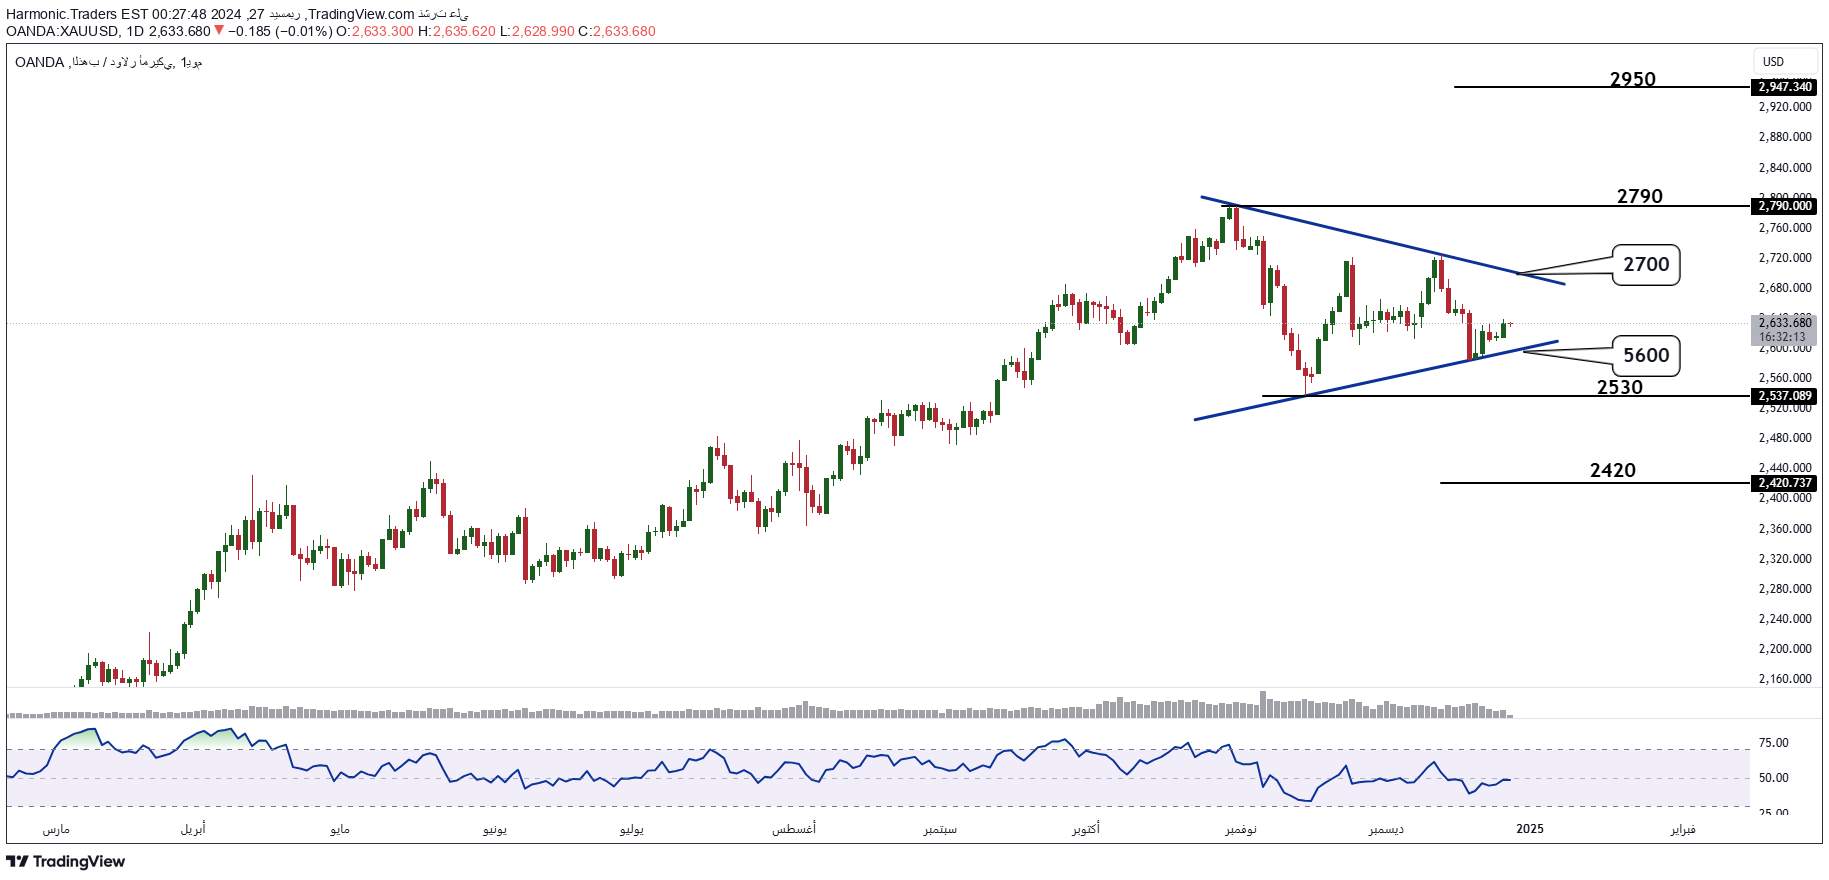
The time frame used is a day for the short-term investor. Prices are trading in a sideways movement at a lower high versus a higher low within a shape that may be a symmetrical triangle with its upper limit at the resistance of 2700. Confirming its upward breakout opens the way for testing the historical high at 2790 and confirming its upward breakout with the expectation of continuing to rise to test the resistance of 2950. On the other hand, it has support of 5600 and confirming its downward breakout faces support of 2560, which is the support of the lowest price at the maximum decline and reached during the past short period. Confirming its downward breakout opens the way for further decline to test support of 2420 and technical indicators confirm the sideways movement. Conclusion: Trading until exiting the current sideways movement, either by breaking the resistances of 2700 and 2790 to adopt positivity or by breaking the supports of 2600 and 2530 to adopt negativity.

Harmonic.Traders

The time frame used is one day for the short-term investor. Prices approached the test of support 3000 when they reached the lowest price today at 3101.9. As long as prices are above that support, a rebound is expected to test resistance 3444 as a first upward target and resistance 3700 as a second upward target, provided that support 3000 is maintained and the daily close is not below it.
Disclaimer
Any content and materials included in Sahmeto's website and official communication channels are a compilation of personal opinions and analyses and are not binding. They do not constitute any recommendation for buying, selling, entering or exiting the stock market and cryptocurrency market. Also, all news and analyses included in the website and channels are merely republished information from official and unofficial domestic and foreign sources, and it is obvious that users of the said content are responsible for following up and ensuring the authenticity and accuracy of the materials. Therefore, while disclaiming responsibility, it is declared that the responsibility for any decision-making, action, and potential profit and loss in the capital market and cryptocurrency market lies with the trader.