Technical analysis by Harmonic.Traders about Symbol PAXG on 12/27/2024

Harmonic.Traders
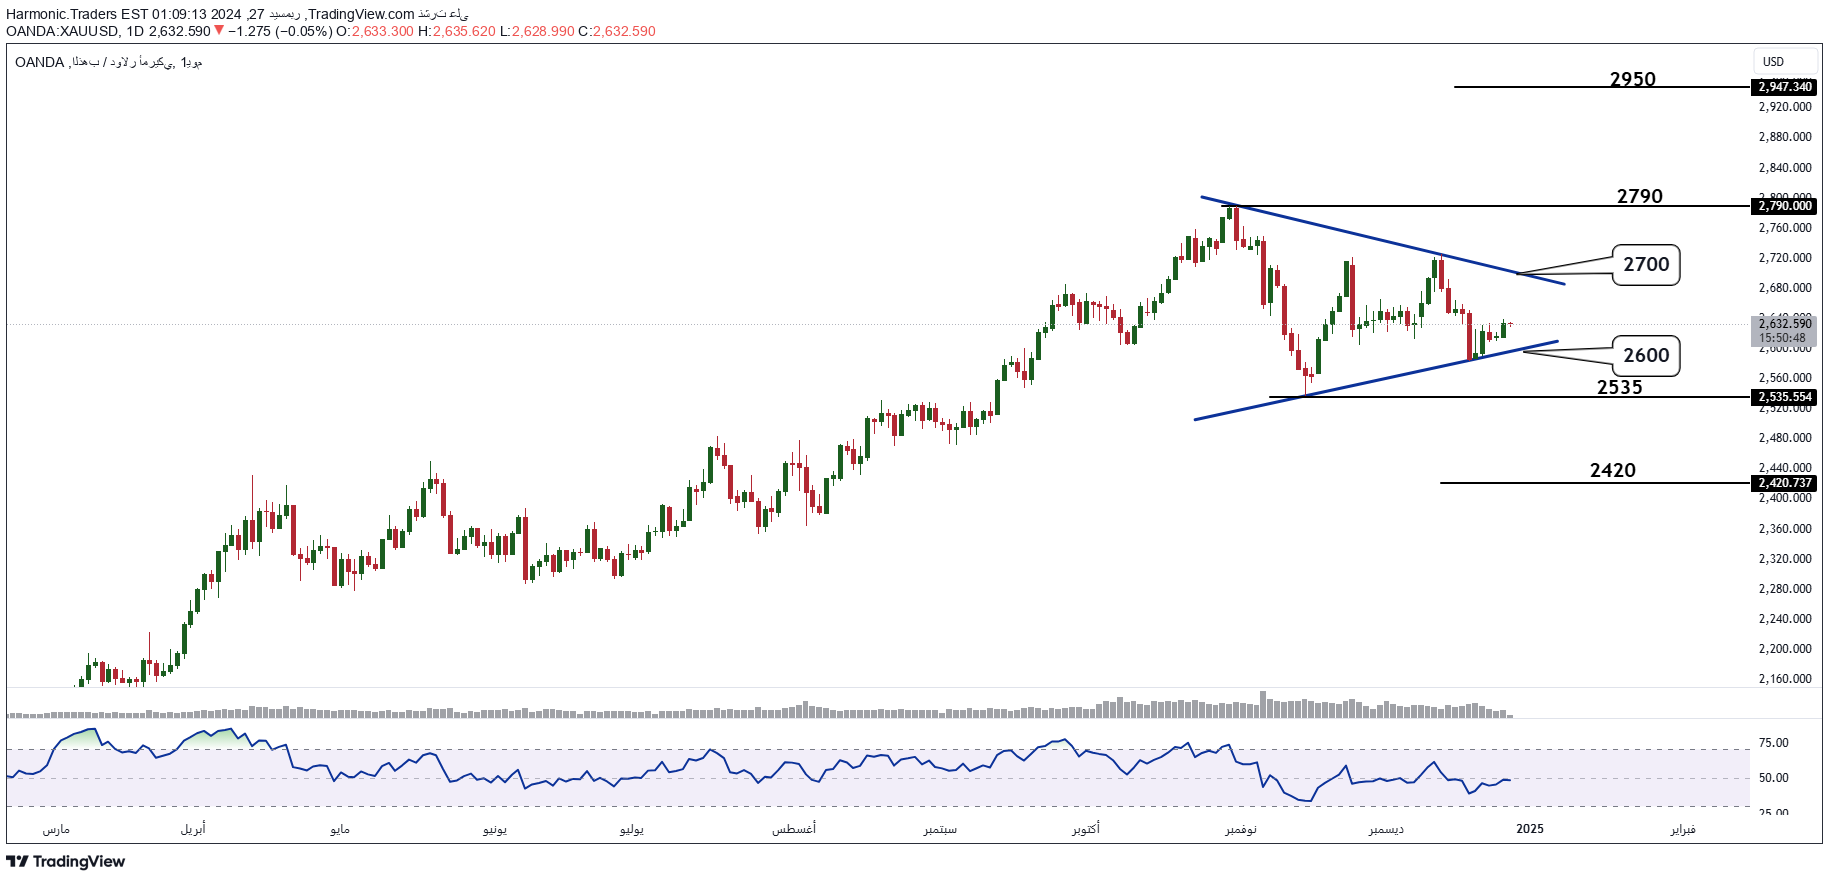
The time frame used is daily for the short-term investor. Prices are trading in a sideways movement at a lower high versus a higher low within a shape that may be a symmetrical triangle with its upper limit at the resistance of 2700. Confirming its upward breakout opens the way for testing the historical peak at 2790. Confirming its upward breakout expects continued upward movement to test the resistance of 2950. On the other hand, it has support at 2600 and confirming its downward breakout faces support at 2535, which is the support of the lowest price at the maximum decline it reached during the recent short period. Confirming its downward breakout opens the way for further decline to test support 2420. Technical indicators confirm the sideways movement. Conclusion: Trading until exiting the current sideways movement, either by breaking the resistances of 2700 and 2790 to adopt positivity or by breaking the supports of 2600 and 2535 to adopt negativity.
