Technical analysis by Harmonic.Traders about Symbol PAXG: Buy recommendation (7/22/2025)

Harmonic.Traders
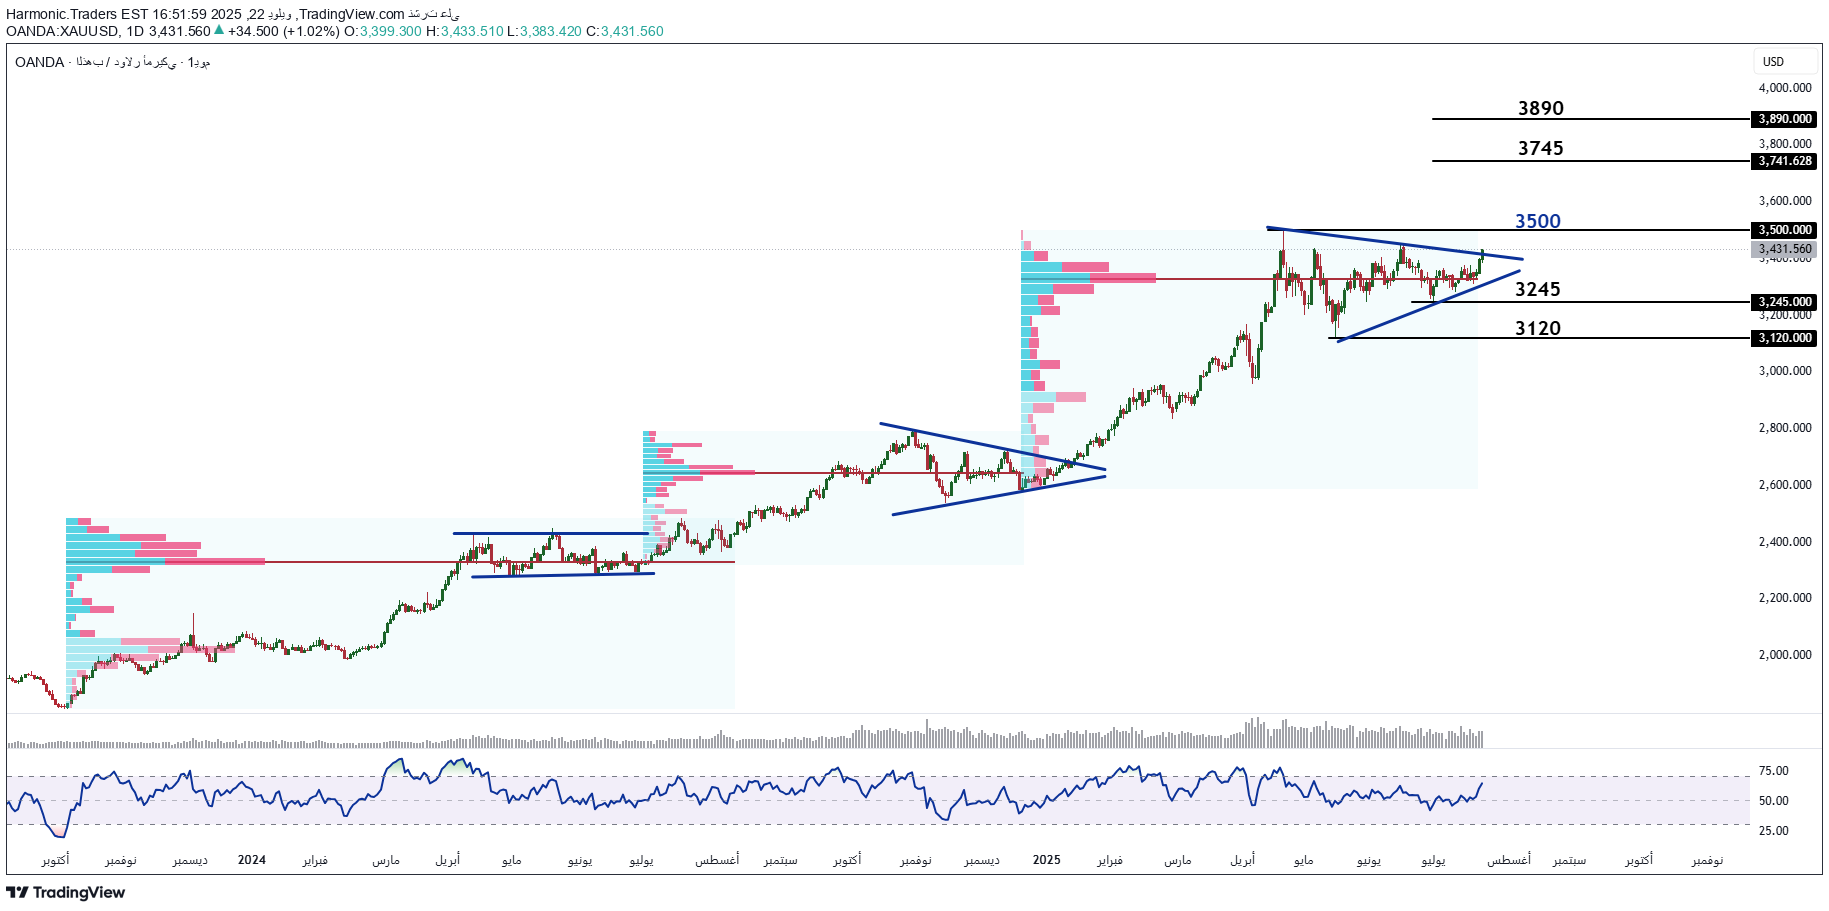
Gold in the short term The time frame used (day) For a short -term investor Technical tools used in the analysis of the price movement, the volume of profile and the RSI relativity index We note that the prices are in a rising general trend, whether in the medium term or in the short term, which is confirmed by the RSI RSI movement, which bounces down from the support of the middle area We also note that the prices in each transverse corrective movement appear, after which the purchasing power appears to begin a new wave of rise, which confirms the indicator of cumulative trading sizes (Volume Profile) With the closure of the day at the top of the upper limit of the similar triangle model, we expect that the prices will start a new wave of rise in which the resistance is tested 3500, which is the resistance of the last historical summit, which is expected to penetrate up to the top of the resistors test 3745 and then 3890 and on the other side this positive view remains and effective as long as the prices did not confirm the breaking of support 3245
