
Hamza_hetic
@t_Hamza_hetic

What symbols does the trader recommend buying?
Purchase History
پیام های تریدر
Filter
Signal Type
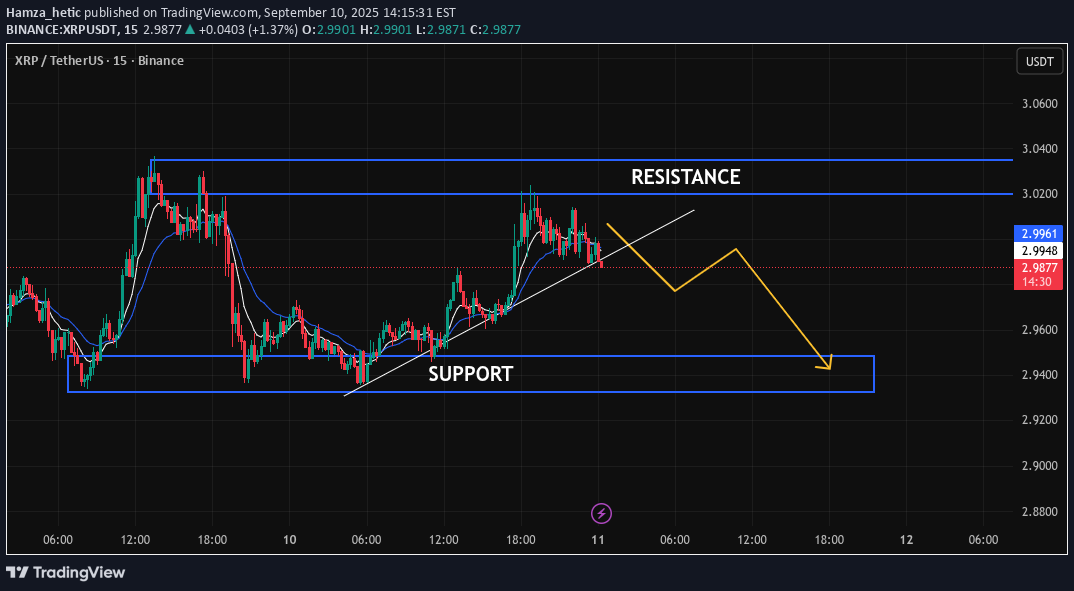
XRP is currently trading near a rising trendline acting as support. The price is facing resistance at the upper zone marked clearly on the chart. If the price fails to hold above the trendline support, it is likely to break down and test the lower support zone. The expected price movement suggests a retracement towards the support zone after a potential small bounce. Traders should watch for a break below the trendline to confirm bearish momentum aiming for the support target. Conversely, a bounce off the support could offer a reversal opportunity.
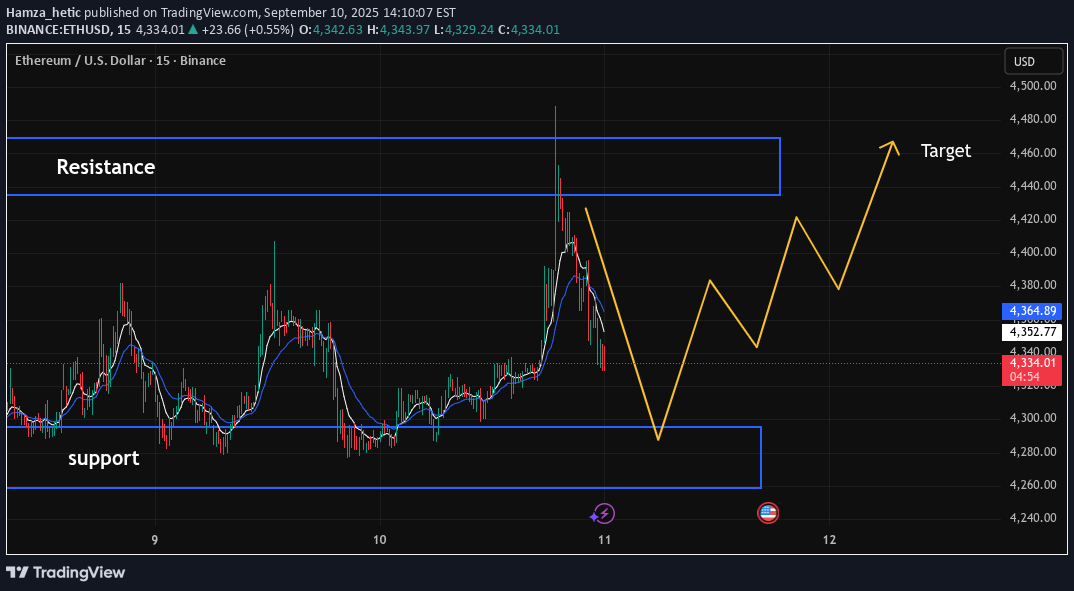
Ethereum (ETHUSD) is currently experiencing a retracement after a recent upward move, pulling back towards a well-defined support zone. This support area has historically acted as a strong demand zone, where buyers are likely to step in. The price action suggests that once ETHUSD reaches this support, we can expect a bounce that may lead to a continuation of the uptrend. Traders should keep an eye on the price behavior around this support zone, looking for bullish reversal patterns or confirmation signals such as bullish candlestick formations or increased buying volume. This would increase the probability of a successful long trade. The target for this potential upward move is the resistance zone highlighted on the chart, which represents a key supply area where sellers could take profit or push the price down. Breaking above this resistance would confirm a strong bullish momentum and could open the door for further gains. In summary, ETHUSD appears to be in a healthy retracement phase, presenting a potential buying opportunity near support with a target at the resistance. However, caution is advised, and traders should wait for confirmation before entering positions to minimize risk.
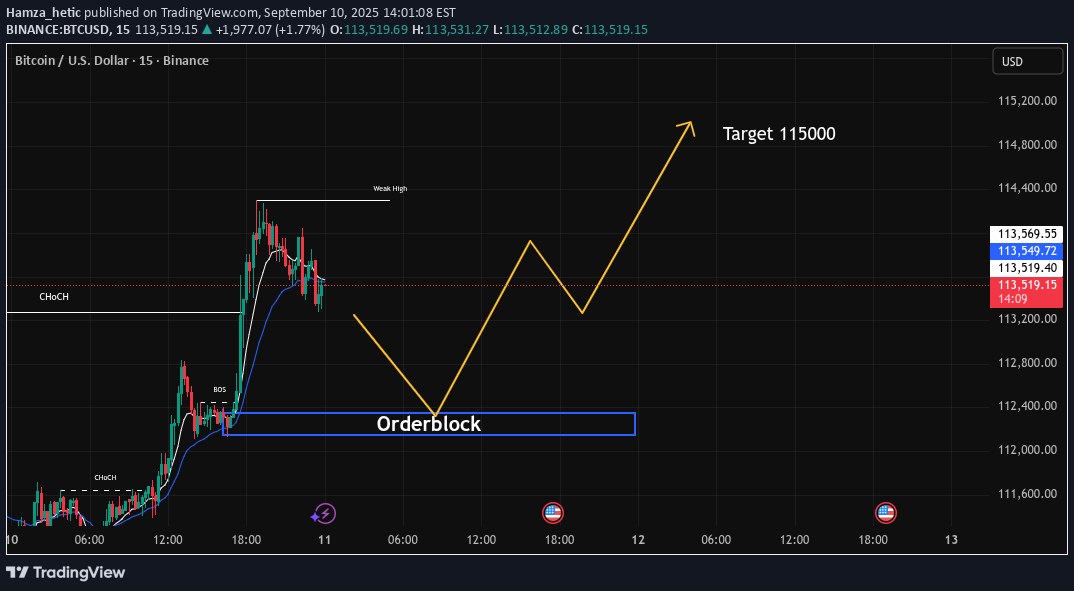
Bitcoin recently broke structure to the upside (BOS) and created a new weekly high, followed by a correction phase. Price is now pulling back and may revisit the bullish orderblock area around 112,800–113,000 for a potential continuation move. 🔍 Key Observations: CHoCH followed by BOS confirms bullish intent. Orderblock zone marked as potential re-entry area. If price respects the orderblock, the next leg higher could target the 115,000 level. Watching for a bullish reaction around the orderblock to confirm continuation. 📈 Bullish Plan: Wait for price to return to the orderblock. Look for bullish confirmation (e.g., engulfing candle or BOS) before entering long. Targeting 115,000 with stops below the orderblock.
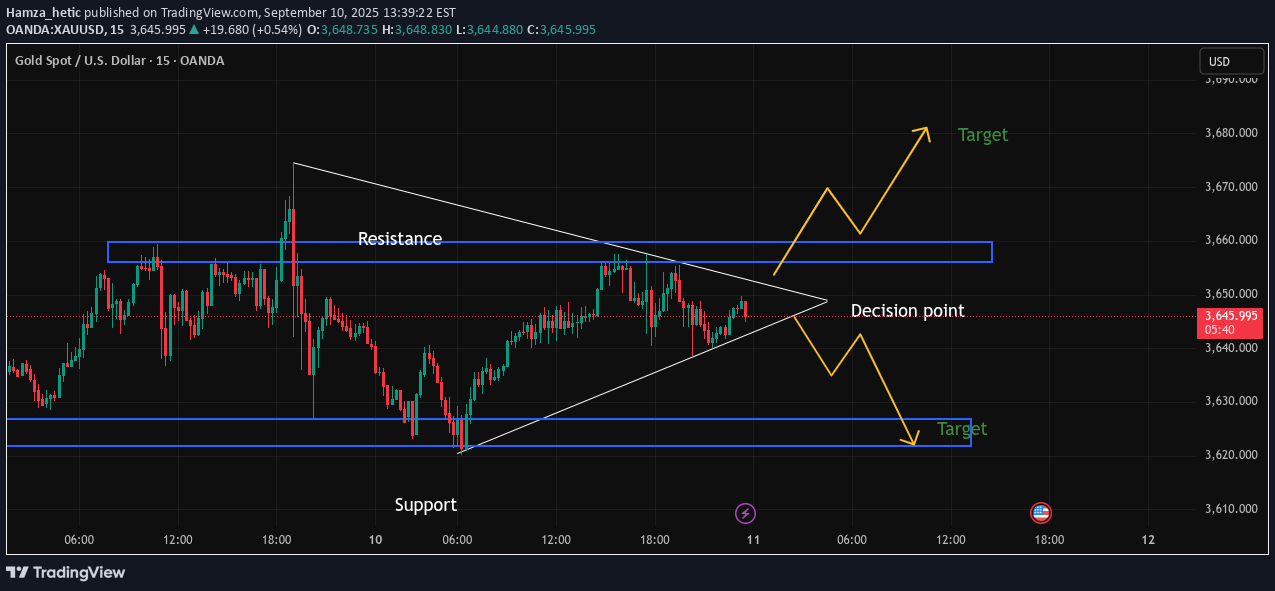
Price is currently consolidating within a symmetrical triangle pattern, approaching a key decision point where a breakout is expected. This structure suggests that a strong move could be imminent in either direction. 🔹 Key Levels: Resistance Zone: Around 3655–3665 Support Zone: Around 3620–3625 Decision Point: Approx. 3647 📈 Bullish Scenario: If price breaks above the triangle and clears the resistance zone convincingly, we could see a continuation to the upside toward the next target zone near 3680. Watch for volume confirmation on breakout. 📉 Bearish Scenario: A breakdown below the triangle support and key zone near 3640 could lead to a deeper move toward the lower support/target area around 3620 or lower. Again, confirmation with momentum is key.
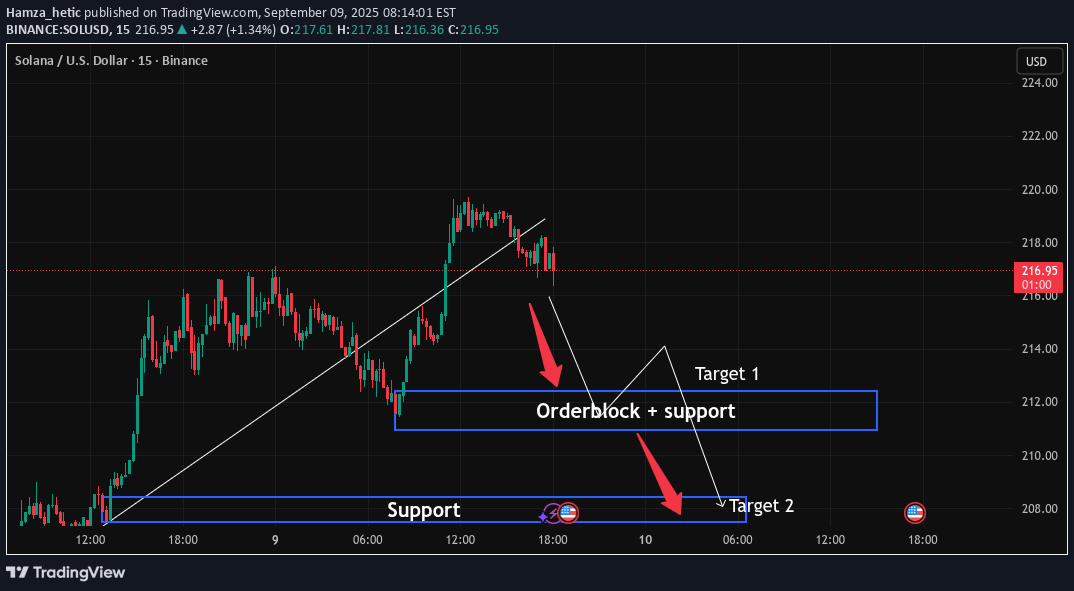
The recent price action shows that SOL has made a strong upward move, marking a significant higher high. However, we’re now observing the early signs of a pullback after the bullish momentum weakened near the $218 resistance level. Notice the steep trendline that supported the previous bullish run—it has now been broken, signaling a possible change in market structure. The momentum appears to be shifting from bullish to neutral or even slightly bearish in the very short term. 🟦 Key Zones Highlighted: Orderblock + Support Zone (Around $214.8–$215.5): This area represents a previous consolidation before the last impulsive bullish move. Often, these orderblocks act as strong zones of interest where institutions may re-enter the market. It also aligns with a horizontal support level, increasing the probability of a short-term bounce if price revisits this level. This is marked as Target 1—a potential take-profit level for short sellers or an entry point for bounce traders. Deeper Support Zone (Below $212, around $210–$211): This is the last major support that held before the price took off in the earlier session. Marked as Target 2, this is where price may head if the current support breaks down. This level will be crucial for bulls to defend if SOLUSD is to maintain its overall bullish structure on higher timeframes. 🔻 Bearish Outlook (Short-Term): Given the breakdown of the trendline and the sharp rejection from the highs, we may be seeing the beginning of a correctional phase. The confluence of signals points toward a possible liquidity grab or orderblock mitigation, which could see price revisit the identified zones before deciding the next directional move. If the price holds above the orderblock and prints a bullish structure, we could see a bounce back to the $218–$220 level. However, if it breaks below the support zone at Target 2, it could open the gates toward sub-$210 levels, offering short sellers further opportunities. 🧠 What Traders Should Watch For: Price Reaction at Orderblock (Target 1): Look for bullish candlestick patterns like bullish engulfing, hammer, or a reversal structure on the 5m/15m. Volume Spike: Increased volume near the support zone could hint at institutional buying or panic selling. Failing to Hold Target 2: A close below Target 2 could invalidate the bullish bias in the short term and confirm bearish continuation. ⚠️ Disclaimer: This is not financial advice. Always conduct your own research and risk management. The analysis is based on historical price action and technical patterns which may not guarantee future results.
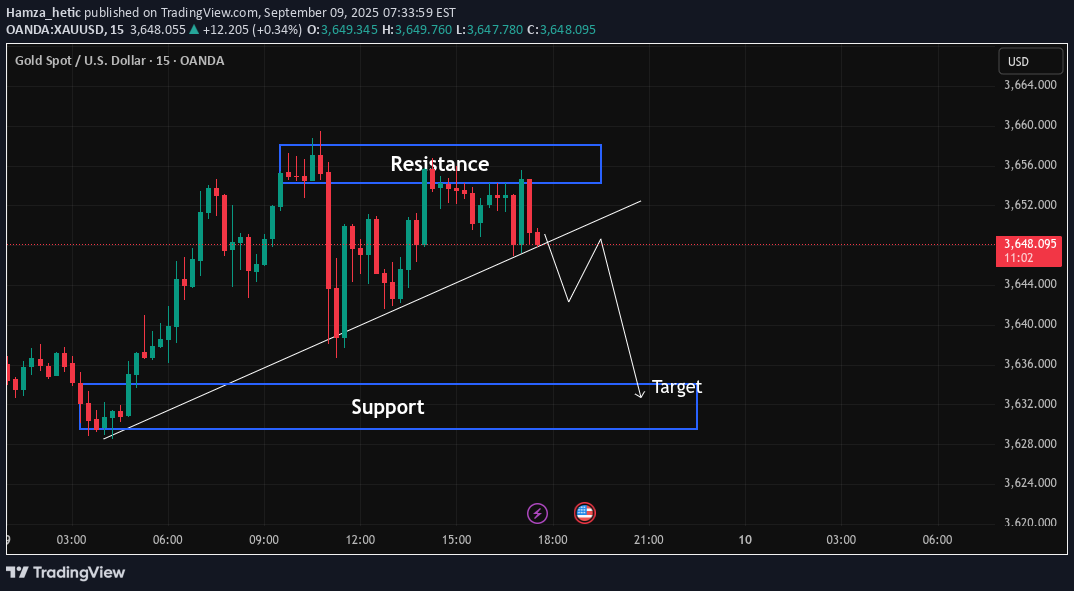
Resistance Level: Marked in blue, this area indicates points where the price has historically struggled to move higher, presenting potential selling opportunities. Support Level: Also marked in blue, this level represents a price floor where buying interest is typically strong, suggesting potential entry points for long positions. Trend Line: The upward sloping line illustrates the prevailing bullish trend, helping traders identify potential breakout scenarios. Price Target: The projected price movement suggests a possible upward trajectory followed by a correction, offering insights into potential trading strategies.
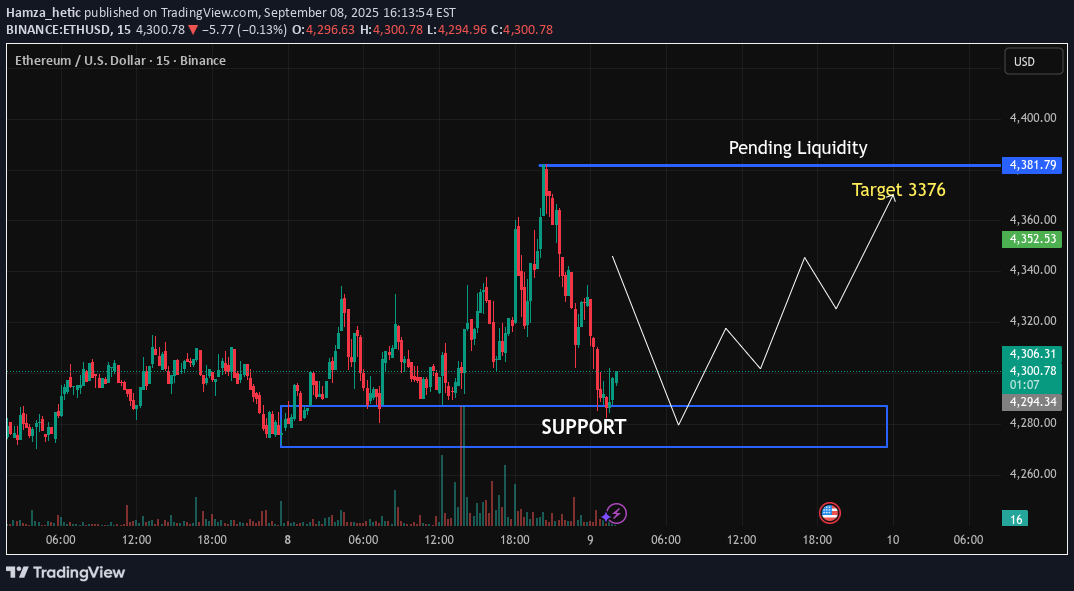
Support Zone Identified: Price action shows a well-established support zone around the $4,280 area. This level has been tested multiple times, confirming it as a strong base for potential bullish moves. Liquidity Pool Observed: A pending liquidity zone is marked near $4,381, suggesting that price may revisit this area to grab liquidity before any major reversal or continuation. Forecasted Move: The chart outlines a potential bullish reversal from the support level, with a projected upward move. The first key target is highlighted around $4,376, likely representing a short-term resistance or profit-taking zone. Price Structure: The suggested price path includes a short-term dip back into the support zone, followed by higher lows and higher highs—a classic reversal formation leading up toward the liquidity zone. ✅ Trade Idea Summary: Support Level: $4,280 – $4,294 Short-term Target: $4,376 Liquidity Zone (Resistance): Around $4,381 Bias: Bullish (while price holds above support) 🔔 Note: Monitor price reaction near support closely. A break below support invalidates the bullish scenario.
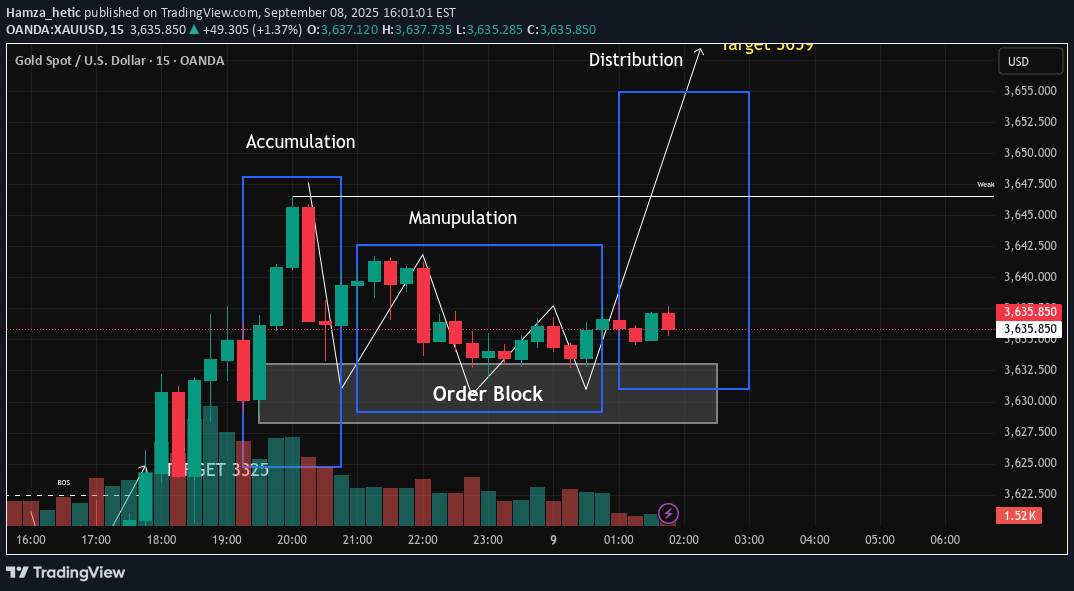
Market Structure Breakdown: 🔹 1. Accumulation Phase Price consolidated in a tight range, forming internal liquidity. Smart money likely accumulated long positions. Confirmed by Break of Structure (BOS) to the upside. Initial move hit Target 3325 as expected. 🔹 2. Manipulation Phase Market faked both sides, creating equal highs/lows to trap retail traders. Two clear CHoCHs (Change of Character) marked internal shifts. Price tapped into a defined Order Block, indicating institutional entry. Liquidity sweep below equal lows confirmed manipulation before move up. 🔹 3. Distribution Phase (Projected) Current price is breaking structure and aiming for the weak high. Expecting a strong bullish move as buy-side liquidity is targeted. Target set at 3659, aligning with smart money distribution logic. ✅ Trade Outlook: Bias: Bullish Key Level: Target 3659 Possible retracement to the Order Block for mitigation before continuation. 💡 Note: This analysis is based on Smart Money Concepts (SMC), including Wyckoff theory elements, CHoCH, BOS, and Order Blocks. 📌 Plan your entries and risk accordingly. Not financial advice.
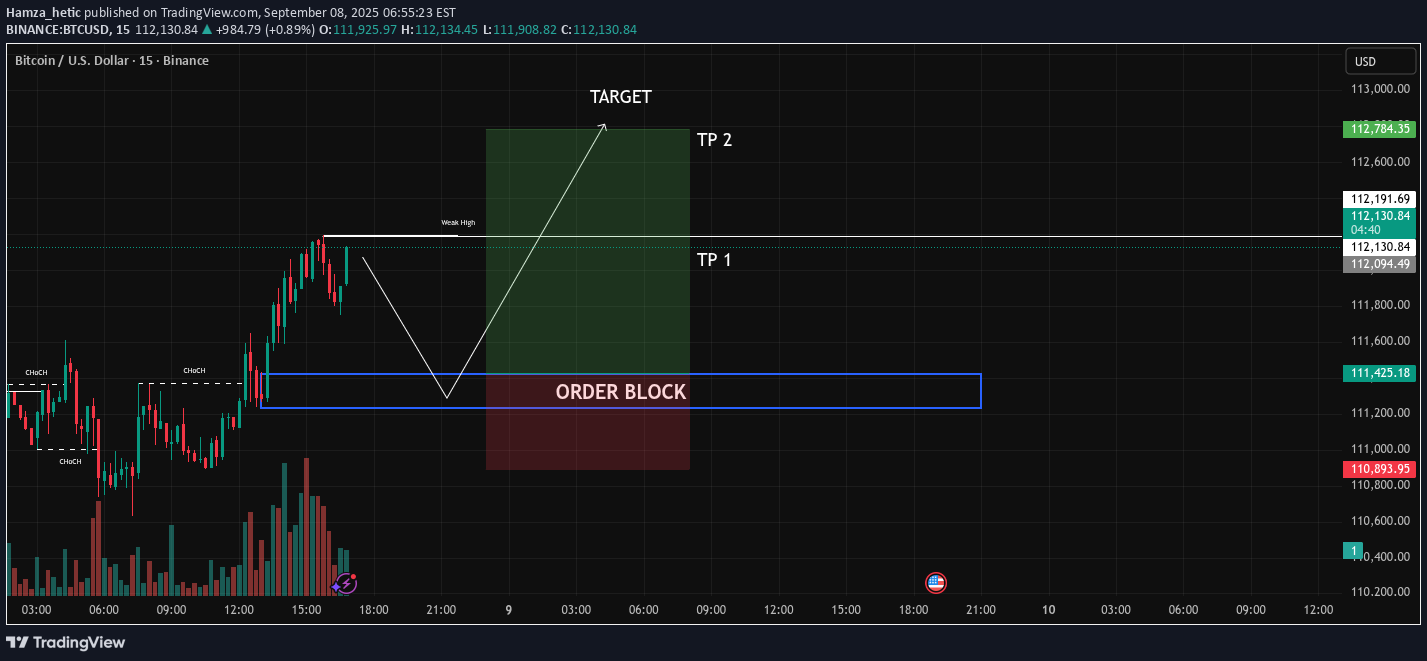
1. Order Block Marked A bearish Order Block zone has been highlighted where price previously consolidated before a strong downward move. This area is expected to act as resistance if the price retests it. 2. Entry Zone The white zigzag line shows a potential retracement into the Order Block, where the short entry is planned. 3. Stop Loss (SL) The red zone above the Order Block indicates the Stop Loss area, protecting against a bullish breakout. 4. Targets (TP1 & TP2) TP1: The first take-profit level, placed at a nearby support zone. TP2: A deeper target further below, anticipating continuation of the bearish momentum. 5. Risk–Reward Ratio (RRR) The green zone shows profit targets vs. the red zone (risk). This looks like a favorable RRR setup, aiming for at least 1:2 or better. Market Sentiment: Current trend appears bearish on the short-term timeframe (15m), with lower highs and lower lows visible before the setup. The order block is being used as a confirmation zone for short positioning. Summary: This chart outlines a short trade plan on BTC/USDT using an Order Block strategy. The trader expects price to retrace into the highlighted zone, reject it, and then continue downward toward TP1 and TP2, while managing risk with a tight Stop Loss above the Order Block.
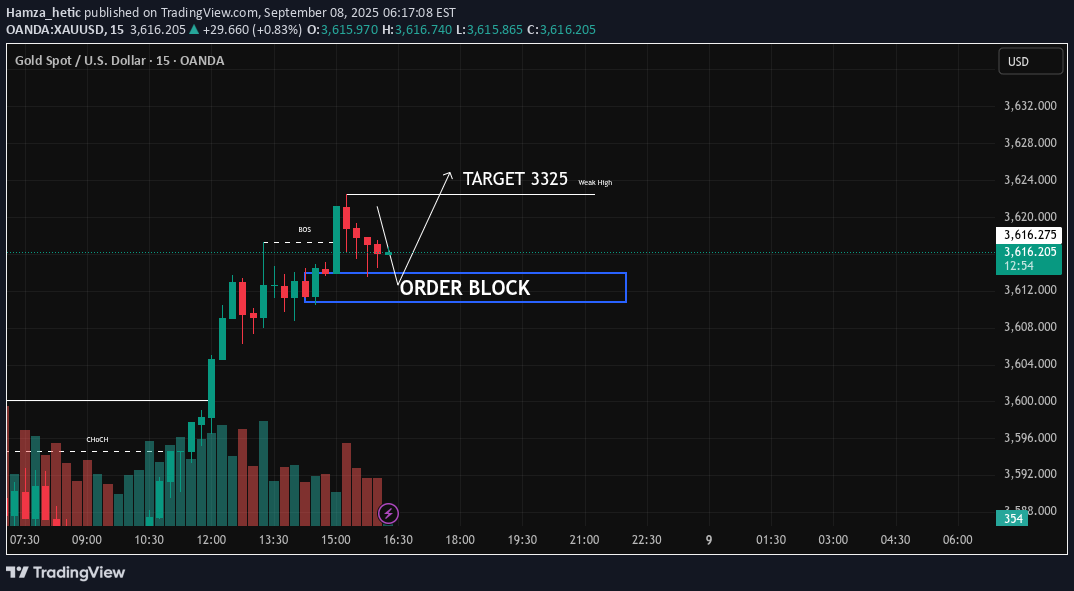
Price is currently consolidating after a strong bullish push and is showing signs of a potential retracement into the highlighted Order Block zone (3612 area). If price respects this demand zone and confirms bullish momentum, we can expect a reversal back to the upside. The projected move aligns with a bullish structure continuation, targeting the 3325 level, which is marked as the next key liquidity point. This setup is based on a BOS (Break of Structure) confirmation, retest of the order block, and then a continuation move towards the upside target. A clear rejection from the order block will be a strong confluence for entering long positions.
Disclaimer
Any content and materials included in Sahmeto's website and official communication channels are a compilation of personal opinions and analyses and are not binding. They do not constitute any recommendation for buying, selling, entering or exiting the stock market and cryptocurrency market. Also, all news and analyses included in the website and channels are merely republished information from official and unofficial domestic and foreign sources, and it is obvious that users of the said content are responsible for following up and ensuring the authenticity and accuracy of the materials. Therefore, while disclaiming responsibility, it is declared that the responsibility for any decision-making, action, and potential profit and loss in the capital market and cryptocurrency market lies with the trader.