
GreenZoneCapital
@t_GreenZoneCapital

What symbols does the trader recommend buying?
Purchase History
پیام های تریدر
Filter
GreenZoneCapital
S&P 500 Future Outlook: Targeting 7,000 by 2026
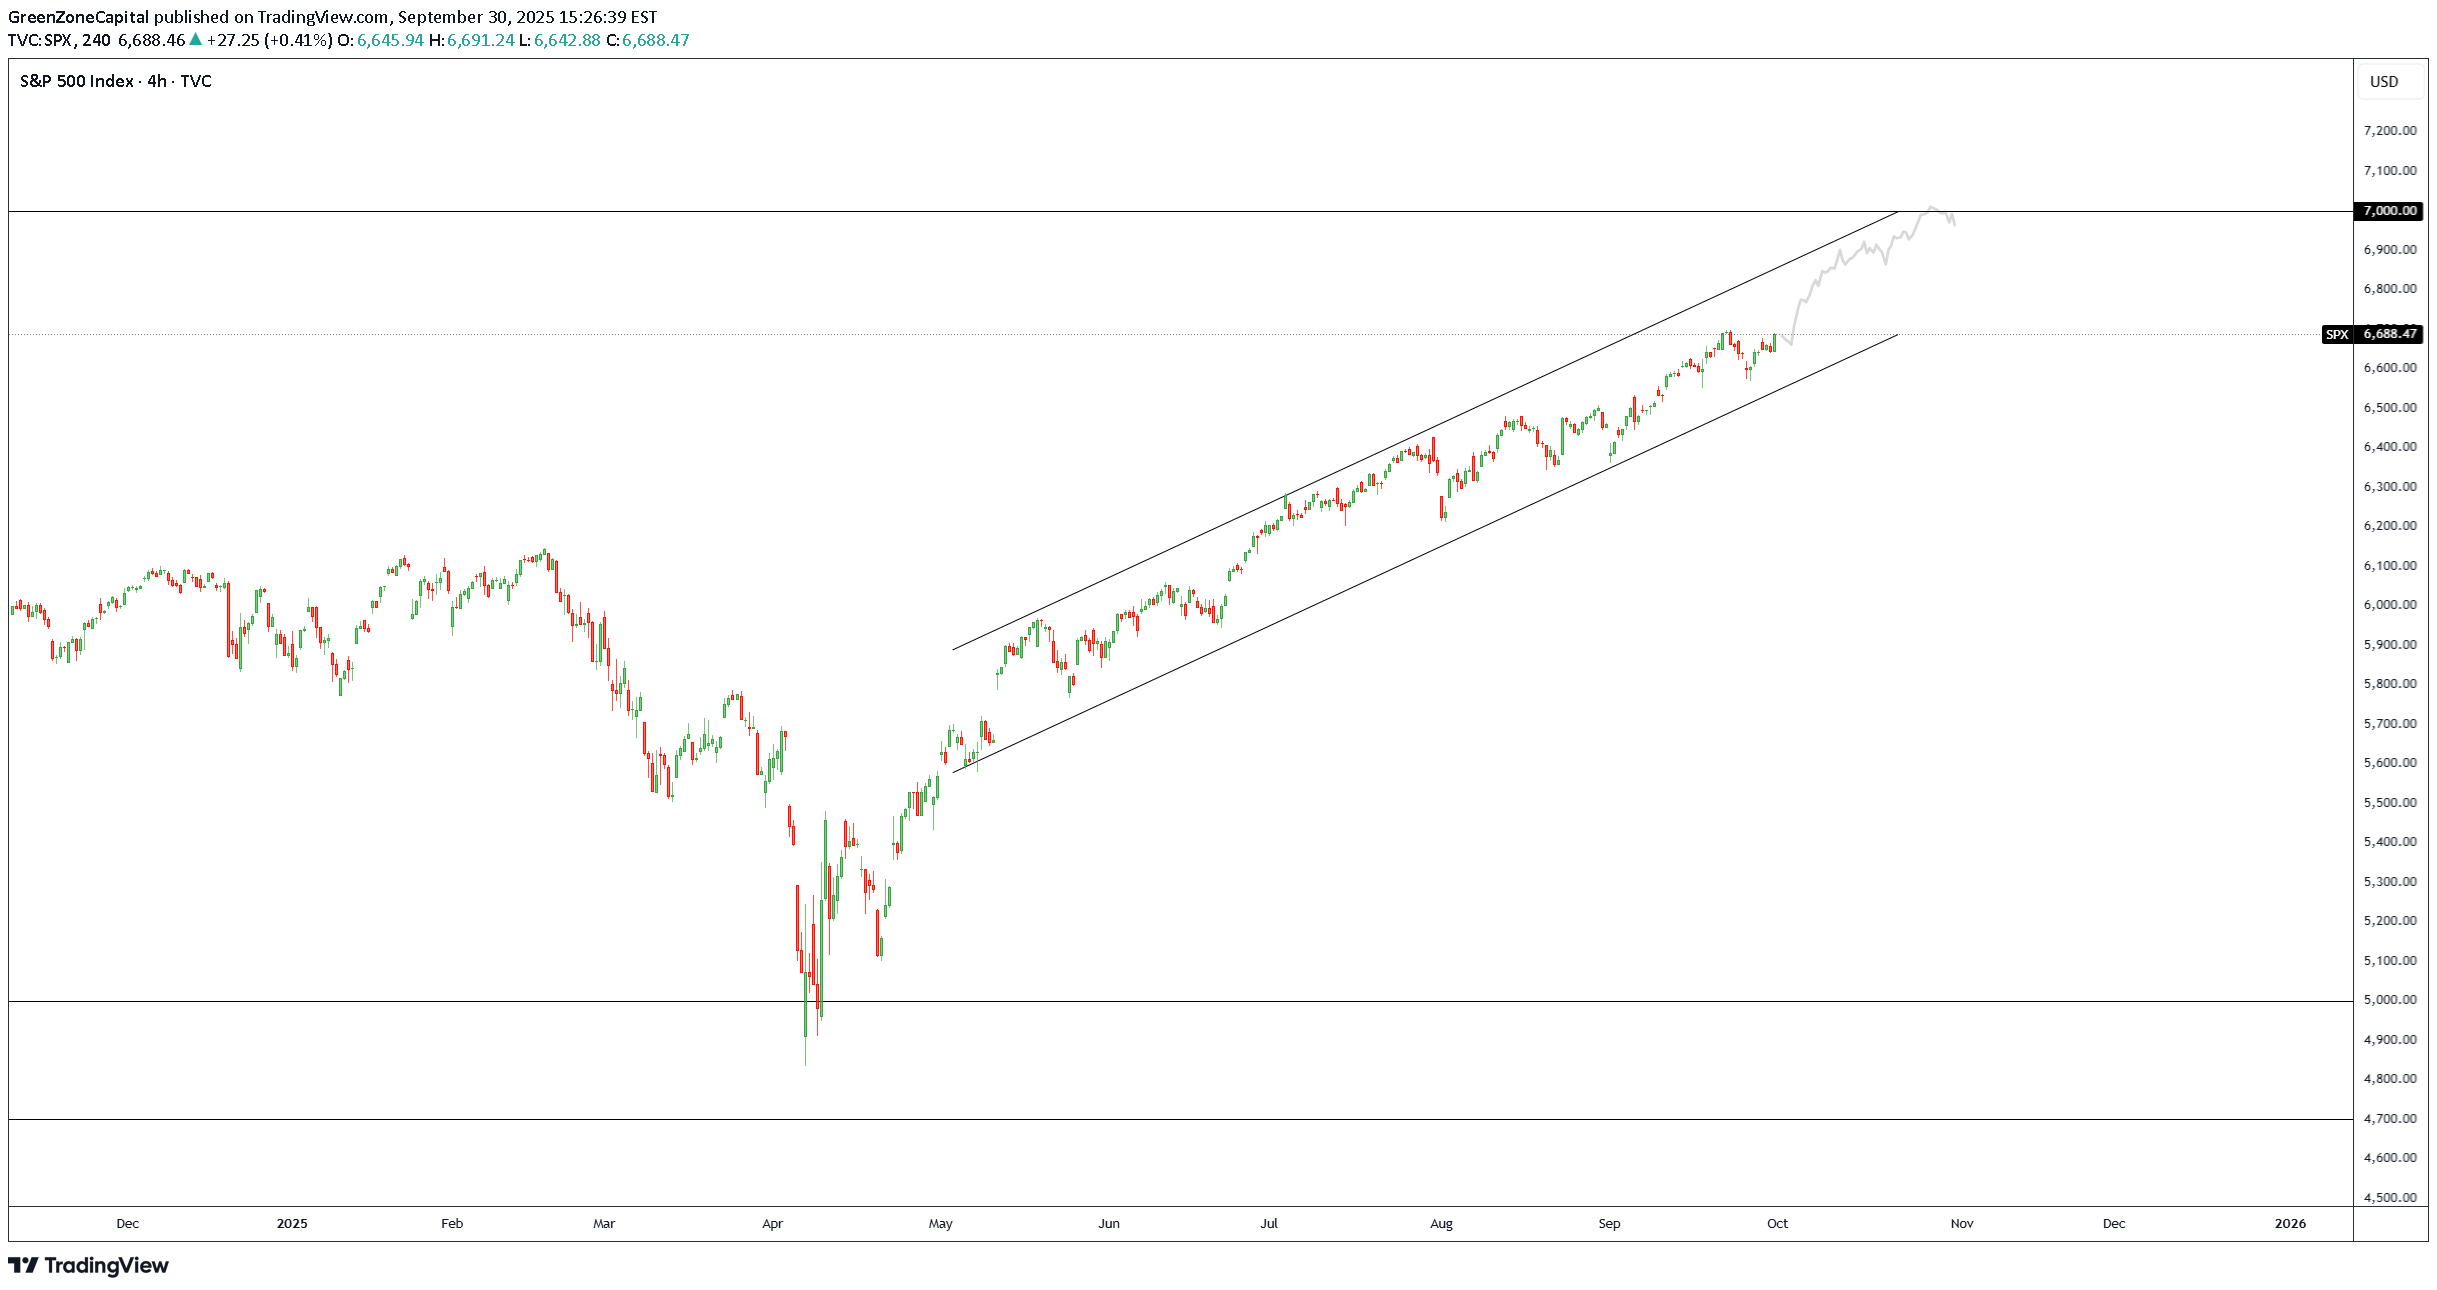
Overview Summary The SPX has staged an impressive recovery throughout 2025, breaking free from the spring correction and climbing within a well-defined rising channel. Many anticipated September to be a bearish month based on historical trends, but momentum is continuously being fueled by resilient earnings, AI-driven productivity themes, and renewed capital inflows. With price currently consolidating around the mid-6,600s, our outlook anticipates a continuation of this structural uptrend toward the psychological 7,000 level, aligning with both technical momentum and macro capital drivers. Technical Analysis The index is trending within a clear ascending channel, respecting both upper and lower boundaries since Q2. Each pullback has found consistent demand along channel support, followed by strong recoveries. As shown in our TradingView chart analysis, projected channel extension carries SPX toward 6,900–7,000 by year end. Key Support Entry: 6,500-6,600 Key Resistance Target: 6,900–7,000 A clean break and close below 6,300 would invalidate near-term bullish structure and open risk toward deeper supports near 6,000. Macro/Fundamental Thesis Macro conditions remain a dual force. On one hand, AI investment, corporate buybacks, and strong tech leadership ( NVDA , AMD , SMCI , ANET ) are powering higher valuations. On the other, elevated rates, energy costs, and global growth uncertainty remain constraints. Capital rotation into equities continues as investors seek exposure to U.S. resilience and innovation themes. Overall, the index remains supported by structural liquidity and the digital infrastructure super cycle. A decisive test of $7,000 is our base case as long as buyers continue defending channel support zones. Green Zone Capital Bias: Long Type: Trend Continuation Entry Zone: 6,500–6,600 (pullback buys) Target: 7,000+ (psychological milestone + channel projection) Invalidation: Break below 6,300 (channel support) Conclusion The SPX continues to trade within a constructive uptrend, supported by both technical structure and macro demand for U.S. equities. As long as buyers defend the mid-6,300 support area, the broader market remains positioned for continuation toward the 7,000 milestone. This level represents not only a psychological benchmark but also the upper boundary of the current channel extension. While volatility and pullbacks should be expected, the prevailing trend favors strength, and disciplined accumulation within support zones offers attractive risk-reward for long-term investors.
GreenZoneCapital
Apple Inc (APPL): Trend Continuation to $300+
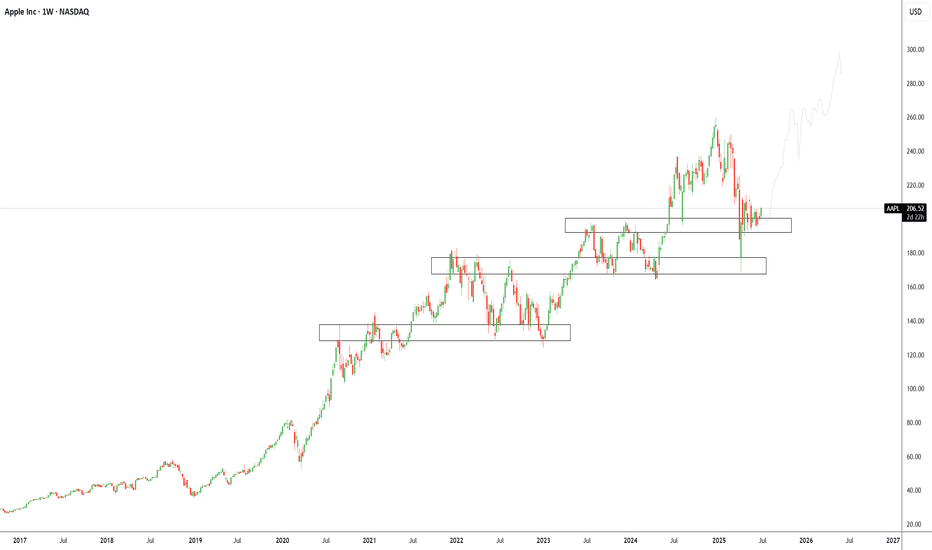
Overview Summary We’ve added new long positions on Apple ( AAPL ) recently after a textbook rejection from a well-established support/demand zone between $185–$200. This area has consistently acted as a launchpad for previous rallies and is now once again serving as a structural support on the weekly timeframe. Apple’s ability to consistently innovate through product cycles, expand its services ecosystem, and integrate AI-driven features into its devices provides strong conviction for long-term upside. With Vision Pro, Apple Intelligence, and chip-level innovations underway, the company is positioning itself to benefit from both hardware and software expansion over the next decade. Technically, the price has formed a multi-year stair-step structure with clear levels of accumulation. We believe AAPL is beginning its next leg higher after consolidating above this zone. A clean move to retest all-time highs is likely, and a long-term target of $300 aligns with both trend structure and growth potential. Green Zone Capital remains bullish on AAPL with a long-term horizon and will continue to scale into strategic pullbacks within the broader uptrend, our current setup is: Bias: Long Type: Long-Term Accumulation Entry Zone: $190–$205 Target: $300+ Invalidation: $165 Technical Analysis: Apple is currently sitting at a critical demand zone that has historically acted as a base for previous multi-month rallies. Our TradingView chart highlights several key structural zones showing Apple’s tendency to build stair-step accumulation ranges followed by breakouts. The current zone between $185–$205 has been tested and held multiple times, confirming its significance. We are seeing bullish rejection candles forming on the weekly timeframe, showing buyer interest is returning. This confluence of technical support and long-term structural demand confirms our long entry thesis. Macro/Fundamental Thesis: Apple remains one of the strongest tech companies globally with unmatched brand equity, pricing power, and integration across hardware, software, and services. The company continues to expand aggressively into AI with Apple Intelligence, spatial computing with Vision Pro, and strategic chip development. With record cash reserves, a loyal consumer base, and continued innovation cycles across iPhone, Mac, and Services, Apple remains a strong defensive and offensive tech allocation in any long-term portfolio. Despite current macro volatility, Apple has consistently outperformed over market cycles.
GreenZoneCapital
Bitcoin (BTCUSD) Break & Retest of ATH Signals Uptrend to $120K?

Overview Summary Bitcoin ( BTCUSD ) is retesting a major zone after its breakout above the previous ATH resistance zone of $105K–$107K, a level that previously marked the top of the 2024 cycle before it pulled back to $76K. This chart now shows BTC pulled back from $111K highs, potentially validating a classic "break and retest" pattern and continuation of the overall trend. Price action is unfolding within a clean ascending uptrend channel structure that has defined the bull trend since late March. With BTC currently testing the upper boundary of this previous major resistance zone ($105K–$107K), this area now acts as the "make-or-break level" for the long awaited bull run. If buyers continue to hold this level, the market may resume its upward momentum with heavy strength, opening the door to the next leg towards our medium term target of $120K+ as projected by the channel extension. However, a decisive close below $105K would invalidate this near-term structure and suggest deeper consolidation or a sentiment reset. Key Technical Structure Major Resistance & Support: $105K–$107K Trend Channel: Active Short Term Resistance: $112K Key Target Zone: $118K–$122K Invalidation Zone: < $105K Why This Setup Matters This is a textbook breakout retest structure, when previous cycle highs are reclaimed and flipped into support, it often sets the stage for rapid continuation. The fact that BTC is pausing here rather than collapsing suggests the market is preparing for this decision. Break & Retest at this current price zone would: Reinforce bullish market structure Invite trend-following buyers and institutions waiting for confirmation Set up asymmetric long entries targeting $120K Signal broader strength across the crypto market, likely dragging other cryptos upward Future Outlook & Trade Setup If BTC respects the $105K–$107K zone, we anticipate a strong push toward the next major resistance zone between near $120K. Watch for volume and wick rejection to confirm demand. Trade Plan (If Support Holds) Entry: < $107K Short-Term Target: $112K Long-Term Target: $120K+ Invalidation: Break below $105K Final Take Bitcoin is at a pivotal zone where market memory and technical structure converge. If this retest holds, it validates a breakout continuation structure with room to run toward $120K+. If this zone fails, we expect a deeper retest into $100K–$102K or lower.
GreenZoneCapital
Solana (SOLUSD) at Pivotal Weekly Zone – Uptrend or Downtrend?

Summary: SOLUSD Solana is currently consolidating at a high-impact decision zone on the weekly chart, around the $125–130 range. This level has historically acted as a strong support-turned-resistance zone and now forms the basis of a technical inflection point where market pressure is building. Price action has consolidated around this region multiple times since 2023, and we are now seeing compression within a broader market structure. This is the ideal equilibrium level where bulls and bears will fight to gain control — making this a prime zone to either build long positions or prepare for a short swing, depending on which side breaks out first. Technical Analysis: Entry Zone: $125–130 — former support and now a pivotal area for direction. Outlook: Neutral until confirmation — expecting significant moves in either direction. Uptrend Target: $180 (next major supply zone) Downtrend Target: $85 (next major demand zone) Green Zone Capital Insights: This is a time to reconsider sitting sidelined in cash, prepare for positioning. Whether long or short, Solana’s current level is one of the cleanest setups we've seen this quarter. As soon as we see clear confirmation on the weekly close and fundamental alignment — we’ll be deploying capital accordingly. Follow Green Zone Capital for real-time updates, execution plans, and chart analysis.
GreenZoneCapital
Polkadot $DOT 2025

GreenZoneCapital
Break and Retest: Solana Bullish price action

Break and Retest: Solana Bullish price action After this impulse broke us out of some consolidation we can see price action pulling back down. This is a good sign seeing that price action comes down as quickly as it did, showing that people are ready for the next impulse upwards. We can potentially see price action on SOL continue upwards over the next few days/ weeks. In regards to our previous post we have mentioned our full target being $200+
GreenZoneCapital

Disclaimer
Any content and materials included in Sahmeto's website and official communication channels are a compilation of personal opinions and analyses and are not binding. They do not constitute any recommendation for buying, selling, entering or exiting the stock market and cryptocurrency market. Also, all news and analyses included in the website and channels are merely republished information from official and unofficial domestic and foreign sources, and it is obvious that users of the said content are responsible for following up and ensuring the authenticity and accuracy of the materials. Therefore, while disclaiming responsibility, it is declared that the responsibility for any decision-making, action, and potential profit and loss in the capital market and cryptocurrency market lies with the trader.