
GreenCryptoTrades
@t_GreenCryptoTrades

What symbols does the trader recommend buying?
Purchase History
پیام های تریدر
Filter
GreenCryptoTrades
سیگنال صعودی HYPE: شکست مثلث با تاییدیه قوی (آماده جهش تا ۳۶ دلار؟)

HYPEUSDT has recently broken out of an Ascending Triangle pattern on the 4-hour timeframe, indicating a potential shift toward bullish continuation. This pattern reflects sustained higher lows with strong horizontal resistance, and the breakout suggests buyers are now in control. Price action is currently holding comfortably above the 50 EMA, which is acting as a dynamic support. This confirms bullish structure and increases the probability of continuation rather than a false breakout. Any healthy pullback toward the breakout zone or EMA may provide a better risk-reward opportunity. In addition to technical strength, volume has expanded noticeably, supporting the validity of the breakout. Since HYPE is a #DEX platform token, the recent increase in platform activity and participation adds a fundamental tailwind to the bullish setup. Overall bias remains bullish as long as price sustains above the breakout structure. Traders should continue to manage risk properly and keep a strict stop loss, as crypto markets remain highly volatile. This setup favors disciplined execution rather than aggressive leverage. HYPE Currently trading at $25.8 Buy level : Above $25.5 Stop loss : Below $23 Target 1: $28 Target 2: $30 Target 3: $32 Target 4: $36 Max leverage 3x Always keep stop loss Follow Our Tradingview Account for More Technical Analysis Updates, | Like, Share and Comment Your thoughts
GreenCryptoTrades
سولانا (SOL) سقف قیمتی میشکند؛ هدف جدید ۲00 دلار!

SOLUSDT is trading above the 50 EMA on the 4H chart. a strong sign for short-term momentum. If you look closely, it has also broken out of an ascending triangle pattern and is moving upward with solid volume. We’re expecting a potential upmove from here, with a short-term target around $200. Always remember to set your stop loss and manage your risk wisely. SOLUSDT Currently trading at $167 Buy level : Above $165 Stop loss : Below $154 Target 1: 175 Target 2: 200 Max leverage 3x Always keep stop loss Follow Our Tradingview Account for More Technical Analysis Updates, | Like, Share and Comment Your thoughts
GreenCryptoTrades
بیت کوین در نقطه حساس: تاریخ چه میگوید؟ آیا منتظر جهش به ۱۵۰ هزار دلار هستیم؟

BITCOIN is currently trading above the 50 EMA on the 1W chart, a level that has historically acted as a strong dynamic support during previous bullish cycles. Each time BTC has touched the 50 EMA in the past (as highlighted on the chart), it has triggered a strong rebound leading to significant upside moves. Currently, the price is consolidating near both the support zone and the 50 EMA, suggesting that the market is once again at a critical juncture. If BITCOIN manages to hold this zone and bounce, we could see the next bullish leg pushing towards $150K. However, a clean break below the 50 EMA and support area could indicate a short-term downtrend or deeper correction before resuming the uptrend. Traders should stay patient and prepared for all possible scenarios. Risk management remains key at these levels.Plan your entries and stops accordingly.As we predicted, Bitcoin just touched the 50 EMA on the weekly chart! Now we wait for the weekly close. It needs to stay above the support zone. If it drops below, we might see a small correction. Stay patient, big moves come with time!
GreenCryptoTrades
اتریوم زیر 4000 دلار: آیا گاوها آماده جهش بزرگ به سمت 8000 دلار هستند؟
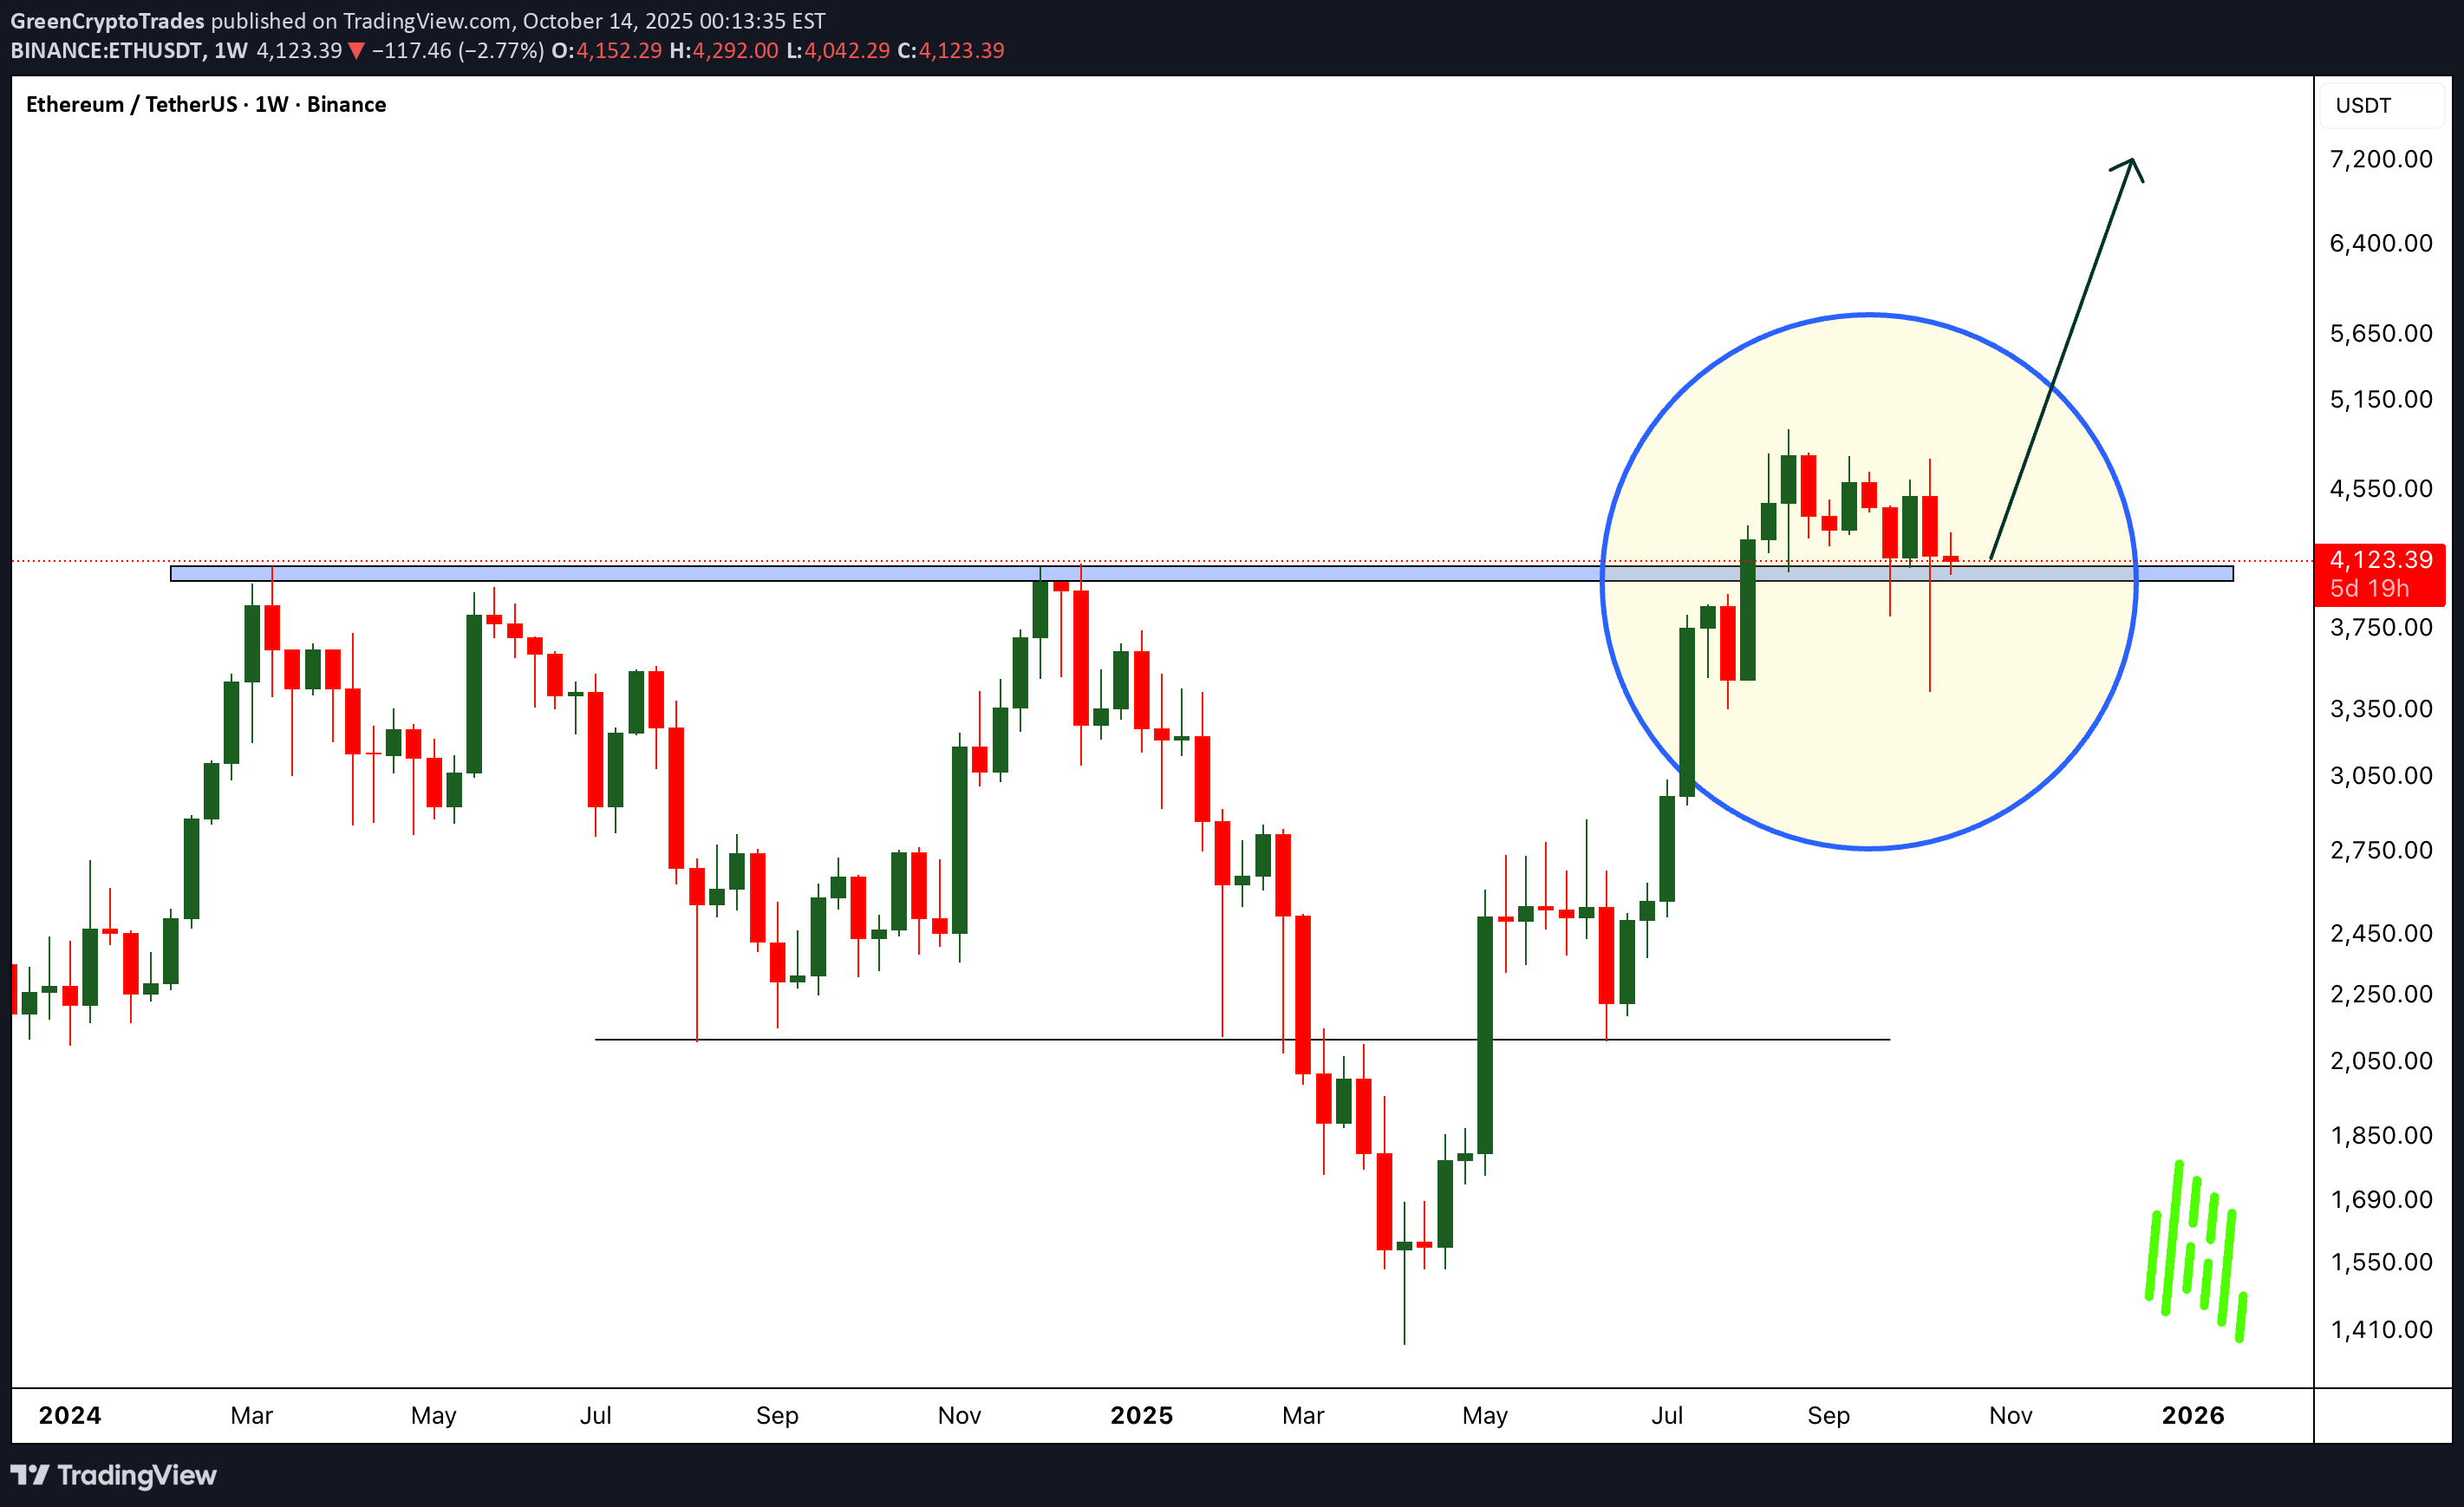
After breaking out from a major resistance, ETHUSDT delivered a clean and healthy retest, just as expected. The bounce from that level showed strong buyer confidence, confirming that bulls are still in control. Currently, Ethereum is holding a crucial support zone around the $4000 range. This level will play a key role in determining the next big move. If ETH manages to sustain and bounce from here, we could see the price rallying towards the $7000–$8000 zone in the coming weeks. However, traders should stay cautious, a drop below $3500 could signal further downside and a deeper correction. As always, risk management is key in every setup. Watch the $4000 zone closely, the next ETHUSD wave could be massive! Follow Our Tradingview Account for More Technical Analysis Updates, | Like, Share and Comment Your thoughts
GreenCryptoTrades
SUIUSDT Weekly Outlook!! Target $10
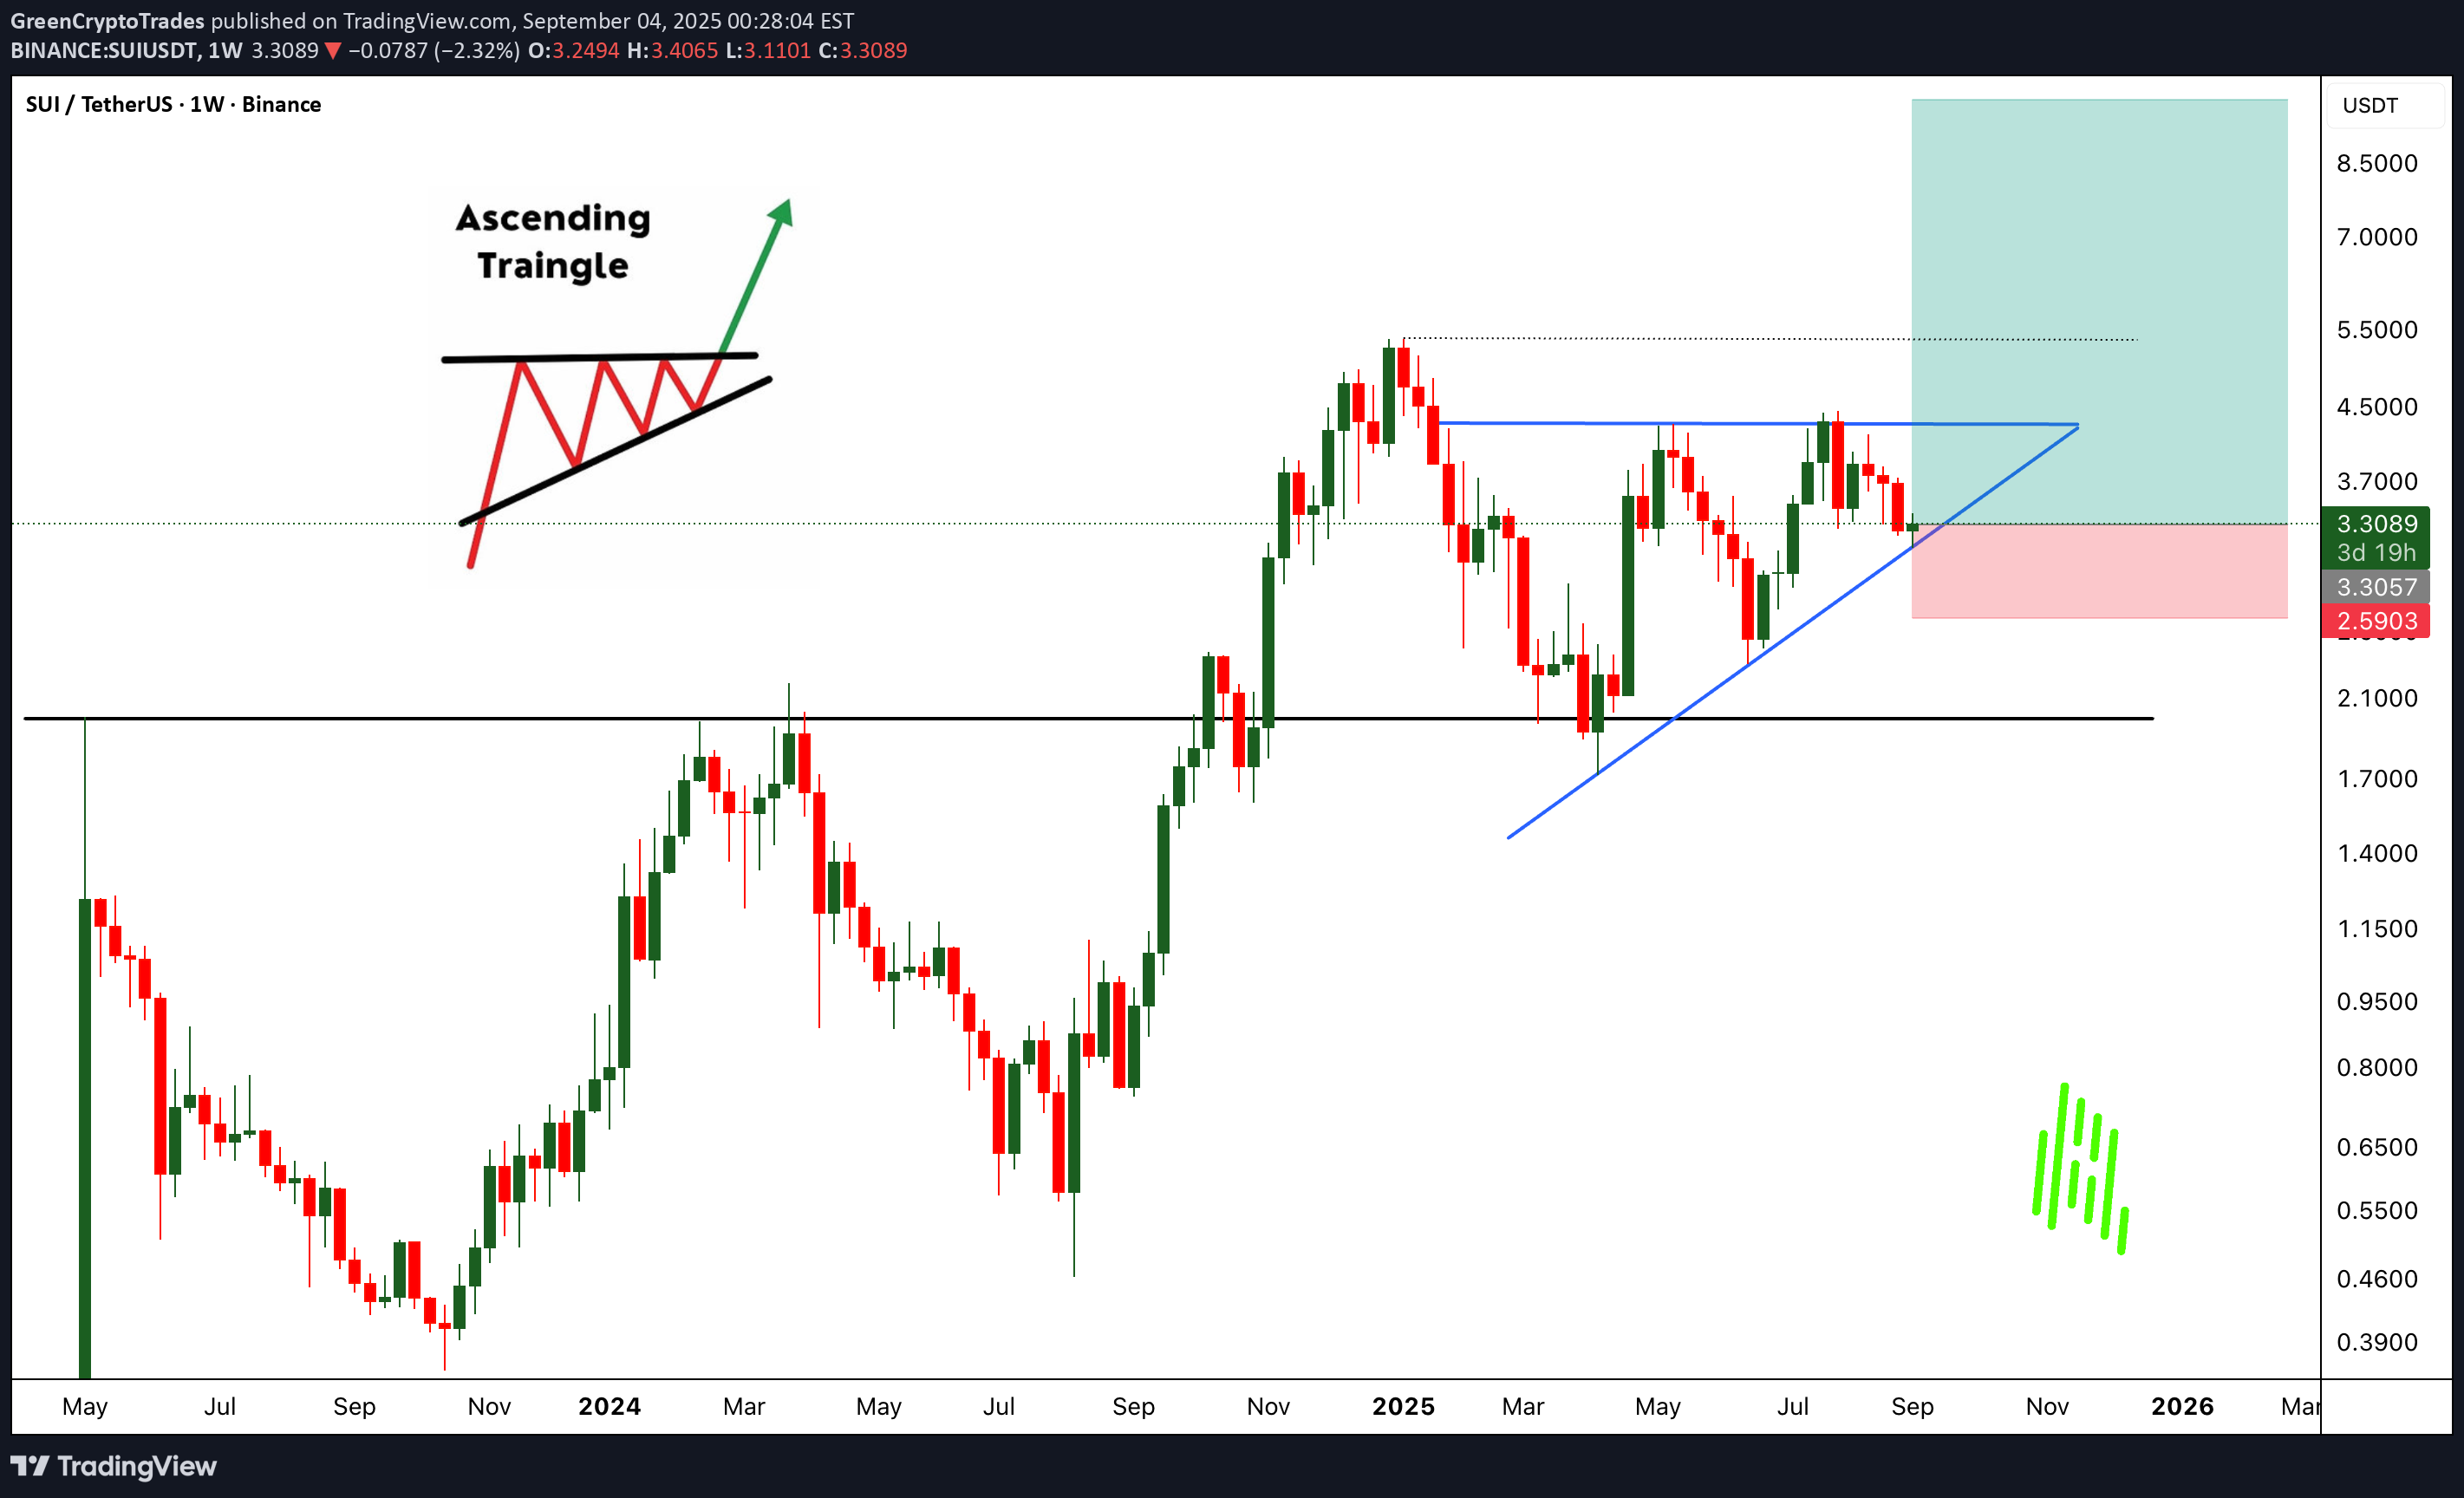
SUI has once again bounced strongly from its key support zone, making it the third touch at this level. Each time price defends this area, it reinforces the strength of buyers stepping in, showing that demand remains intact. On the weekly chart, SUIUSDT is now shaping a clean Ascending Triangle pattern. This is typically a bullish continuation setup, and the structure is becoming clearer with every retest. The longer price consolidates under the resistance, the stronger the breakout move is likely to be once bulls finally push through. All eyes remain on the $4.4 breakout level. A successful close above this resistance could open the door for a powerful move to the upside. My target remains unchanged at $10, supported by the bullish technical formation and repeated validation of support. SUIUSDT Currently trading at $3.3 Buy level : Above $3.3 Stop loss : Below $2.62 Target 1: $4 Target 2: $5 Target 3: $7 Target 4: $10 Max leverage 2x Always keep stop loss Follow Our Tradingview Account for More Technical Analysis Updates, | Like, Share and Comment Your thoughts
GreenCryptoTrades
XLMUADT Ready for Another Moonshot After Bullish Flag Breakout!

$XLMUADT has just broken out of a well-formed bullish flag pattern, signaling the potential start of a strong upward move. This comes after its earlier breakout from a rising channel, which delivered impressive gains to traders who caught the move. The current breakout setup mirrors that previous rally, and if history repeats, we could be looking at another powerful uptrend in the making. With momentum building and technicals aligning, buyers seem to be taking control again. However, as always, risk management is key, keep a strict stop loss in place to protect capital and lock in profits as the move unfolds. The market has already shown us what XLM can do, and this breakout might just be the next big opportunity. $XLMUADT Currently trading at $0.44 Buy level : Above $0.415 Stop loss : Below $0.35 Target 1: $0.522 Target 2: $0.6 Target 3: $0.8 Max leverage 5x Always keep stop loss Follow Our Tradingview Account for More Technical Analysis Updates, | Like, Share and Comment Your thoughts
GreenCryptoTrades
AVAXUSDT AVAX Ready to Fly!!

AVAXUSDT AVAX Ready to Fly!! AVAXUSDT has broken out from resistance and found support at previous lows. This setup is looking strong and could mirror ETH’s bullish moves. The major hurdle now is around $27. A breakout above this level could trigger a strong rally with significant upside potential. Always manage your risk and keep a stop loss in place, the sky is the limit once $27 is cleared. AVAXUSDT Currently trading at $23.5 Buy level : Above $23 Stop loss : Below $21 Target 1: $24.5 Target 2: $27 Target 3: $31 Max leverage 5x Always keep stop loss Follow Our Tradingview Account for More Technical Analysis Updates, | Like, Share and Comment Your thoughts
GreenCryptoTrades
Bitcoin Ready for Takeoff - $150K Target Ahead!

BITCOIN is showing impressive strength after successfully retesting its May high and bouncing back with conviction. This level, along with the 50 EMA, is currently acting as a strong support zone. Holding above this area signals that buyers are in control, and this zone now serves as a major support for the ongoing bullish trend. At the moment, BTC is facing minor resistance in the $115K–$116K range. A decisive breakout above this level is likely to trigger strong momentum, opening the doors for a new all-time high. Once this resistance is cleared, our previous projection of $150K comes into play as the next major target. For now, it’s crucial for BITCOIN to hold the current support zone to maintain the bullish structure. As always, traders should manage risk effectively and place stop-losses to protect their capital in case of unexpected volatility. Follow Our Tradingview Account for More Technical Analysis Updates, | Like, Share and Comment Your thoughts
GreenCryptoTrades
SOLUSDT on Fire! Bullish Wedge Fuels INSANE Upside Potential!
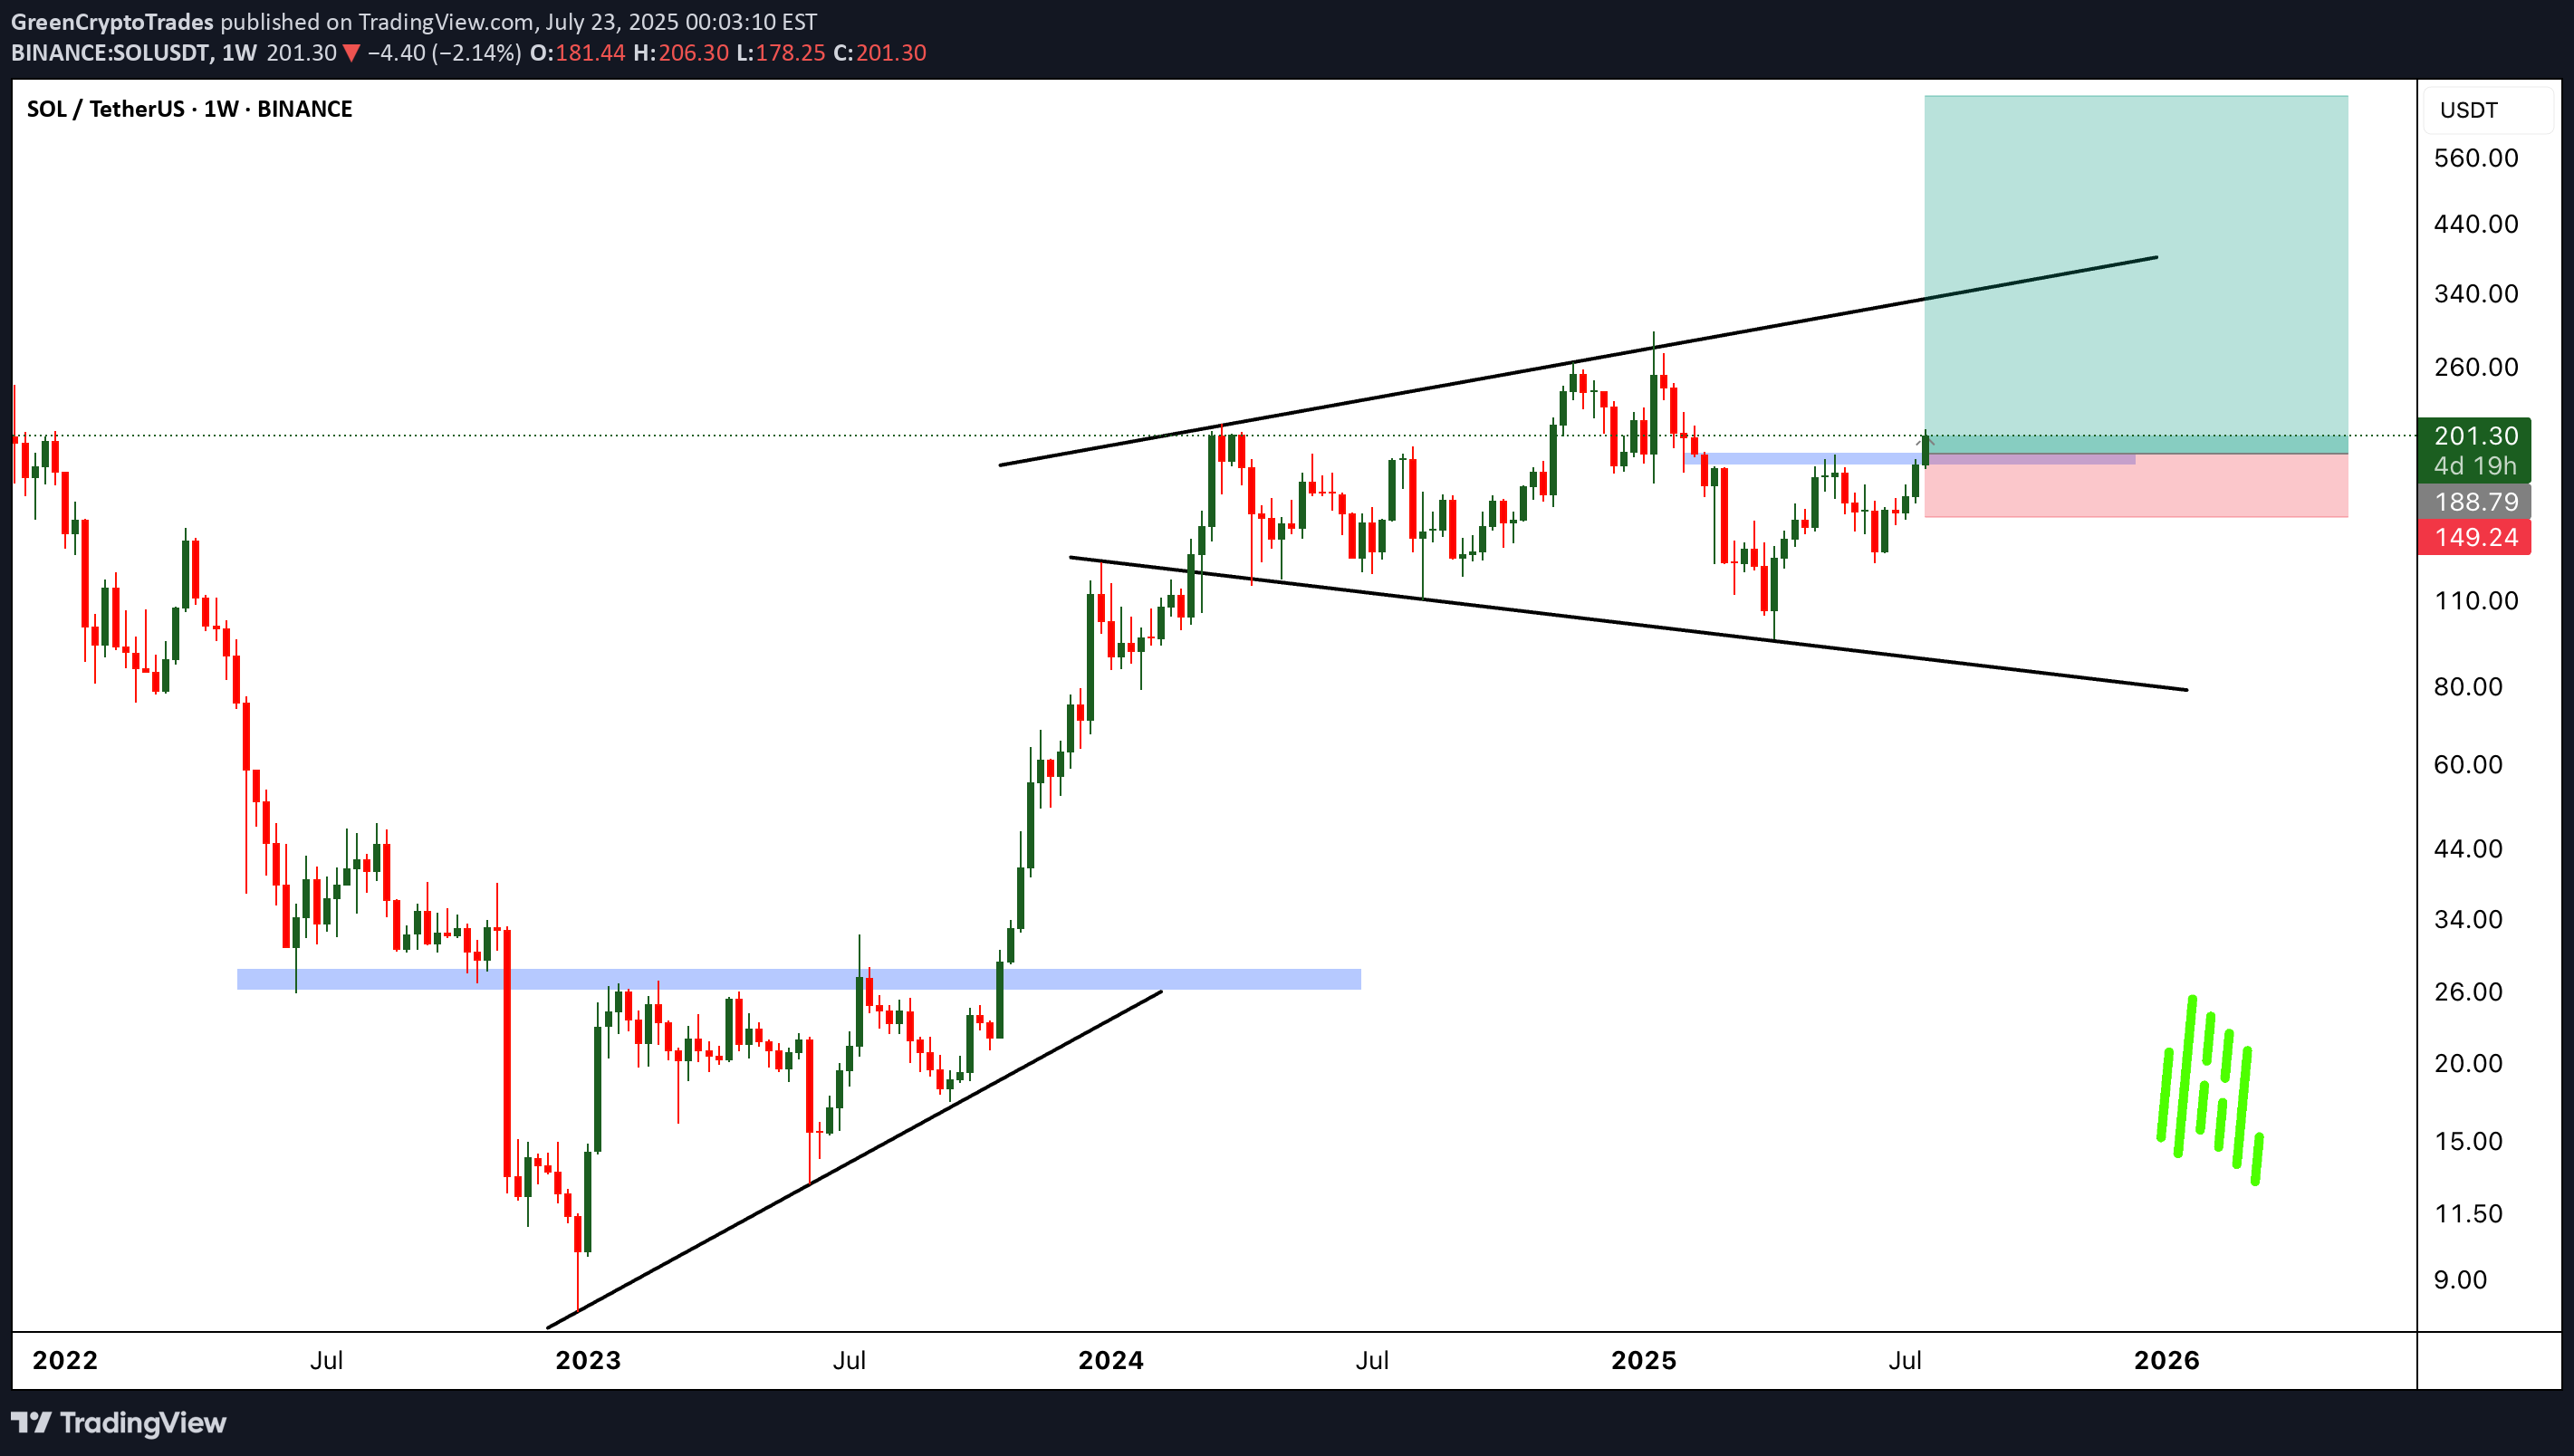
SOLUSDT has been exhibiting strong bullish momentum, currently trading within a broadening wedge pattern. This technical structure often signals increased volatility and the potential for decisive moves in either direction. In the present scenario, the breakout above the psychological $200 resistance level suggests that bulls are firmly in control, fueling hopes of further upside. The continuation of momentum hints at the market preparing for another leg up. The immediate price target lies at $300, where traders may expect some profit-taking and resistance. However, should momentum sustain and buying pressure persist, SOLUSDT has the potential to surge toward the $700 region, aligning with the pattern’s projected price expansion. As always, managing risk is key. Use a well-placed stop loss below the support level to protect your capital. Breakouts can be explosive, but discipline and proper risk management make all the difference. SOLUSDT Currently trading at $201 Buy level : Above $200 Stop loss : Below $150 Target 1: $250 Target 2: $300 Target 3: $500 Target 4: $700 Max leverage 2x Always keep stop loss Follow Our Tradingview Account for More Technical Analysis Updates, | Like, Share and Comment Your thoughts
GreenCryptoTrades
ETHFI - Moving along with the ETH
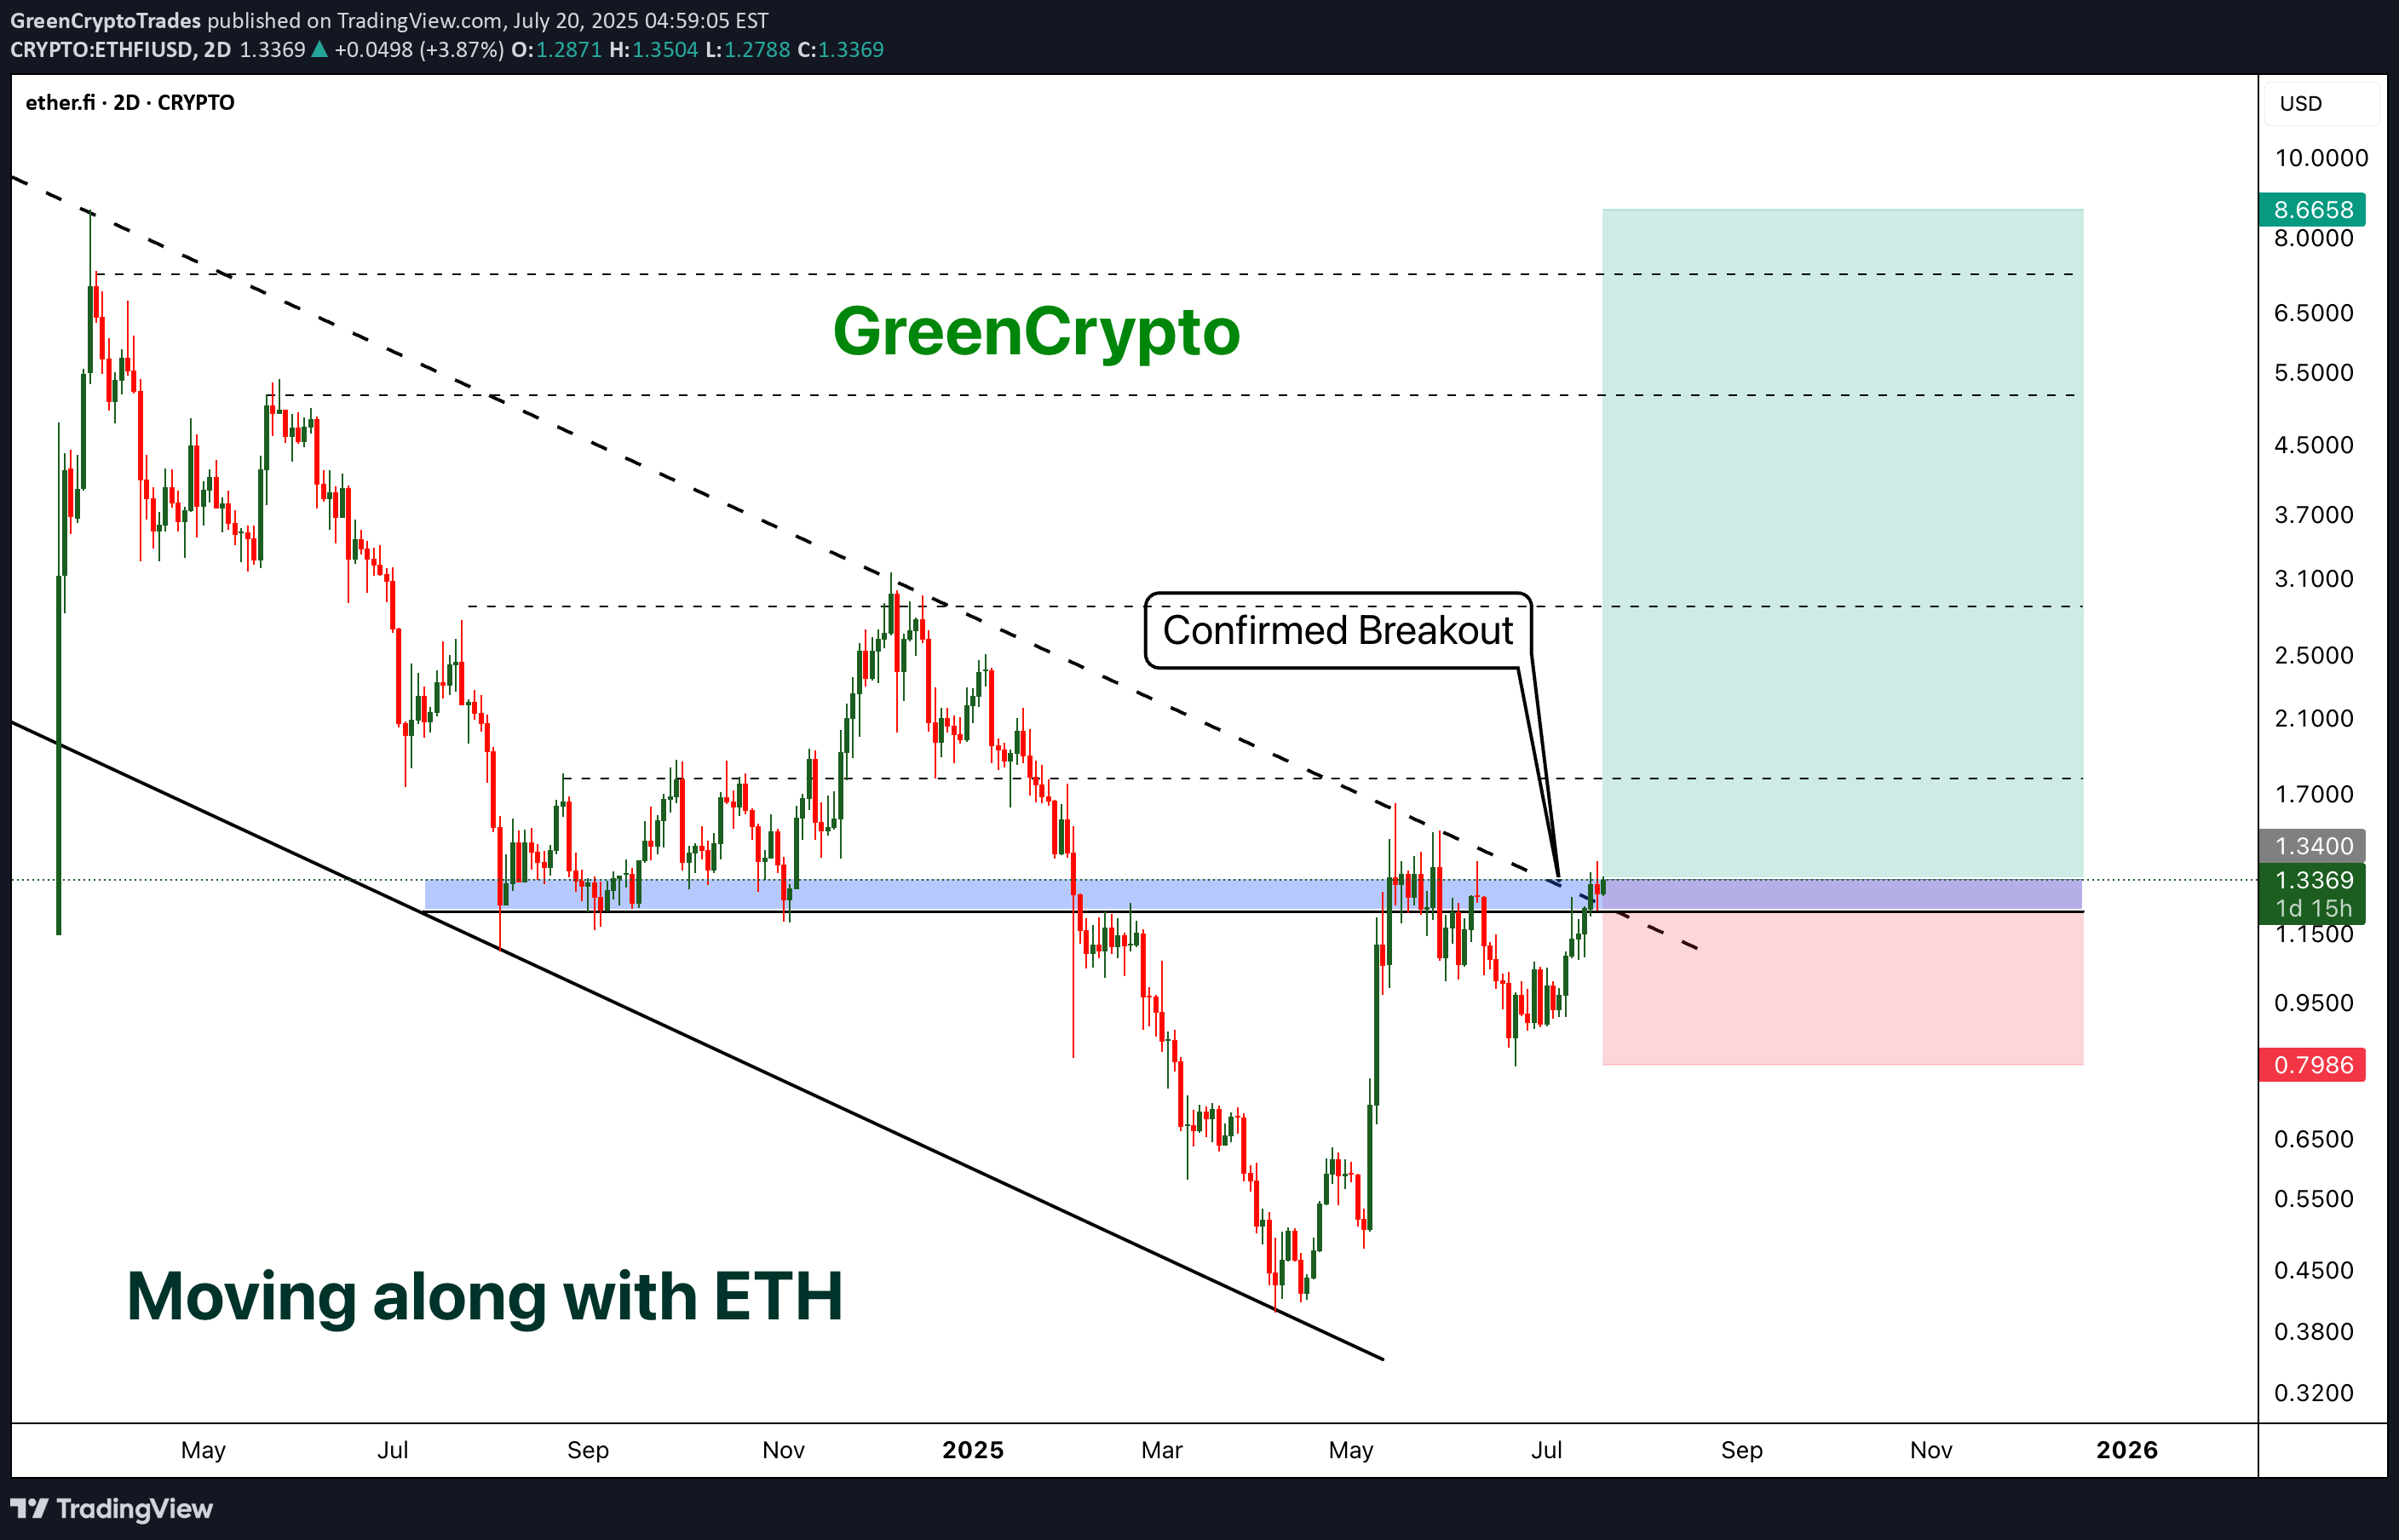
- ETHFI has finally broken out from the descending channel pattern and now price is above the trending resistance line. - We can expect a minor reversal (chances are less ) and parabolic move from here. - I'm expecting at-least 500+% profit from this opportunity Entry Price: 1.3384 Stop Loss: 0.7965 TP1: 1.7657 TP2: 2.5436 TP3: 4.5055 TP4: 5.6136 TP5: 8.5626 Max Leverage 5x. Don't forget to keep stoploss. Support us by Liking and following. Thanks and Cheers! GreenCrypto
Disclaimer
Any content and materials included in Sahmeto's website and official communication channels are a compilation of personal opinions and analyses and are not binding. They do not constitute any recommendation for buying, selling, entering or exiting the stock market and cryptocurrency market. Also, all news and analyses included in the website and channels are merely republished information from official and unofficial domestic and foreign sources, and it is obvious that users of the said content are responsible for following up and ensuring the authenticity and accuracy of the materials. Therefore, while disclaiming responsibility, it is declared that the responsibility for any decision-making, action, and potential profit and loss in the capital market and cryptocurrency market lies with the trader.