
GoldMasterTrades
@t_GoldMasterTrades

What symbols does the trader recommend buying?
Purchase History
پیام های تریدر
Filter
GoldMasterTrades
سقوط آزاد تون کوین (TON/USDT): هدف نهایی کجاست؟
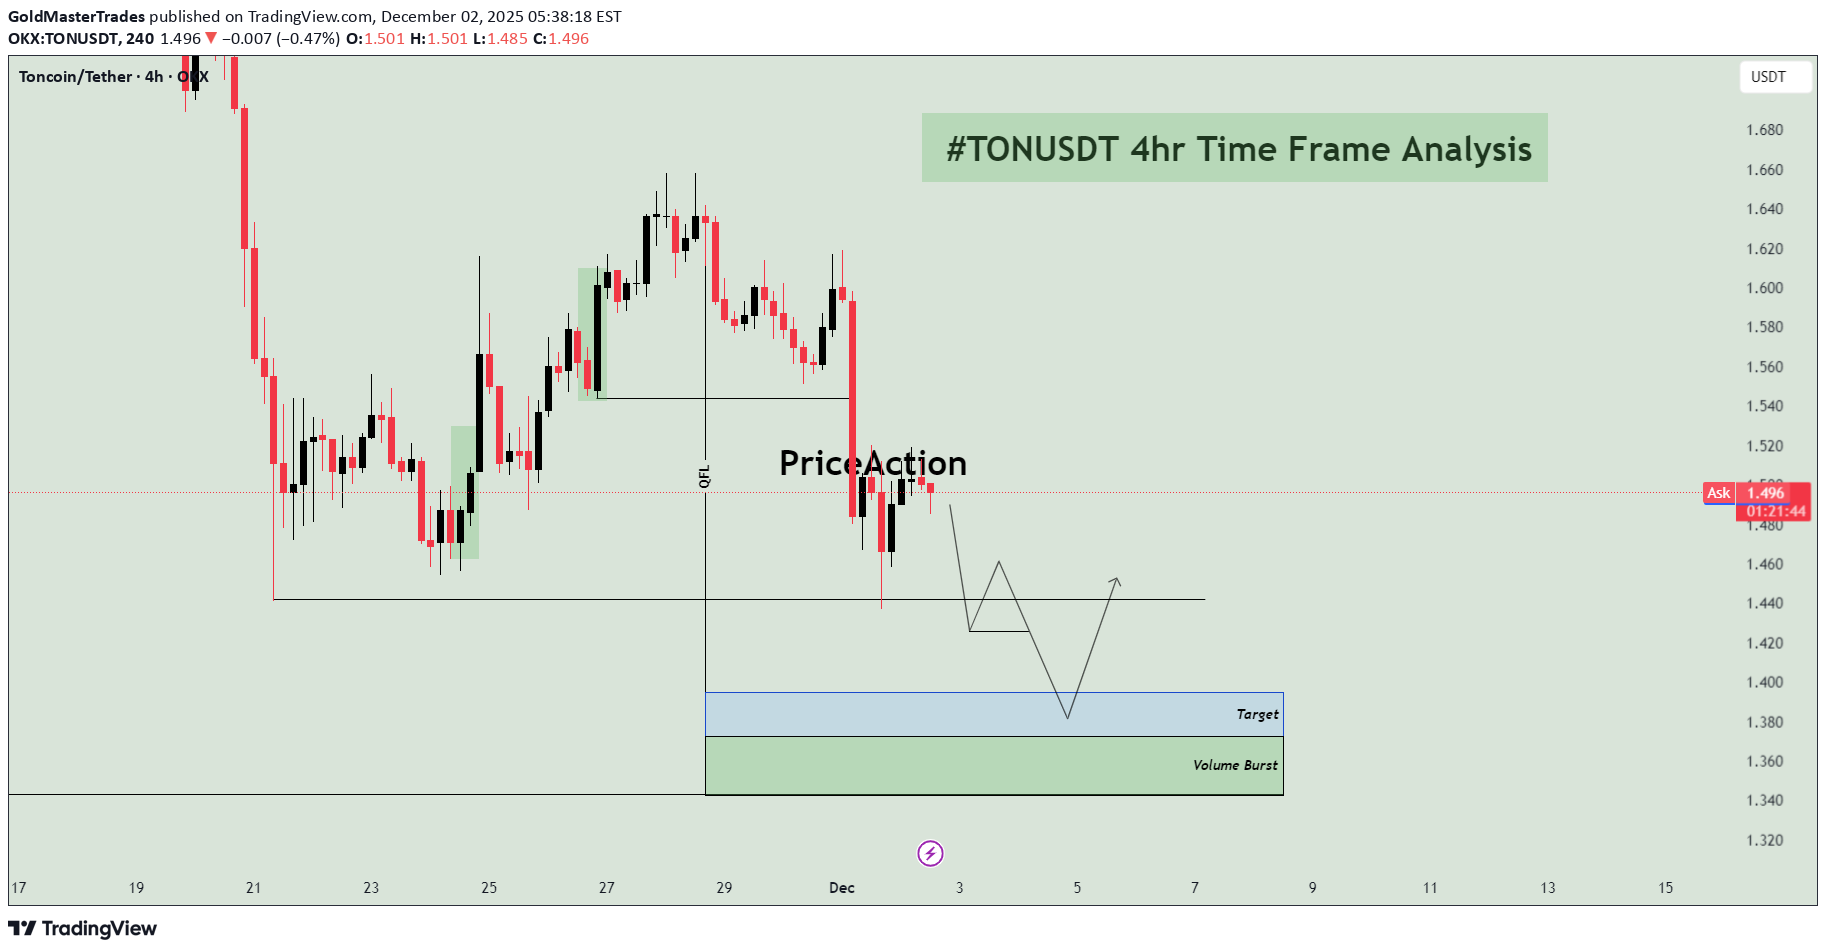
📉 TON/USDT 4H: Anticipating Continuation Short Towards Unmitigated Demand 📝 Market Overview and Structural Context The TON/USDT pair on the 4-hour chart is exhibiting a clear bearish structural shift. After a period of an attempt at a reversal (the recent small rally), the price has decisively broken below the most recent swing low, confirming that sellers are firmly in control. The price is currently consolidating just below a key structural point and is expected to continue its descent toward a significant Demand Zone that was the origin of a previous move higher. The overall hypothesis is a short continuation trade, targeting this fresh demand zone. 🔑 Key Technical Zones and Order Flow The analysis highlights the key structural break and the ultimate target zone: 1. Structural Break and Retest Level: The swing low around 1.550 was recently breached. Current Action: Price is now consolidating around the 1.480 - 1.500 area. The arrows on the chart suggest the expectation of a brief retest of the broken support level (around 1.460) before the bearish momentum continues. 2. Target and Volume Burst Zone (Demand) 🟢/🔵 Zone Location: This is the combined target area, spanning approximately 1.360 to 1.400. Significance: This area is a high-quality Demand Zone, identified as the "Volume Burst" zone. This area was the origin of the last significant bullish momentum (likely a Drop-Base-Rally structure) that launched the previous swing high. It represents the first major unmitigated area where institutional buy orders are expected to be located. The blue box, labeled "Target" (around 1.380 - 1.400), is the most immediate technical objective for the current short trade. The lower green box, "Volume Burst" (around 1.360 - 1.380), marks the distal boundary of the demand zone, providing the ideal area for the final take-profit and potential reversal. 3. Order Flow Level (OFL) Location: The price level around 1.560. Significance: This marks the origin of the last structural high before the move down. The structural breakdown confirms the selling pressure from this point. 📊 Trading Hypothesis: Short Continuation The trade plan anticipates a short continuation after a minor retest: Trade Direction: Short (Sell) Entry Strategy: The chart suggests waiting for a minor rally back toward the broken support level (around 1.460) to capture a more favorable entry price, minimizing risk. The short trade is initiated upon the rejection of this broken level. Stop Loss (S/L): The Stop Loss should be placed safely above the recent swing high that failed to break the prior structure (e.g., above 1.560 or the most recent significant high). Take Profit (T/P) 1: The Target (blue box) around 1.380 - 1.400. Take Profit (T/P) 2: The distal boundary of the Volume Burst zone around 1.360, which represents the maximum expected extension of the current move before a significant bounce occurs. ⚠️ Risk Management and Invalidation The risk lies in price reversing prematurely before reaching the target or failing to reject the retest level. Invalidation: A decisive move and close above the OFL level (1.560) would indicate renewed bullish momentum and invalidate the bearish structural thesis.
GoldMasterTrades
دوج کوین سقوط میکند؟ رمزگشایی ساختار شکسته و فرصت فروش در سطوح کلیدی!
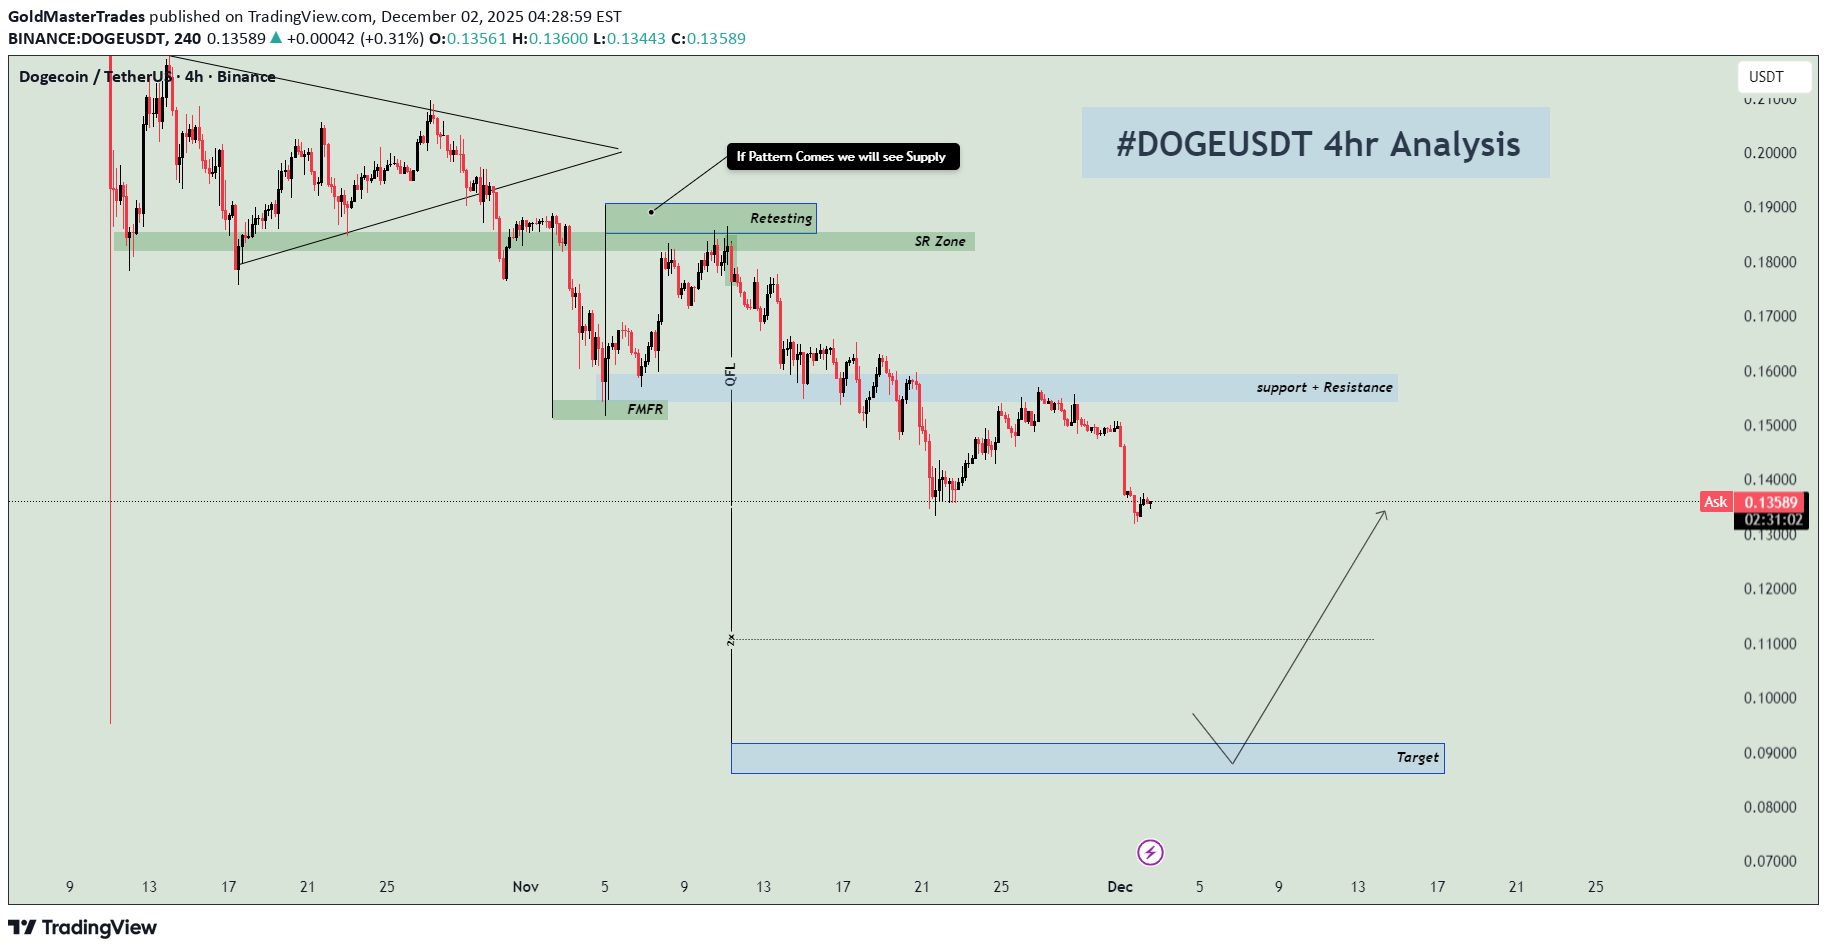
📉 DOGE/USDT 4H: Structural Breakdown and Retest of S/R Flip for Continuation Short 📝 Market Overview and Trend Context The DOGE/USDT pair, as observed on the 4-hour chart, has undergone a significant structural breakdown following an extended period of consolidation (a potential triangle or pennant pattern). The initial support zone, which held price during the consolidation, was decisively broken around the 0.18000 level. The current price action is characterized by a bearish trend, with the most recent move being a retest of the broken support level, which has now flipped to become a critical Resistance Zone (S/R Flip). The overall expectation is for a continuation of the bearish trend towards much lower structural lows. 🔑 Key Technical Zones and Structural Elements The analysis focuses on the structural change and the re-entry point for selling: 1. S/R Flip Zone (The Supply Entry) 🔴 Zone Location: The green shaded area, spanning roughly 0.18000 to 0.18500. Significance: This zone was the last significant area of support before the decisive breakdown. After the break, price rallied back up to this zone in a retesting maneuver. This confirms the S/R Flip, where former support becomes new, strong resistance (a high-quality Supply Zone). Trading Thesis: This is the high-probability area where institutional sell orders are expected to enter the market, initiating the next leg down of the bearish trend. 2. False Move Failure Retest (FMFR) Marking: An area labeled FMFR (False Move Failure Retest) appears near the retesting area. This highlights a specific pattern often used in Smart Money Concepts (SMC) where the initial move into a zone is often complex or fails before the true move begins, adding confluence to the resistance/supply thesis. 3. Target Zone (Accumulation Zone) 🔵 Zone Location: The blue shaded box, spanning approximately 0.08800 to 0.09100. Significance: This is the primary long-term Target for the short trade. It represents the next major structural low or a historical area of strong accumulation/demand, which is likely to attract the price once the supply pressure is confirmed. 📊 Trading Hypothesis: Shorting the Retest The trade plan is contingent on confirming the bearish pattern at the S/R flip zone: Trade Direction: Short (Sell). Entry Strategy : The condition for entry is strictly: "If Pattern Comes we will see Supply". This means traders must wait for a clear bearish pattern (e.g., bearish engulfing candle, pin bar, or an indication of supply overwhelming demand) to form within the S/R Flip Zone on the 4H chart or a lower confirmation timeframe (e.g., 1H). Stop Loss (S/L) : The Stop Loss should be placed securely above the highest wick of the S/R Flip Zone retest (e.g., above 0.19000), protecting against a false breakdown and a move back into the prior consolidation range. Take Profit (T/P): The primary and most aggressive target is the Target Zone around 0.09000. Given the size of the move, interim profit targets may be placed at psychological levels (e.g., 0.12000 or 0.10000). ⚠️ Risk Management and Invalidation The critical factor is adherence to the "If Pattern Comes" rule. Entering before a clear rejection of the S/R Flip Zone is premature. A decisive close above the S/R Flip Zone (e.g., above 0.19000) would invalidate this bearish setup, potentially signaling a large deviation move or a false structural break.
GoldMasterTrades
تحلیل بیت کوین ۳۰ دقیقهای: آیا بیتکوین قبل از سقوط بزرگ، منطقه برگشت را دوباره تست میکند؟
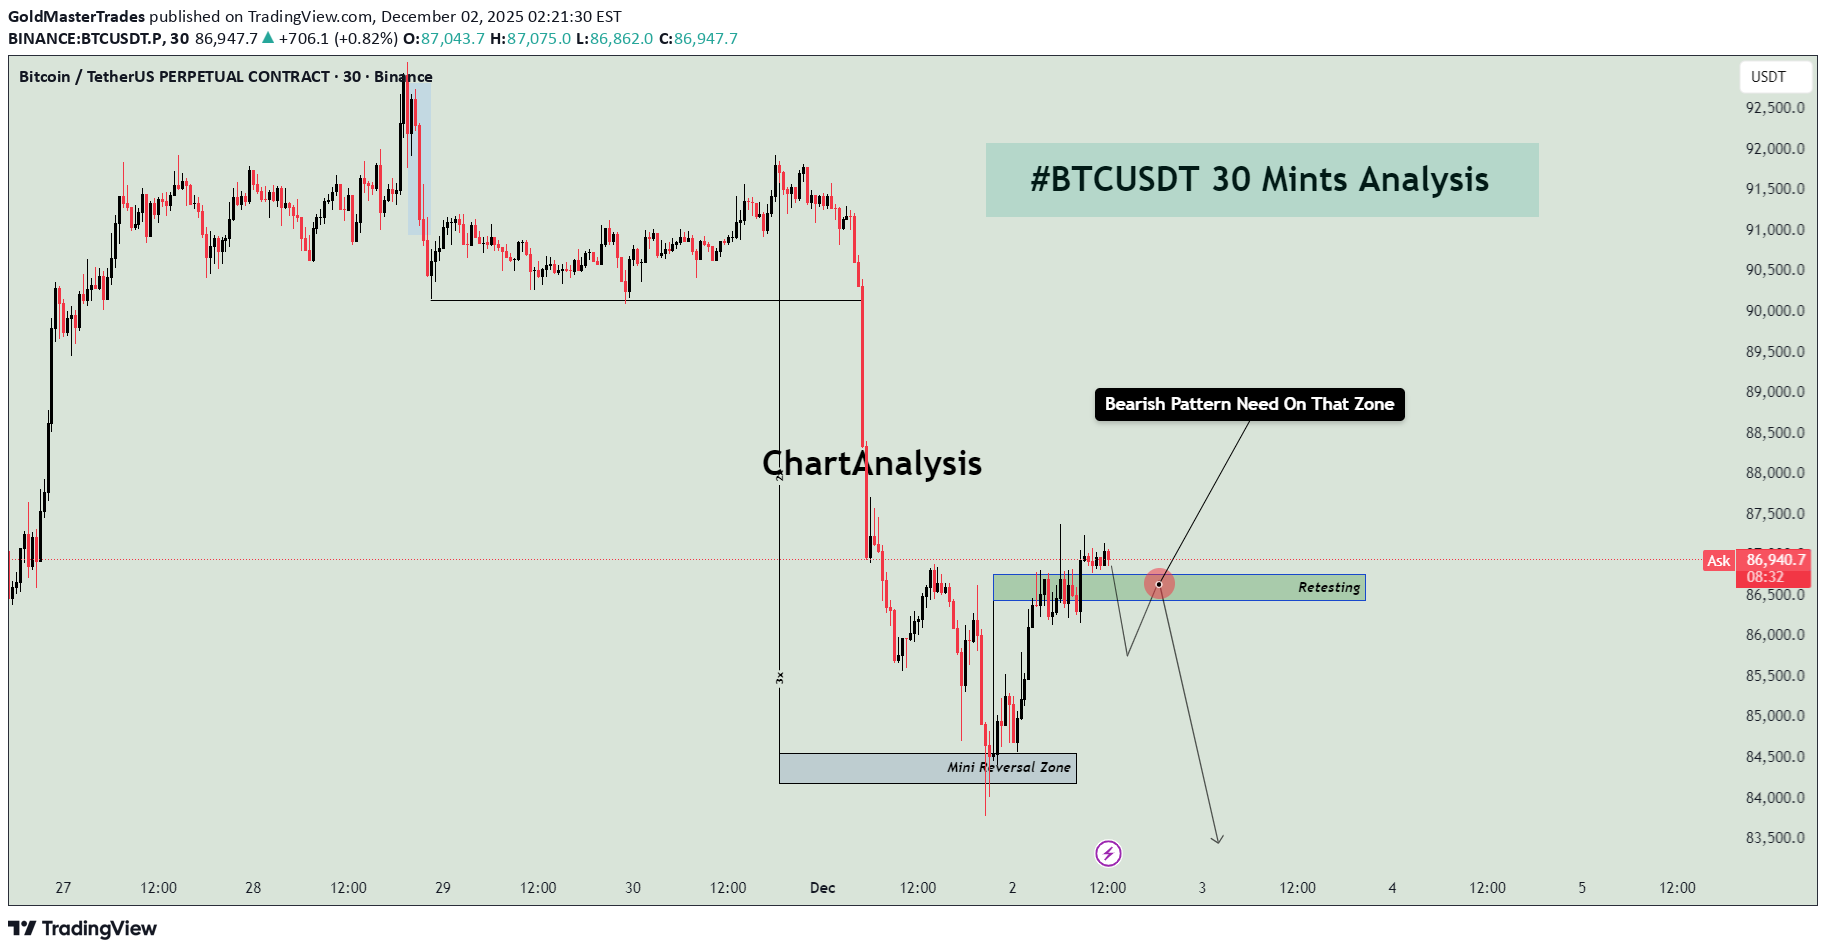
📊 BTCUSDT 30-Minute Technical Analysis – Reversal Zone Under Pressure This 30-minute BTCUSDT chart highlights an important bearish setup forming after a sharp downside move. Bitcoin is currently consolidating near a Reversal Zone, suggesting that price may attempt a retest before continuing lower. 🔻 Market Structure Overview Bitcoin recently experienced: A strong impulsive sell-off A brief consolidation phase A minor recovery back into a previous support now acting as resistance This structure indicates that sellers are still in control. 🟥 Reversal Zone (Major Resistance Area) The highlighted red zone is the primary bearish reaction area. Why this zone matters: Price broke below this level with strong momentum It is now acting as a potential supply zone A bearish candlestick pattern in this area would confirm sellers stepping in Your chart clearly notes: “Bearish Pattern Need On That Zone.” A rejection here is the most important bearish confirmation. 🟦 Mini Reversal Zone (Previous Demand Area) Below current price sits a smaller demand zone. This zone previously showed: Buyer reactions Short-term reversals Support in the recent downtrend If price breaks below this mini zone, BTCUSDT may aim for deeper liquidity levels, confirming bearish continuation. 📉 Expected Price Behavior Based on the projected path drawn on your chart: Price will retest the Reversal Zone A bearish engulfing, pin bar, or rejection wick may form Price may drop aggressively after confirmation Final target is a deeper zone around the previous swing lows The downward arrow illustrates the expected continuation if bulls fail to defend nearby support. ⭐ Key Takeaways Bitcoin remains in a bearish structure on the 30M timeframe A strong bearish pattern in the Reversal Zone is required for confirmation Rejection from this resistance may trigger another downside wave Break and hold above the zone would invalidate the short-term bearish outlook 🧠 Short Summary for Minds Bitcoin is approaching a key Reversal Zone on the 30-minute chart. If a bearish pattern forms here, BTCUSDT may continue dropping toward lower support levels. Sellers remain strong unless bulls break above the resistance zone.
GoldMasterTrades
Today's GOLD Analysis : MMC Structural Analysis + Reversal Zone

This analysis is rooted in MMC – Mirror Market Concepts, a framework designed to track institutional behavior through liquidity patterns, QFL (Quick Flip Levels), trendline shifts, and volume bursts. The current 4H Gold chart demonstrates a smart money footprint that provides actionable insight for intraday and swing traders. 🔍 Detailed Technical Breakdown: 🟦 1. Previous Supply Completed | Demand Zone Reversal At the lower end of the chart, price entered a key blue zone around $3,250–$3,280, previously a supply zone now flipped into demand. This zone represents where institutional buyers absorbed liquidity, forming the base for a bullish impulse. The strong reaction from this zone, marked by long-wick candles and immediate reversal, indicates exhaustion of selling pressure. This reversal is confirmed by a QFL structure, meaning price created a fast liquidity sweep before flipping direction. MMC recognizes this as a high-probability area of reversal, a point where smart money typically enters. 📈 2. Trendline Breakout & Structure Shift A descending trendline, representing bearish market control, was decisively broken to the upside. This shift marks: End of the corrective phase Beginning of a bullish structural change Buyers now control the short-term narrative The breakout was not only clean but also supported by a volume burst, which is a classic MMC indicator that institutional traders are entering the market. 🔶 3. Volume Burst Confirmation Volume behavior plays a critical role in MMC. We see a clear volume spike post-breakout. This suggests that: The breakout is not false Buyers were aggressively positioned A sustainable move is in development This supports the validity of the trendline breakout and confirms the idea that price is ready to test higher liquidity zones. 🟢 4. Current Price Structure: Bullish Channel After the breakout, the market formed a bullish channel, where price is steadily climbing while respecting parallel boundaries. The channel support line acts as a dynamic entry point for retracement buys MMC strategy uses this structure to identify scaling entries at channel lows or after successful pullbacks into key reversal zones 🟩 5. Mini Reversal Area (Short-Term Resistance Zone) Price is currently testing a minor supply zone or what MMC defines as a "Mini Reversal Area". This is a reaction zone before continuing toward the major target above. There are two possible reactions: Short-term rejection, leading to a pullback into the lower channel support zone Minor consolidation, forming a base for a breakthrough toward major resistance 🟦 6. Major & Minor Supply Zones Above Marked in light blue and green, these zones represent areas where previous selling volume and distribution occurred. The major supply zone (approx. $3,440–$3,470) is the next institutional target The minor zone sits between $3,400–$3,420 and may cause initial resistance or a base for another impulse These levels are prime for partial profit-taking or scouting short-term reversal trades. 📊 Trade Management Insights: 🛒 Buy Opportunities (Long Bias): On pullback into channel support near $3,340–$3,350 On bullish confirmation from mini reversal area On break and retest above minor resistance at $3,420 🛑 Stop-Loss Suggestion: Below the channel support or below the blue demand zone (approx. $3,245) 🎯 Profit Targets: TP1: $3,400 (first resistance) TP2: $3,420 (minor supply) TP3: $3,450–$3,470 (major institutional level) 🧠 Mirror Market Concepts (MMC) Highlights: QFL Structures = Institutional Reversal Points Volume Burst = Confirmation of Breakout Validity Trendline Breakout = Momentum Shift Channel Structure = Controlled Climb Pattern Mini Reversal Zone = Key Decision Point Before Continuation 🧭 TradingView Summary for Minds Community: This GOLD chart beautifully aligns with the MMC method — spotting smart money involvement early and aligning with their flow. After confirming structural reversal via trendline and QFL, the setup now looks poised for continuation toward the $3,440–$3,470 zone, making it a perfect chart to watch for buy-the-dip setups.
GoldMasterTrades
XRPUSDT Analysis (MMC) : Decision Point + Next Move Loading

In this 4-hour chart of XRP/USDT, we're observing a critical structure forming under the Mirror Market Concepts (MMC) framework. Price action is compressing near an important descending trendline, suggesting that a breakout or breakdown is imminent. Let’s break it down zone by zone: 🔍 Key Zones & Price Structure: Important Zone (SR Interchange Zone – $2.95 - $3.05) This is a major supply-to-demand flip zone. It has served as both resistance and support in the past and is now acting as a potential interchange level. The price is hovering just below this area, retesting it after a significant bearish structure. BR Supply Zone (Breakdown Retest Supply – $2.93 - $2.98) After price broke down from this zone, it created a base for a retest. This level has since acted as a cap to further upside movement. It also coincides with the descending trendline, adding confluence to its strength as resistance. Next Reversal Zone ($2.75 - $2.85) In case the price fails to reclaim the Important Zone, we could see a bearish continuation move into the next zone of interest. This is a likely reversal or reaction area based on previous demand imprints and price imbalance. SR Flip Watch If price breaks above the trendline and sustains above the SR Interchange Zone, this could trigger a potential bullish breakout toward the $3.20+ region (labeled as target “1”). This move would be backed by trapped sellers and liquidity above the descending structure. 📈 Potential Scenarios: ✅ Bullish Case: Break and close above the descending trendline. Successful retest of the Important Zone as demand. Push toward $3.20 - $3.30 where the next supply awaits (target 1). ❌ Bearish Case: Rejection at the Important Zone and trendline resistance. Breakdown below $2.90 confirms bearish pressure. Possible liquidity sweep and reaction from the Next Reversal Zone ($2.75-$2.85). If this zone fails to hold, continuation toward lower zones becomes likely. 🧠 MMC Perspective: From a Mirror Market Concepts (MMC) standpoint, the market is currently at a reflection point where a decision between bulls and bears is about to play out. The clean diagonal structure plus clear horizontal liquidity pockets makes this setup ideal for anticipating manipulation traps and smart money moves.
GoldMasterTrades
DOGEUSDT Analysis : Trendline Decision & Dual Directional Point

📌 Market Context & Current Setup: DOGEUSDT has been trading within a well-defined descending channel, respecting a strong trendline resistance, which has acted as a bearish ceiling for several sessions. The price action has been heavily influenced by supply zones formed after sharp impulsive drops, creating multiple QFL (Quick Flip Levels) — key to spotting structural bottoms and high-probability reversal zones. Currently, the price is hovering near a critical decision point, where two key scenarios may play out: A breakout and bullish reversal toward major resistance A dip into a deep demand zone for final accumulation before reversal Your plan reflects MMC (Market-Mind-Confirmation) methodology, preparing for either scenario with clear levels, logic, and psychology in place. 📐 Technical Breakdown: 🔻 1. Trendline Confirmation (Bearish Control): The price has respected the downtrend line multiple times, confirming strong bearish momentum. No candle body has closed decisively above it, showing sellers still have control. However, price is now consolidating near this line, indicating a potential weakening of selling pressure — a classic sign of upcoming trend exhaustion. 🟩 2. Support Zones – Structural Layers: 📍 Minor Zone (S/R Flip – ~$0.215–0.220): This zone is a previous support turned resistance. It’s the first checkpoint the price needs to reclaim to confirm a breakout. A successful flip from resistance back to support would add strong bullish confidence. 🟩 Reversal Zone (~$0.185–0.190): Marked on your chart as a "Reversal Area" — likely derived from QFL methodology. Price has historically bounced from this area, indicating buyers are willing to step in aggressively. This zone aligns with smart money demand accumulation and could serve as a final liquidity sweep zone before a major reversal. 📍 Major Resistance Zone (~$0.250–0.260): The next major objective once a trendline break is confirmed. Also aligns with previous highs and volume nodes — a solid target for bullish trades. 🔄 Scenario-Based Strategy: 📈 Scenario 1 – Breakout Toward Major Resistance: Price breaks above the descending trendline and reclaims the minor S/R zone. This would confirm a bullish structure shift, validating that sellers are losing strength. After reclaiming ~$0.215, the path toward $0.240–0.260 opens up. Retests or flag breakouts within this range can be re-entry points for trend traders. 📉 Scenario 2 – Deeper Retest and Accumulation: If the price fails to break out and dips further, the reversal demand area (~$0.185) becomes critical. This is where buying pressure is expected to return, and as labeled in your chart: 👉 “If it goes down, we will double the supply” This suggests an averaging-down or pyramiding strategy based on strong structural confidence. This technique is valid only when the area is backed by solid confluence (trend exhaustion, demand, and past bounces). 🧠 MMC Strategy (Market – Mind – Confirmation): Market: Bearish short-term trend, but price is approaching oversold territory near structural demand. Mind: You’re prepared for both outcomes – breakout or dip. Emotion is out of the plan. Confirmation: You wait for signs — break and retest of trendline, bullish engulfing candles, or wick rejections from demand. This mental clarity helps maintain trading discipline and keeps emotional bias out of decision-making. ⚙️ Execution Plan: ComponentScenario 1 (Breakout)Scenario 2 (Deep Buy Zone) Entry SignalBreak & close above trendline + minor SR reclaimBullish reversal candle within demand zone Stop LossBelow trendline + S/R flip (~0.210)Below demand zone (~0.182) Target 1$0.235$0.235 Target 2$0.255–$0.260$0.255–$0.260 Risk LevelMediumHigher R:R potential Strategy NotesAggressive on confirmation onlyAdd to position on wick traps 🧠 Trader Psychology Tips: Be patient — confirmation beats prediction. Set alerts at key levels to avoid emotional entries. Scaling into trades based on zone reactions builds flexibility and control. "Double the supply" approach must be paired with strict invalidation levels. ✅ Summary: DOGE is trading within a descending wedge. Key decision zones are marked clearly (trendline, S/R flip, reversal demand). Breakout could lead to a quick 15–25% upside. Reversal zone offers great R:R with accumulation opportunity. Strategy is well-aligned with disciplined execution and trader psychology.
GoldMasterTrades
TONUSDT Bullish Structure Continuation – Minor Pullback Leg Up

🧾 1. Overview of the Chart Setup: The current TONUSDT (Toncoin/USDT) 2-hour chart exhibits a strong bullish market structure, characterized by a clear sequence of higher highs and higher lows. This confirms bullish momentum and suggests that the market is in a well-established uptrend. The key highlight here is the "Blue Ray – Trend Continuation Pattern", which signals sustained bullish pressure following a clean breakout. This breakout was preceded by a consolidation phase, indicating accumulation by smart money before the expansion move. 🔍 2. Technical Structure and Pattern Breakdown: 🔵 Blue Ray – Trend Continuation Pattern: This diagonal support trendline captured the initial breakout after the market bottomed near July 29–30. Price respected this ascending line multiple times before accelerating, confirming bullish control. Once the price broke above the previous swing high, it completed the pattern and triggered a momentum-driven rally. 🔲 Structural Zones – Major and Minor: Minor Support Zone (~3.50 USDT): Currently acting as short-term demand. Price is showing early signs of rejection here, suggesting bulls may reload for a second impulsive move. If this zone holds, we expect a new higher high to form, potentially targeting 3.80–4.00+ USDT. Major Support Zone (~3.20–3.25 USDT): Acts as long-term bullish defense. In case of deeper retracement or shakeout, this is the key level to watch for possible trend continuation and re-entry. 📈 3. Structural Analysis and Price Projection: The projected path on the chart shows a classic price action structure: Impulse Correction (toward minor support) Next Impulse (break of recent high) Higher low (continuation within trend channel) Potential final push toward the 3.90–4.00 range This type of Elliott Wave-inspired behavior suggests we're in wave 3 or 5 of a bullish sequence, with minor dips offering low-risk long setups. 📊 4. Candlestick & Market Behavior: Recent candles show long lower wicks, suggesting buyers are stepping in during dips. Bearish candles are relatively smaller and followed by immediate bullish response. This indicates buy-the-dip sentiment, common in a trending market. 🔄 5. Trading Plan & Scenarios: ✅ Bullish Continuation (Base Case): Wait for a clear bullish engulfing or price bounce at the minor support zone (~3.50 USDT). Enter with confirmation: bullish candle close, volume spike, or trendline reaction. Targets: TP1: 3.80 USDT TP2: 4.00–4.10 USDT Stop Loss: Below 3.45 (or structure-based trailing stop) ⚠️ Bearish Case / Deeper Pullback: If 3.50 fails, look for signs of accumulation around the major support (~3.20–3.25). This zone can serve as the ultimate defense for trend continuation and provide a second long opportunity with better R:R. 🧠 6. Mindset for Traders: Don’t chase: Let price come to your level, and focus on confirmation. Trade with the trend: Structure supports bullish movement — trade in the direction of strength. Use proper risk management: Define SL and TP before entering. Partial profits at key resistance zones are a smart strategy. Avoid overtrading : Wait for structural retests or confirmation candles to stay on the right side of the market.
GoldMasterTrades
GOLD Analysis – Bullish Recovery Setup After Trendline Breakout

⚙️ Technical Structure Overview This 4-hour chart of Gold (XAUUSD) illustrates a classic reversal setup developing after a significant correction. Price previously faced strong selling pressure from the 3,470+ zone and declined sharply. However, the recent price action suggests a shift in control from sellers to buyers, signaling a likely medium-term trend reversal or a bullish wave formation. The key to this setup lies in three confluences: Completion of a previous supply zone, which no longer holds influence. Aggressive buyer activity from a major support zone. A clean break above the descending trendline, which is a common signal that bearish momentum is losing strength. 🔑 Key Levels & Concepts Explained 🟢 1. Major Support Zone (3,260–3,280) This zone has been tested multiple times and each time, buyers stepped in and prevented further downside. The most recent rejection from this area shows long wicks and bullish engulfing candles, indicating accumulation by institutional players. This is the foundational support that has held the entire corrective structure. 📉 2. Trendline Breakout The descending trendline connecting swing highs has now been broken to the upside. This is a critical technical signal, especially on the 4H timeframe, as it suggests a potential trend reversal or at least a deep retracement in the opposite direction. Trendline breakouts typically result in a retest of the trendline or a nearby support-turned-resistance zone (as is the case here with the Mini SR level). It also implies that supply is weakening, and buyers are ready to push. 🧱 3. Mini Support/Resistance Interchange (~3,300–3,320) This zone now plays the role of an interchange level—a previous minor resistance that could act as a support after the breakout. This level is crucial for intraday and swing traders because it can offer a low-risk long entry if price retests and confirms it with bullish momentum. The chart projection suggests a bounce off this mini S/R, followed by successive higher highs and higher lows, forming a new bullish structure. 📈 Forecast Path & Trade Scenario ✅ Bullish Path (Preferred MMC Scenario) Stage 1: Price retests the 3,300–3,320 zone (Mini S/R). Stage 2: Buyers step in, leading to a bullish continuation. Stage 3: Price targets the Minor Resistance (~3,440). Stage 4: If momentum is sustained, it aims for Major Resistance (~3,470–3,480), completing a clean reversal formation. This path reflects perfect bullish market structure—a breakout, followed by a retest and rally. ❌ Bearish Invalidation If the price closes strongly below 3,260, the structure would be invalidated. This would suggest that the support zone failed, possibly triggering deeper downside toward 3,220–3,200. 🧠 MMC Trader Mindset & Risk Considerations Don’t Chase: Wait for a confirmed retest of the Mini S/R zone. Let the market come to your entry. Entry Confirmation: Use candlestick signals like bullish engulfing, pin bars, or inside bars near the Mini S/R. Volume Consideration: Volume should ideally rise on breakout legs and decline on pullbacks—this confirms healthy bullish structure. Risk-Reward: With a stop below 3,260 and targets toward 3,470, the RR ratio favors long entries, especially after confirmation. 🔁 Summary Plan for Execution Entry Zone: 3,300–3,320 (after bullish confirmation) Stop Loss: Below 3,260 (structure break) Take Profit 1: 3,440 Take Profit 2: 3,470–3,480 Risk-to-Reward: 1:2+ if planned carefully
GoldMasterTrades
BTCUSD – Bullish Recovery Setup Forming Near Trendline Support

🧠 Market Structure & Technical Breakdown The BTCUSD 4H chart showcases a well-formed descending triangle or falling wedge structure with clearly respected major and minor descending trendlines. Currently, price action is testing a dynamic support zone, highlighted in green, which has been a strong reaction area in the past. This area aligns with a bullish accumulation zone, from which buyers have previously stepped in to initiate impulsive moves. Given the confluence of diagonal support and horizontal price reactions, we may be on the verge of a bullish breakout opportunity. 📍 Key Zones & Trendlines ✅ Green Support Channel (Demand Zone): Acting as a key pivot for multiple recent rejections, this area (~114,000–113,000) is now being revisited again, offering potential buy interest. 📉 Minor Trendline: A short-term descending resistance around 120,000—likely the first barrier in case of a bounce. 📉 Major Trendline: A more extended dynamic resistance line connecting swing highs, currently intersecting near the 124,000 region. 🔄 Potential Price Scenarios Primary Bullish Setup (MMC Plan): Price bounces off the green demand zone. Breaks above the minor trendline (~120K). Pullback retest to confirm breakout. Continuation toward the major breakout level (~124K and beyond). Invalidation / Bearish Case: A clean breakdown below 113,000 with strong bearish momentum would negate this setup, likely targeting the psychological support near 110,000. 🧠 MMC Mindset: Trade with Patience & Confluence This is a classic accumulation-to-breakout scenario. Smart traders wait for confirmation—especially as BTC often exhibits false breakdowns before a major move. Monitor candle behavior, volume, and reaction to the minor trendline. Let the market show signs of strength (like bullish engulfing, pin bars, or a breakout-retest) before committing to the upside. Avoid FOMO; the key is discipline and precision entry at structural break points. ✅ Trade Plan Summary: Watch zone: 113,000–114,500 for bullish price action Breakout level: Minor trendline (~120,000) Target zone: 123,500–124,000 (Major resistance) Stop-loss idea: Below 112,800 (Invalidation of structure)
GoldMasterTrades
TONUSDT Analysis : Bullish Setup Breakout – Advanced MMC Analyze

“Blue Ray Pattern Breakout Confirms Bullish Trend Continuation” The 30-minute chart of TONUSDT highlights a clean and structured bullish setup based on the MMC (Mirror Market Concepts) methodology. The price action exhibits disciplined market behavior, respecting structural levels, breakout dynamics, and volume-based reactions. 🔷 1. Blue Ray Pattern – Trend Continuation Phase This chart begins with the formation of the Blue Ray, a visual representation of trend consolidation and energy buildup. This pattern functions as a trend continuation flag or wedge. Prices compressed within a narrowing range, forming higher lows and lower highs, signaling accumulation under buyer control. Once the pattern matured, we witnessed a decisive bullish breakout, where the price closed above resistance with conviction. This event marked a clear market intention shift and established a new impulsive leg. 🔍 2. Breakout Confirmation and Follow-Through Post-breakout, TONUSDT experienced: High-volume candles with elongated bodies, indicating increased buyer participation. Immediate upside momentum that pushed the asset into a short-term overextended condition – often a healthy sign of strength when followed by a controlled pullback. The breakout wasn’t just a false move – it was sustained, and the price held above the broken structure, proving that supply was absorbed and buyers were dominant. 🔑 3. Demand Zones (Minor and Major) Two key MMC demand zones are highlighted: 🔹 Minor Demand Zone (~3.43–3.45): This is the most immediate support and current price is hovering just above it. It's the first zone of interest for buyers and may serve as a re-entry or scaling point. 🔸 Major Demand Zone (~3.34–3.36): In case of deeper retracement or volatility, this zone is expected to act as a strong bounce region based on past structure and MMC’s reversal logic. Price memory here suggests accumulation or reactive interest. 📐 4. Structure, Momentum, and Higher Timeframe Confluence TONUSDT is in a confirmed uptrend, forming a clear sequence of higher highs and higher lows. The structure supports a bullish flag breakout with minimal overhead resistance. The projected path drawn on the chart illustrates a stair-stepping price pattern with continuation toward 3.60–3.70, if current levels hold. 📊 5. MMC Strategy Bias – Bullish Using the MMC lens: Blue Ray breakout confirms continuation Volume absorption succeeded at the base of the flag No signs of dominant supply entering post-breakout Wave projection supports ongoing momentum Structure favors buying dips, not shorting spikes 💡 Trader’s Takeaway: TONUSDT is providing a textbook bullish opportunity under the MMC framework. As long as price stays above the Minor Demand Zone, continuation upward toward 3.60 and beyond remains in play. If price dips to the Major Zone, watch for strong buyer reactions for fresh entries. Ideal for MMC traders and technical analysts looking to align with structured, logic-based entries and exits. This setup reflects market strength, technical clarity, and volume confirmation – a powerful trio for continuation plays.
Disclaimer
Any content and materials included in Sahmeto's website and official communication channels are a compilation of personal opinions and analyses and are not binding. They do not constitute any recommendation for buying, selling, entering or exiting the stock market and cryptocurrency market. Also, all news and analyses included in the website and channels are merely republished information from official and unofficial domestic and foreign sources, and it is obvious that users of the said content are responsible for following up and ensuring the authenticity and accuracy of the materials. Therefore, while disclaiming responsibility, it is declared that the responsibility for any decision-making, action, and potential profit and loss in the capital market and cryptocurrency market lies with the trader.