Technical analysis by GoldMasterTrades about Symbol BTC: Sell recommendation (12/2/2025)

GoldMasterTrades
تحلیل بیت کوین ۳۰ دقیقهای: آیا بیتکوین قبل از سقوط بزرگ، منطقه برگشت را دوباره تست میکند؟
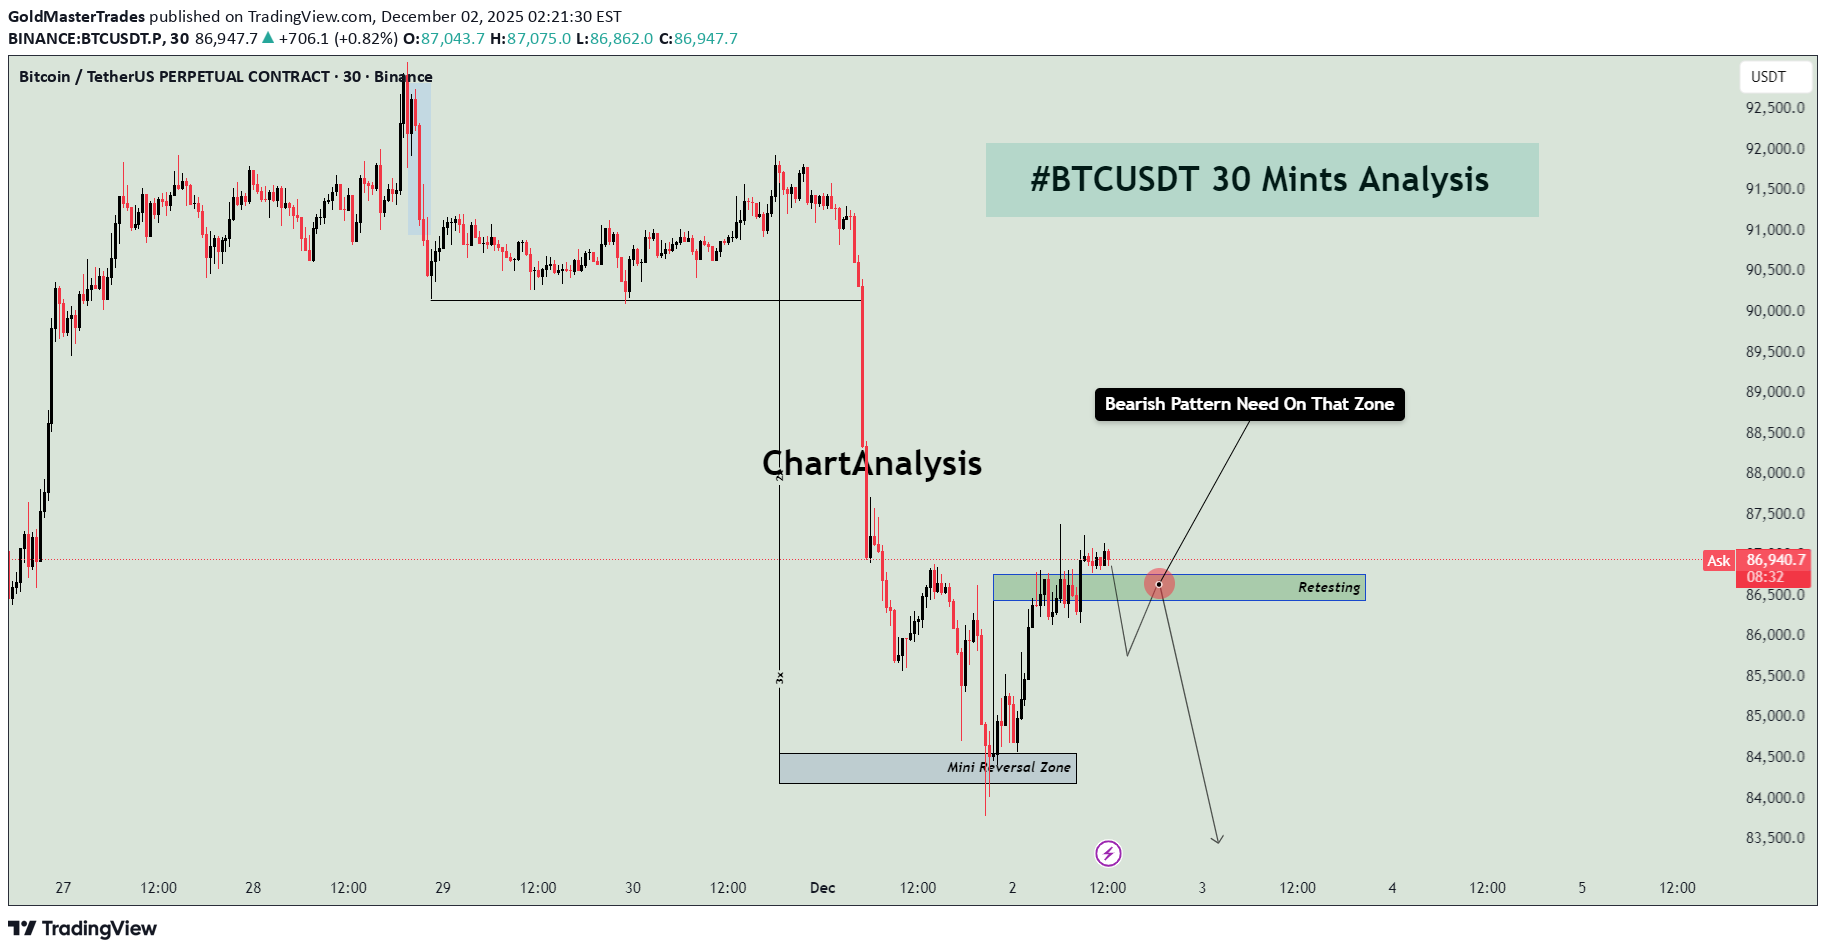
📊 BTCUSDT 30-Minute Technical Analysis – Reversal Zone Under Pressure This 30-minute BTCUSDT chart highlights an important bearish setup forming after a sharp downside move. Bitcoin is currently consolidating near a Reversal Zone, suggesting that price may attempt a retest before continuing lower. 🔻 Market Structure Overview Bitcoin recently experienced: A strong impulsive sell-off A brief consolidation phase A minor recovery back into a previous support now acting as resistance This structure indicates that sellers are still in control. 🟥 Reversal Zone (Major Resistance Area) The highlighted red zone is the primary bearish reaction area. Why this zone matters: Price broke below this level with strong momentum It is now acting as a potential supply zone A bearish candlestick pattern in this area would confirm sellers stepping in Your chart clearly notes: “Bearish Pattern Need On That Zone.” A rejection here is the most important bearish confirmation. 🟦 Mini Reversal Zone (Previous Demand Area) Below current price sits a smaller demand zone. This zone previously showed: Buyer reactions Short-term reversals Support in the recent downtrend If price breaks below this mini zone, BTCUSDT may aim for deeper liquidity levels, confirming bearish continuation. 📉 Expected Price Behavior Based on the projected path drawn on your chart: Price will retest the Reversal Zone A bearish engulfing, pin bar, or rejection wick may form Price may drop aggressively after confirmation Final target is a deeper zone around the previous swing lows The downward arrow illustrates the expected continuation if bulls fail to defend nearby support. ⭐ Key Takeaways Bitcoin remains in a bearish structure on the 30M timeframe A strong bearish pattern in the Reversal Zone is required for confirmation Rejection from this resistance may trigger another downside wave Break and hold above the zone would invalidate the short-term bearish outlook 🧠 Short Summary for Minds Bitcoin is approaching a key Reversal Zone on the 30-minute chart. If a bearish pattern forms here, BTCUSDT may continue dropping toward lower support levels. Sellers remain strong unless bulls break above the resistance zone.