
GoldMarketKiller
@t_GoldMarketKiller

What symbols does the trader recommend buying?
Purchase History
پیام های تریدر
Filter
Signal Type
GoldMarketKiller
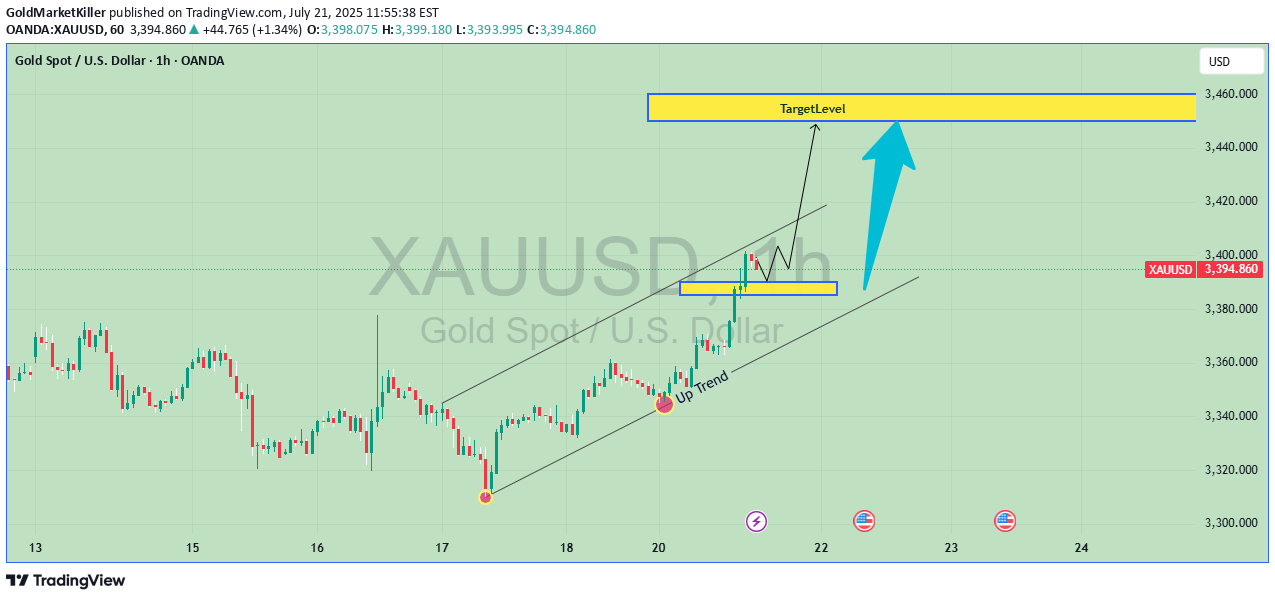
📈 Chart Description: XAU/USD (Gold Spot USD) This chart shows a bullish price action setup for Gold against the U.S. Dollar on the 1-hour timeframe, created using. Here's a breakdown of the key elements: --- 🧩 Pattern and Trend: The chart illustrates an ascending trend starting from around July 17, indicating a strong bullish sentiment. Price is moving inside a rising parallel channel, showing consistent higher highs and higher lows. Around the current price area, the movement has paused and consolidated into a small range, forming a bullish flag or pennant pattern — a classic continuation setup. --- 📌 Key Components Highlighted: 1. Trendline Support: A diagonal support line (labelled “Trend”) helps define the lower boundary of the bullish channel. 2. Consolidation Zone: A small rectangular zone shows price compression just below a resistance area. This indicates indecision, but typically precedes a breakout when part of a larger trend. 3. Breakout Arrow: A blue upward arrow shows the expected direction of breakout — suggesting that price may break out of the consolidation and continue the upward trend. 4. Target Level (Yellow Box): The target area is marked in a bold yellow rectangle near $2,460 - $2,480. This is where the price is expected to reach after the breakout based on the measured move from the prior rally. --- 📉 Support and Resistance: Support: Rising trendline and the base of the consolidation zone. Resistance: The top of the consolidation area. Once broken, this may turn into support. --- 🎯 Trading Implication: This setup suggests a bullish continuation. Traders might look to enter long positions on a breakout above the flag/consolidation area. The target zone is around $3,460–$3,480, aligning with the height of the previous impulse wave. Please share your Thoughts about my Analysis
GoldMarketKiller
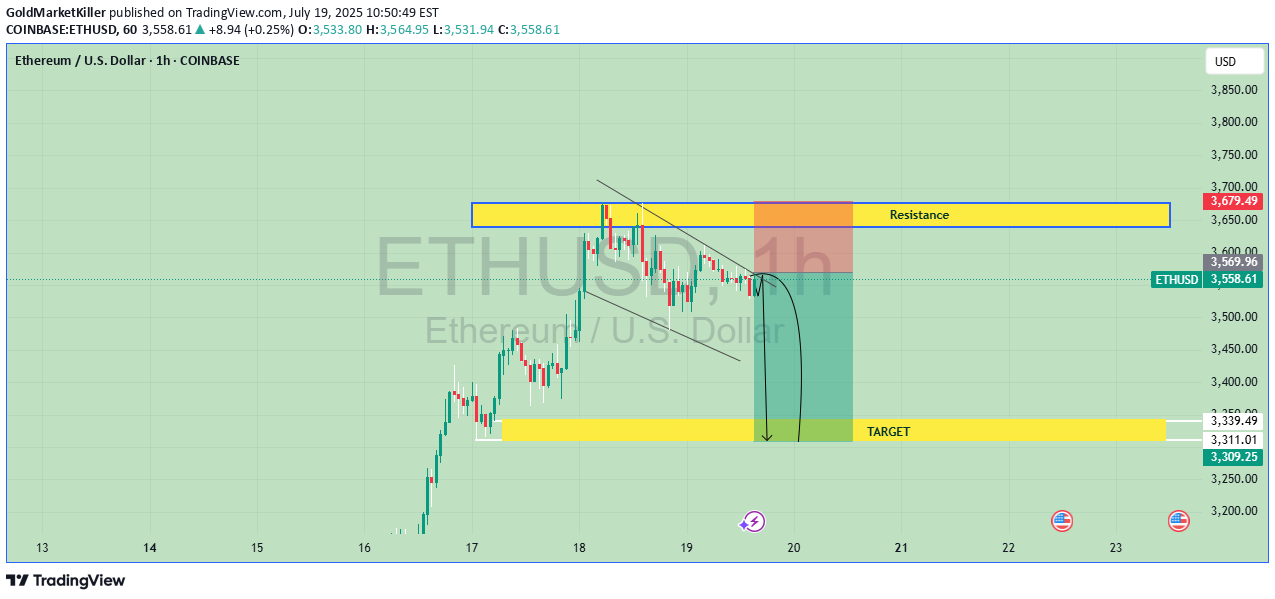
our chart shows a short setup on ETH/USD (Ethereum vs US Dollar) using resistance rejection and target-based risk/reward analysis. Here's a breakdown of what's happening and a trading idea based on it: --- 🔍 Chart Summary: Resistance Zone (around $3,560 - $3,600): Price hit this zone and rejected it. Entry Point: Short position was likely opened after the rejection candle. Target Zone (around $3,300 - $3,310): Marked as the price target. Risk Zone (Stop-loss area): Slightly above the resistance zone. --- 🧠 Trading Idea: 📉 Short Trade Plan: Bias: Bearish (expecting a price drop) Entry Zone: ~$3,550 - $3,580 (after confirmation of resistance rejection) Stop-Loss: ~$3,600+ Take-Profit (TP): ~$3,300 📊 Risk to Reward Ratio (RRR): Risk: ~$50 per ETH Reward: ~$250 per ETH RRR = 1:5 – favorable for a short trade --- ✅ Conditions to Monitor: 1. Bearish Confirmation: Watch for strong bearish candles or breakdown below minor support. 2. Volume: Increase in sell volume = stronger move down. 3. Market Sentiment: Ensure broader crypto sentiment is not overly bullish (check BTC and ETH news). 4. Invalidation: If price closes above resistance, setup is invalid. --- ⚠️ Caution: News or events can quickly reverse technical patterns. Always use proper risk management. Share your feedback in comments section
GoldMarketKiller
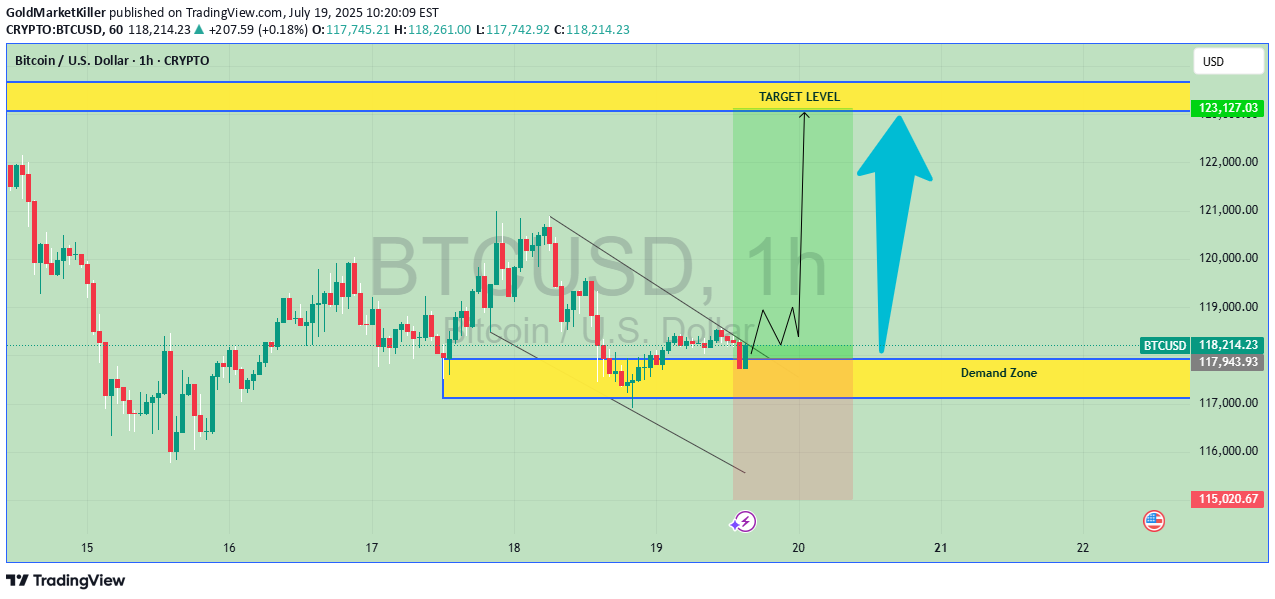
The chart you’ve shared is a BTC/USD 1-hour chart showing a potential long (buy) trade setup based on a demand zone and expected upward momentum. Here's a breakdown and ideas based on the setup: --- 🔍 Chart Analysis Summary: Demand Zone (Support Area): Marked in yellow. Price is currently consolidating near this zone, which suggests buyer interest. Target Level: Around 123,071.07 USD, marked with a large blue arrow. Current Price: Approximately 118,008.87 USD. Setup Type: Reversal or breakout from demand zone. Expected Move: Bounce from demand zone → short consolidation → bullish move to target. --- 💡 Trading Ideas: 1. Long Setup Idea (Based on the Chart) Entry: Near current price, inside or slightly above the demand zone (~117,000 - 118,000 USD). Stop-Loss: Just below the demand zone (~116,000 USD or based on recent swing low). Target: ~123,000 USD. ( Marked with Yellow Box) Risk-Reward Ratio: ~1:3 or higher depending on exact SL. 2. Confirmation Strategy (Safer Entry) Wait for: Bullish candlestick pattern (engulfing, pin bar, etc.) inside demand zone. Break above minor resistance (~118,300). Entry on breakout + retest. 3. Alternative Idea – Range Scalping If price continues to range within the demand zone: Scalp buys at lower boundary (~117,000). Scalp sells near upper short-term resistance (~118,500). Use tight SLs, as breakout could happen anytime. --- ⚠️ Cautions: This is a short-term idea (1-hour chart) – monitor frequently. If BTC breaks below the demand zone with volume, consider the setup invalidated. Always use stop-loss to protect capital. Please support with Boost and comments i will be Glad
GoldMarketKiller
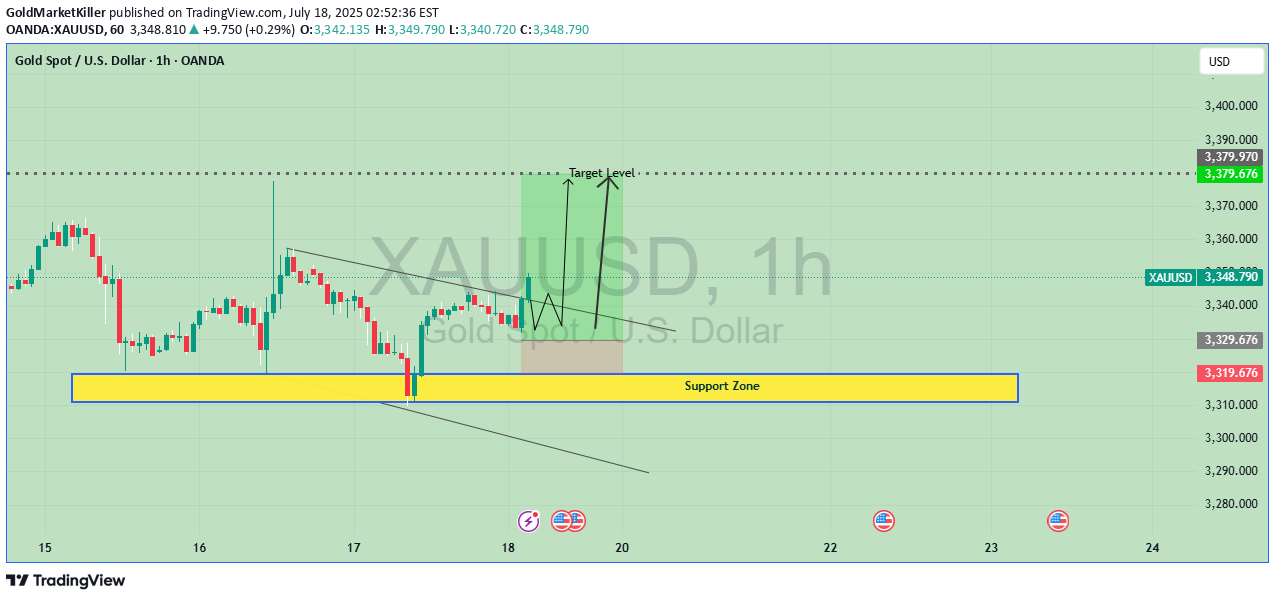
This chart is a technical analysis for XAU/USD (Gold vs. US Dollar) on the 1-hour timeframe. It highlights a potential bullish reversal setup. Here's a breakdown and idea based on the chart --- 🧠 Trading Idea: Bullish Reversal from Support Zone 📍 Chart Insights: Support Zone: The yellow highlighted zone (~$3,170 - $3,180) has acted as a strong support level. Falling Wedge Pattern: A bullish falling wedge appears to have formed and price is breaking out. Target Level: Clearly marked around $3,375–$3,380, suggesting a possible bullish rally. Double Bottom or W Formation: The potential "W" shape indicates a trend reversal pattern. --- 🟢 Bullish Idea (Long Trade) ✅ Entry: Around $3,335–$3,330, after confirmation of wedge breakout. 🎯 Target: First Target: $3,375>3,380 🛡️ Stop Loss: 3320.00 📈 Risk-Reward Ratio: Approx. 1:2 to 1:3, depending on entry and stop. --- 🔍 Trade Management Tips: Wait for a strong bullish candle above the wedge before entry. Scale in partially if unsure; add more on confirmed upward momentum. Watch for fundamental events (e.g., Fed statements, inflation data) that may affect gold. Please Kindly support with Boost and Comments.Trade Active from 3348 to 3354 60 pips Sucessfully DoneTarget Reached Enjoy your special profit
GoldMarketKiller
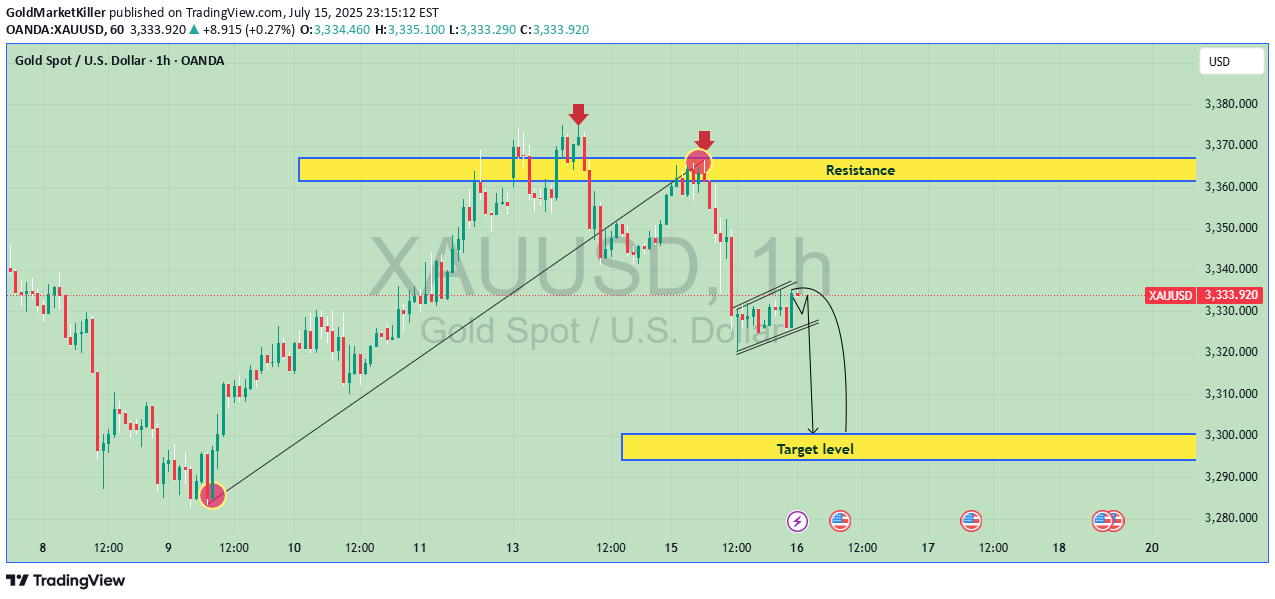
🔍 Chart Analysis Pairs XAU>USD Timeframe 1 Hour Trend: Gold is in a short-term downtrend. Structure: You’ve marked a clear resistance zone with two rejection points (double top formation). Current Price Action: A bear flag pattern is forming (small rising channel within a larger down move). Idea: Likely bearish continuation if the flag breaks downward. Target: The marked target zone around 3,300 aligns with the measured move from the flag. --- ✅ Trade Idea: Entry: On breakdown below the bear flag. Stop: Above the flag’s upper trendline or just above 3,340. Target: ~3,300 zone (support area). Please kindly support with Boost and Comment [9:11 PM, 7/15/2025] junaidmemon6660: Great — thanks for the chart! 🔍 Chart Analysis (XAU/USD, 1H): Trend: Gold is in a short-term downtrend. Structure: You’ve marked a clear resistance zone with two rejection points (double top formation). Current Price Action: A bear flag pattern is forming (small rising channel within a larger down move). Idea: Likely bearish continuation if the flag breaks downward. Target: The marked target zone around 3,300 aligns with the measured move from the flag. --- ✅ Trade Idea: Entry: On breakdown below the bear flag. Stop: Above the flag’s upper trendline or just above 3,340. Target: ~3,300 zone (support area). Please kindly support with Boost and CommentTrad Active from 3333 to 3310 sell side 230 pips Enjoy your special profit BuddiesFully Hold Sell side GuyzFull focus sellHold Sell
GoldMarketKiller
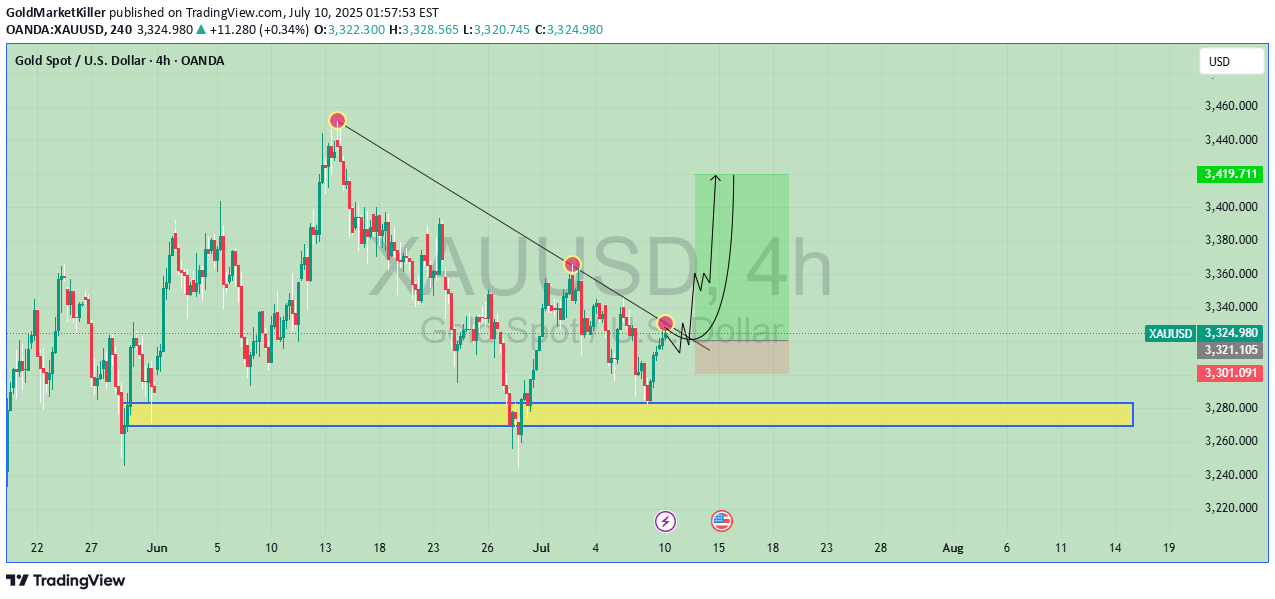
Here’s your today’s 4‑hour XAU/USD (Gold vs USD) analysis for July 10, 2025:---📊 Market OverviewTechnical outlook: Gold is in a short-term bearish correction within a potential wedge pattern. Price is hovering near $3,295/oz, testing support around $3,280–$3,285 .Key zones:Support: $3,280–$3,285. A sustained hold may lead to a rebound.Resistance: $3,325–$3,335. Break above ~$3,325–3,330 is needed to resume upward momentum .---🔍 Short-Term ScenariosBullish rebound:If price holds above $3,280 and gold forms a reversal candle (like a hammer), we could see a bounce toward upper resistance: $3,325–$3,365, potentially even $3,375+ .Bearish breakdown:A drop below $3,255 confirms the bearish wedge breakdown, opening a path to $3,185–$3,195 .---🧭 Fundamental DriversDollar & Yields: A weaker USD and falling Treasury yields provide support. Conversely, a stronger greenback or rising yields would suppress gold .Trade tensions: Renewed U.S. tariffs keep safe-haven demand alive, albeit with “tariff fatigue” dampening impact .Fed policy: Markets await FOMC minutes (released today). A dovish tone could weaken USD and lift gold to ~$3,340; a hawkish stance could push it down .---🎯 Trade Setup Ideas (4‑Hour Frame)1. Long SetupEntry: Near $3,280–$3,285 if bullish reversal candle appears.Stop-loss: Below $3,275.Take-profit: Partial at $3,325, full near $3,365.2. Short SetupEntry: On clean break and close below $3,255.Stop-loss: Above $3,270 (just above breakdown zone).Take-profit: Partial at $3,195, extended to $3,185.---🔎 ConclusionNeutral to slightly bearish bias: Leaning bearish unless bounce from $3,280 holds and breaks above $3,325.Watch today's FOMC minutes — could trigger a decisive move.Manage risk carefully with tight stops around the key zones.---Let me know if you’d like chart-based trade plan details or help lining up entry triggers!Trade Runing in profit Enjoy your profit Buddies
GoldMarketKiller
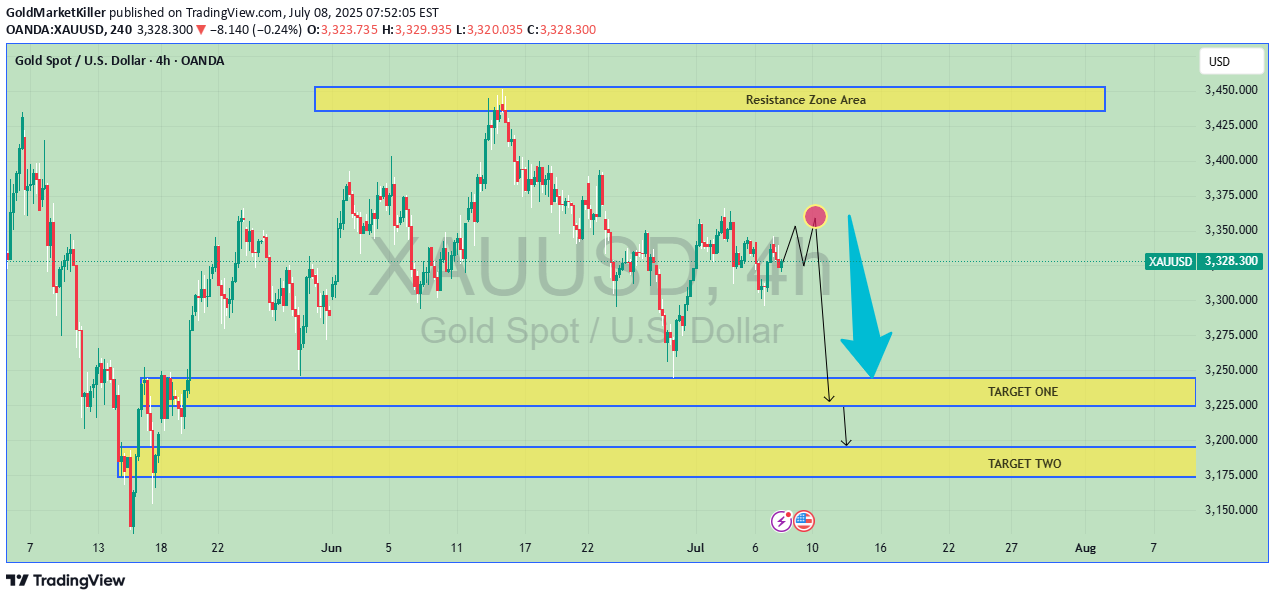
XAUUSD 4 Hour Analysis Shows Bearish Setup with breakdown from ascending trendline and confirmation below.Trade Suggests follwingTwo Targets Target point one 3320Second Target point 3180Price has rejected from ResistNCE Zone( Marked yellow Rectangle Box blue borders)Trade Type Bais Bearish if the price stays below 3250 these targets remains valid watch for retrest failure or strong rejection candle to confirm entries Please Kindly Support with Boost and comments i will be glad
GoldMarketKiller
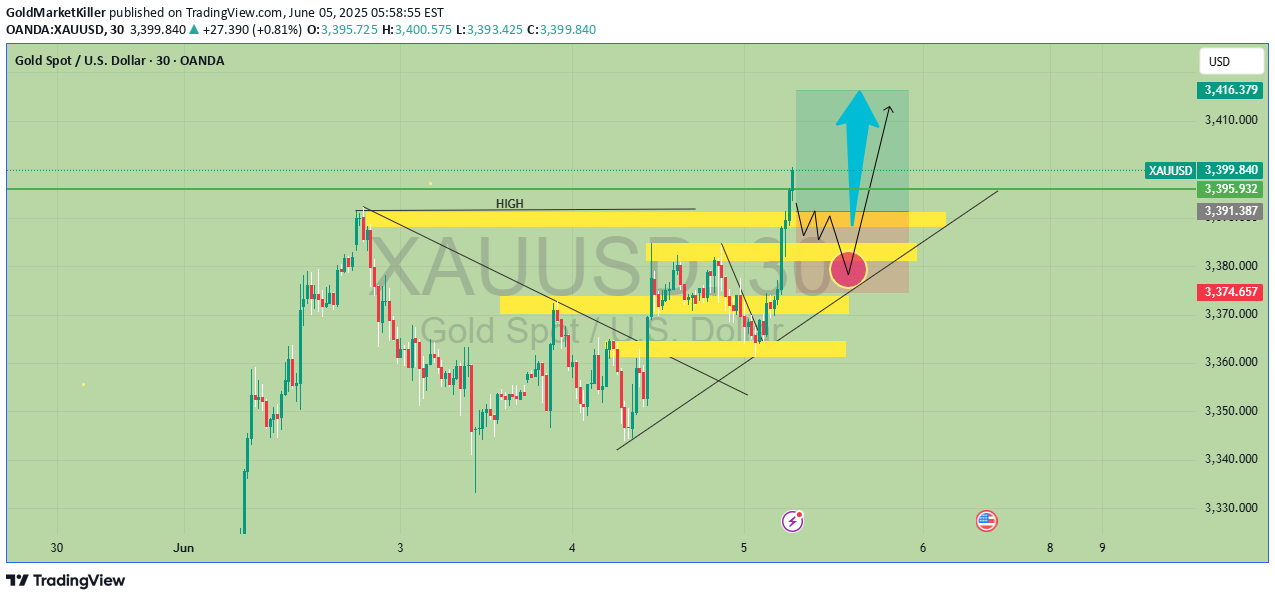
📊Hi Guy this is overview of Xauusd feel free write your feedback in comments.🔴Current price 3395🧱Timeframe 30 minutes 🔰if the price stays above from 3380 the next target will be 3416🔺Please kindly support with Boost and comments
GoldMarketKiller
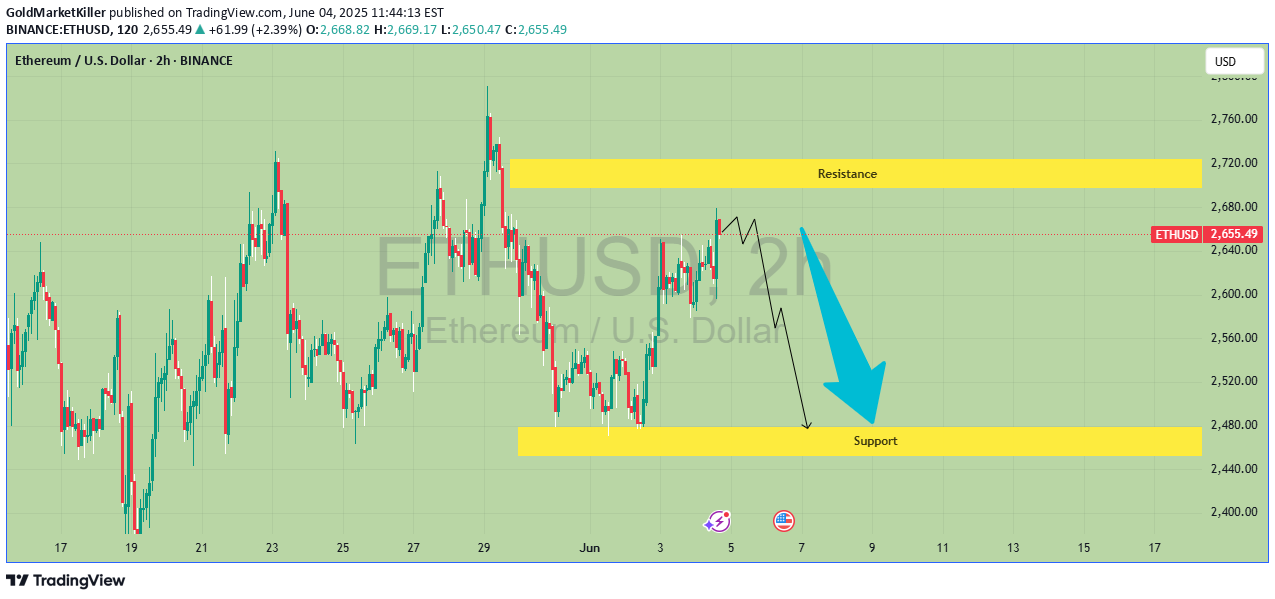
♦️Ethereum Technical Analysis Bearish Rejection Below Resistance ⚠️⏰ TimeFrame 2 Hour🟢 Overview 🔹 The Chart displays a clear range bound market between well defined resistance and support zone. The most recent price action suggests a rejection from the resistance region hinting at possible downward move toward support. 🔻Key Levels 🔻🔴 Resistance Zone 2720 🔺 Support zone 2460📊 Price tested this zones multiple and failed to break above decisvely.💡 Market structure and price Action🧱 The recent swing high formed high relative to the peak 29 May suggests Bearish momentum.🧲 A projeted bearish move marked on the chart with Black arrow forecasting a drop from around 2640 down to the support zone near 2480
GoldMarketKiller
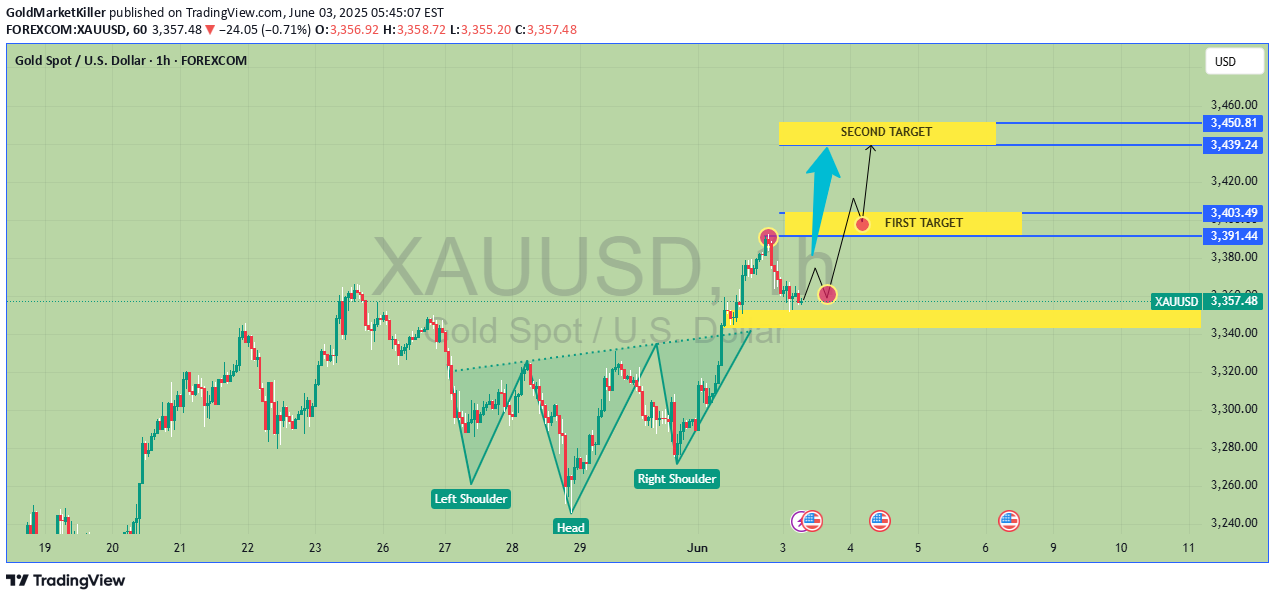
🛑 Gold is Showing a potential short tern with the Bullish Trend🧱 Two Days ago, it confirmed an inverse head and shoulders pattern, suggesting further upside.📍 However , the recent price stage surge appears to be unsupported by strong fundamentals.✅ The trump tariff news is oudated and bullish movement appears driven more by market manipulation than natural developments.🔺 Gold may rise again, as indicated on the chart ⚠️ High risk gold could decline unexpectedly making this setup
Disclaimer
Any content and materials included in Sahmeto's website and official communication channels are a compilation of personal opinions and analyses and are not binding. They do not constitute any recommendation for buying, selling, entering or exiting the stock market and cryptocurrency market. Also, all news and analyses included in the website and channels are merely republished information from official and unofficial domestic and foreign sources, and it is obvious that users of the said content are responsible for following up and ensuring the authenticity and accuracy of the materials. Therefore, while disclaiming responsibility, it is declared that the responsibility for any decision-making, action, and potential profit and loss in the capital market and cryptocurrency market lies with the trader.