Technical analysis by GoldMarketKiller about Symbol BTC: Buy recommendation (7/19/2025)

GoldMarketKiller
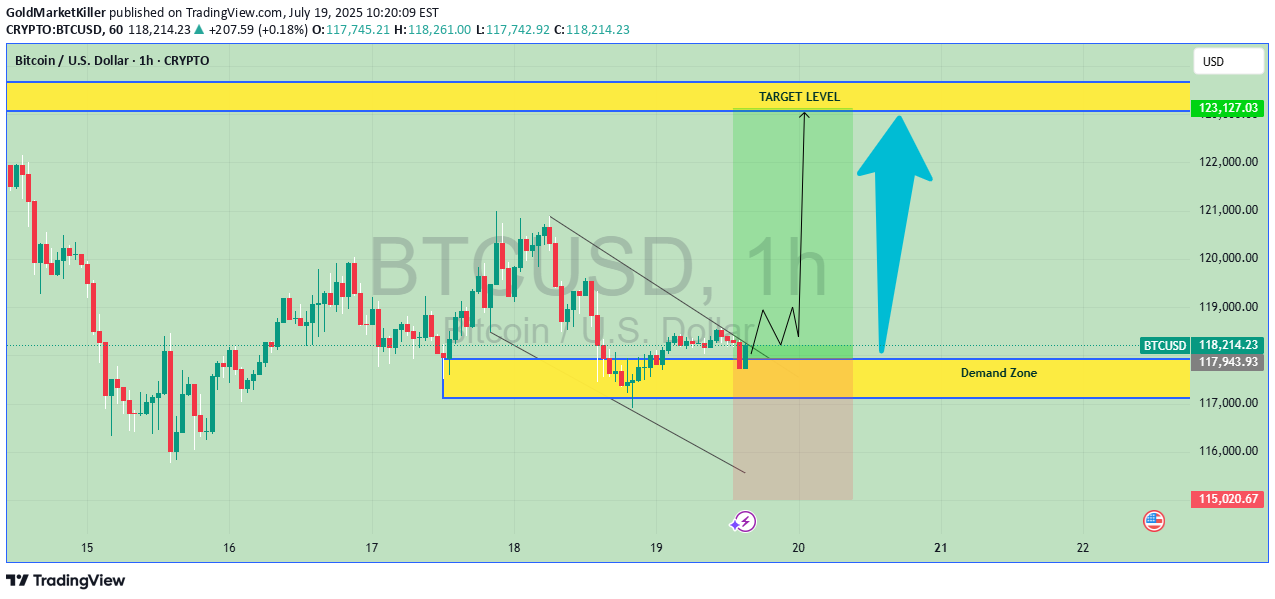
The chart you’ve shared is a BTC/USD 1-hour chart showing a potential long (buy) trade setup based on a demand zone and expected upward momentum. Here's a breakdown and ideas based on the setup: --- 🔍 Chart Analysis Summary: Demand Zone (Support Area): Marked in yellow. Price is currently consolidating near this zone, which suggests buyer interest. Target Level: Around 123,071.07 USD, marked with a large blue arrow. Current Price: Approximately 118,008.87 USD. Setup Type: Reversal or breakout from demand zone. Expected Move: Bounce from demand zone → short consolidation → bullish move to target. --- 💡 Trading Ideas: 1. Long Setup Idea (Based on the Chart) Entry: Near current price, inside or slightly above the demand zone (~117,000 - 118,000 USD). Stop-Loss: Just below the demand zone (~116,000 USD or based on recent swing low). Target: ~123,000 USD. ( Marked with Yellow Box) Risk-Reward Ratio: ~1:3 or higher depending on exact SL. 2. Confirmation Strategy (Safer Entry) Wait for: Bullish candlestick pattern (engulfing, pin bar, etc.) inside demand zone. Break above minor resistance (~118,300). Entry on breakout + retest. 3. Alternative Idea – Range Scalping If price continues to range within the demand zone: Scalp buys at lower boundary (~117,000). Scalp sells near upper short-term resistance (~118,500). Use tight SLs, as breakout could happen anytime. --- ⚠️ Cautions: This is a short-term idea (1-hour chart) – monitor frequently. If BTC breaks below the demand zone with volume, consider the setup invalidated. Always use stop-loss to protect capital. Please support with Boost and comments i will be Glad
