
GURULifeline
@t_GURULifeline

What symbols does the trader recommend buying?
Purchase History
پیام های تریدر
Filter
تحلیل ساختاری XRP: پایان روند صعودی و ورود به فاز نزولی (بررسی هفتگی و 2 روزه)
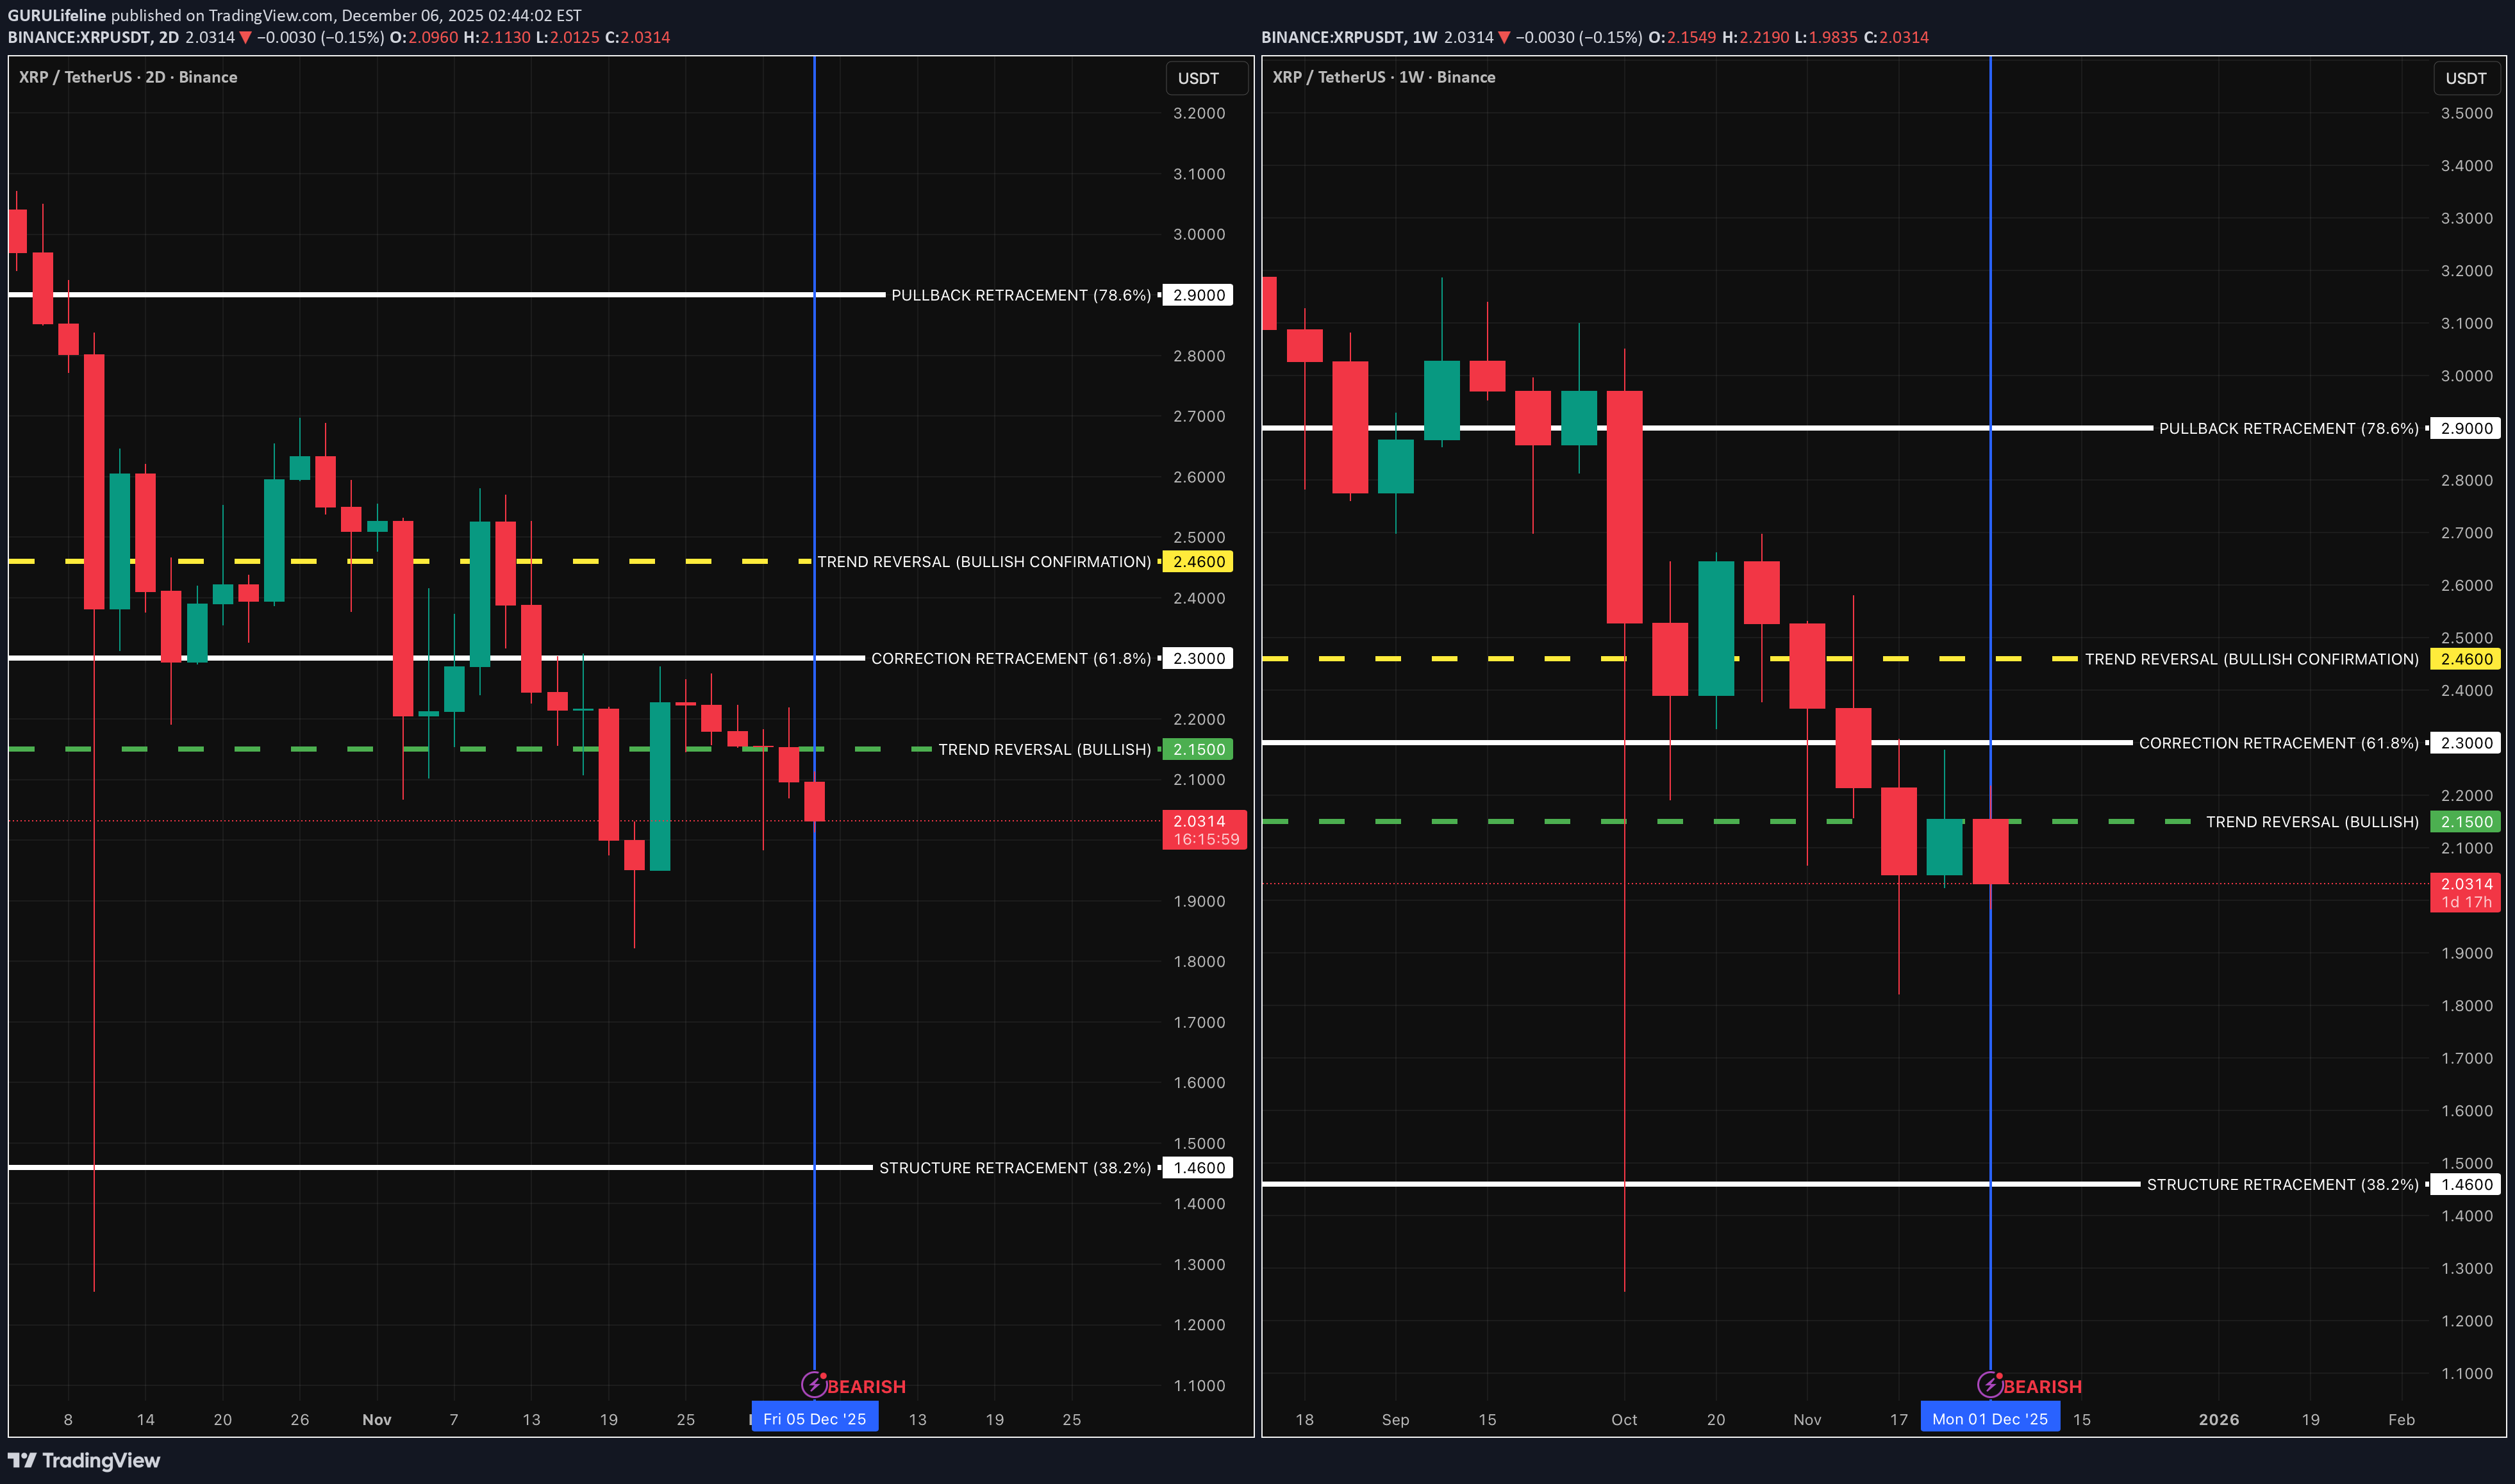
XRP has now entered a bearish classification across both the 2-Day and Weekly charts. The structure that supported the prior trend has been fully compromised. The initial bearish structure shift began on the 2-Day chart at $2.05, which was the Origin level where momentum first transitioned. The Weekly chart confirmed its own structural reversal at $2.15, where XRP lost its higher-timeframe trend support. Price also broke through the closest structural retracement at $2.30, which served as the final holding point of the prior trend. With that level gone, XRP is now operating inside a confirmed structural downturn. The next structural reference levels beneath current price sit at: •$1.64 — the nearest intermediate retracement zone •$1.46 — the next major structural support layer These levels are simply the next logical points in the framework where structure has historically responded. They are not predictions, but rather reactive reference zones based on how the trend has already unfolded. This classification reflects the beginning of a bearish trend cycle, identified strictly through structural deterioration — not forecasting. As long as XRP remains beneath the reversal levels of $2.05 (2D) and $2.15 (Weekly), the underlying classification remains bearish.
تحلیل تکنیکال XRP: وضعیت فعلی روند صعودی و نقاط کلیدی برای هفته 49 (2 روزه)
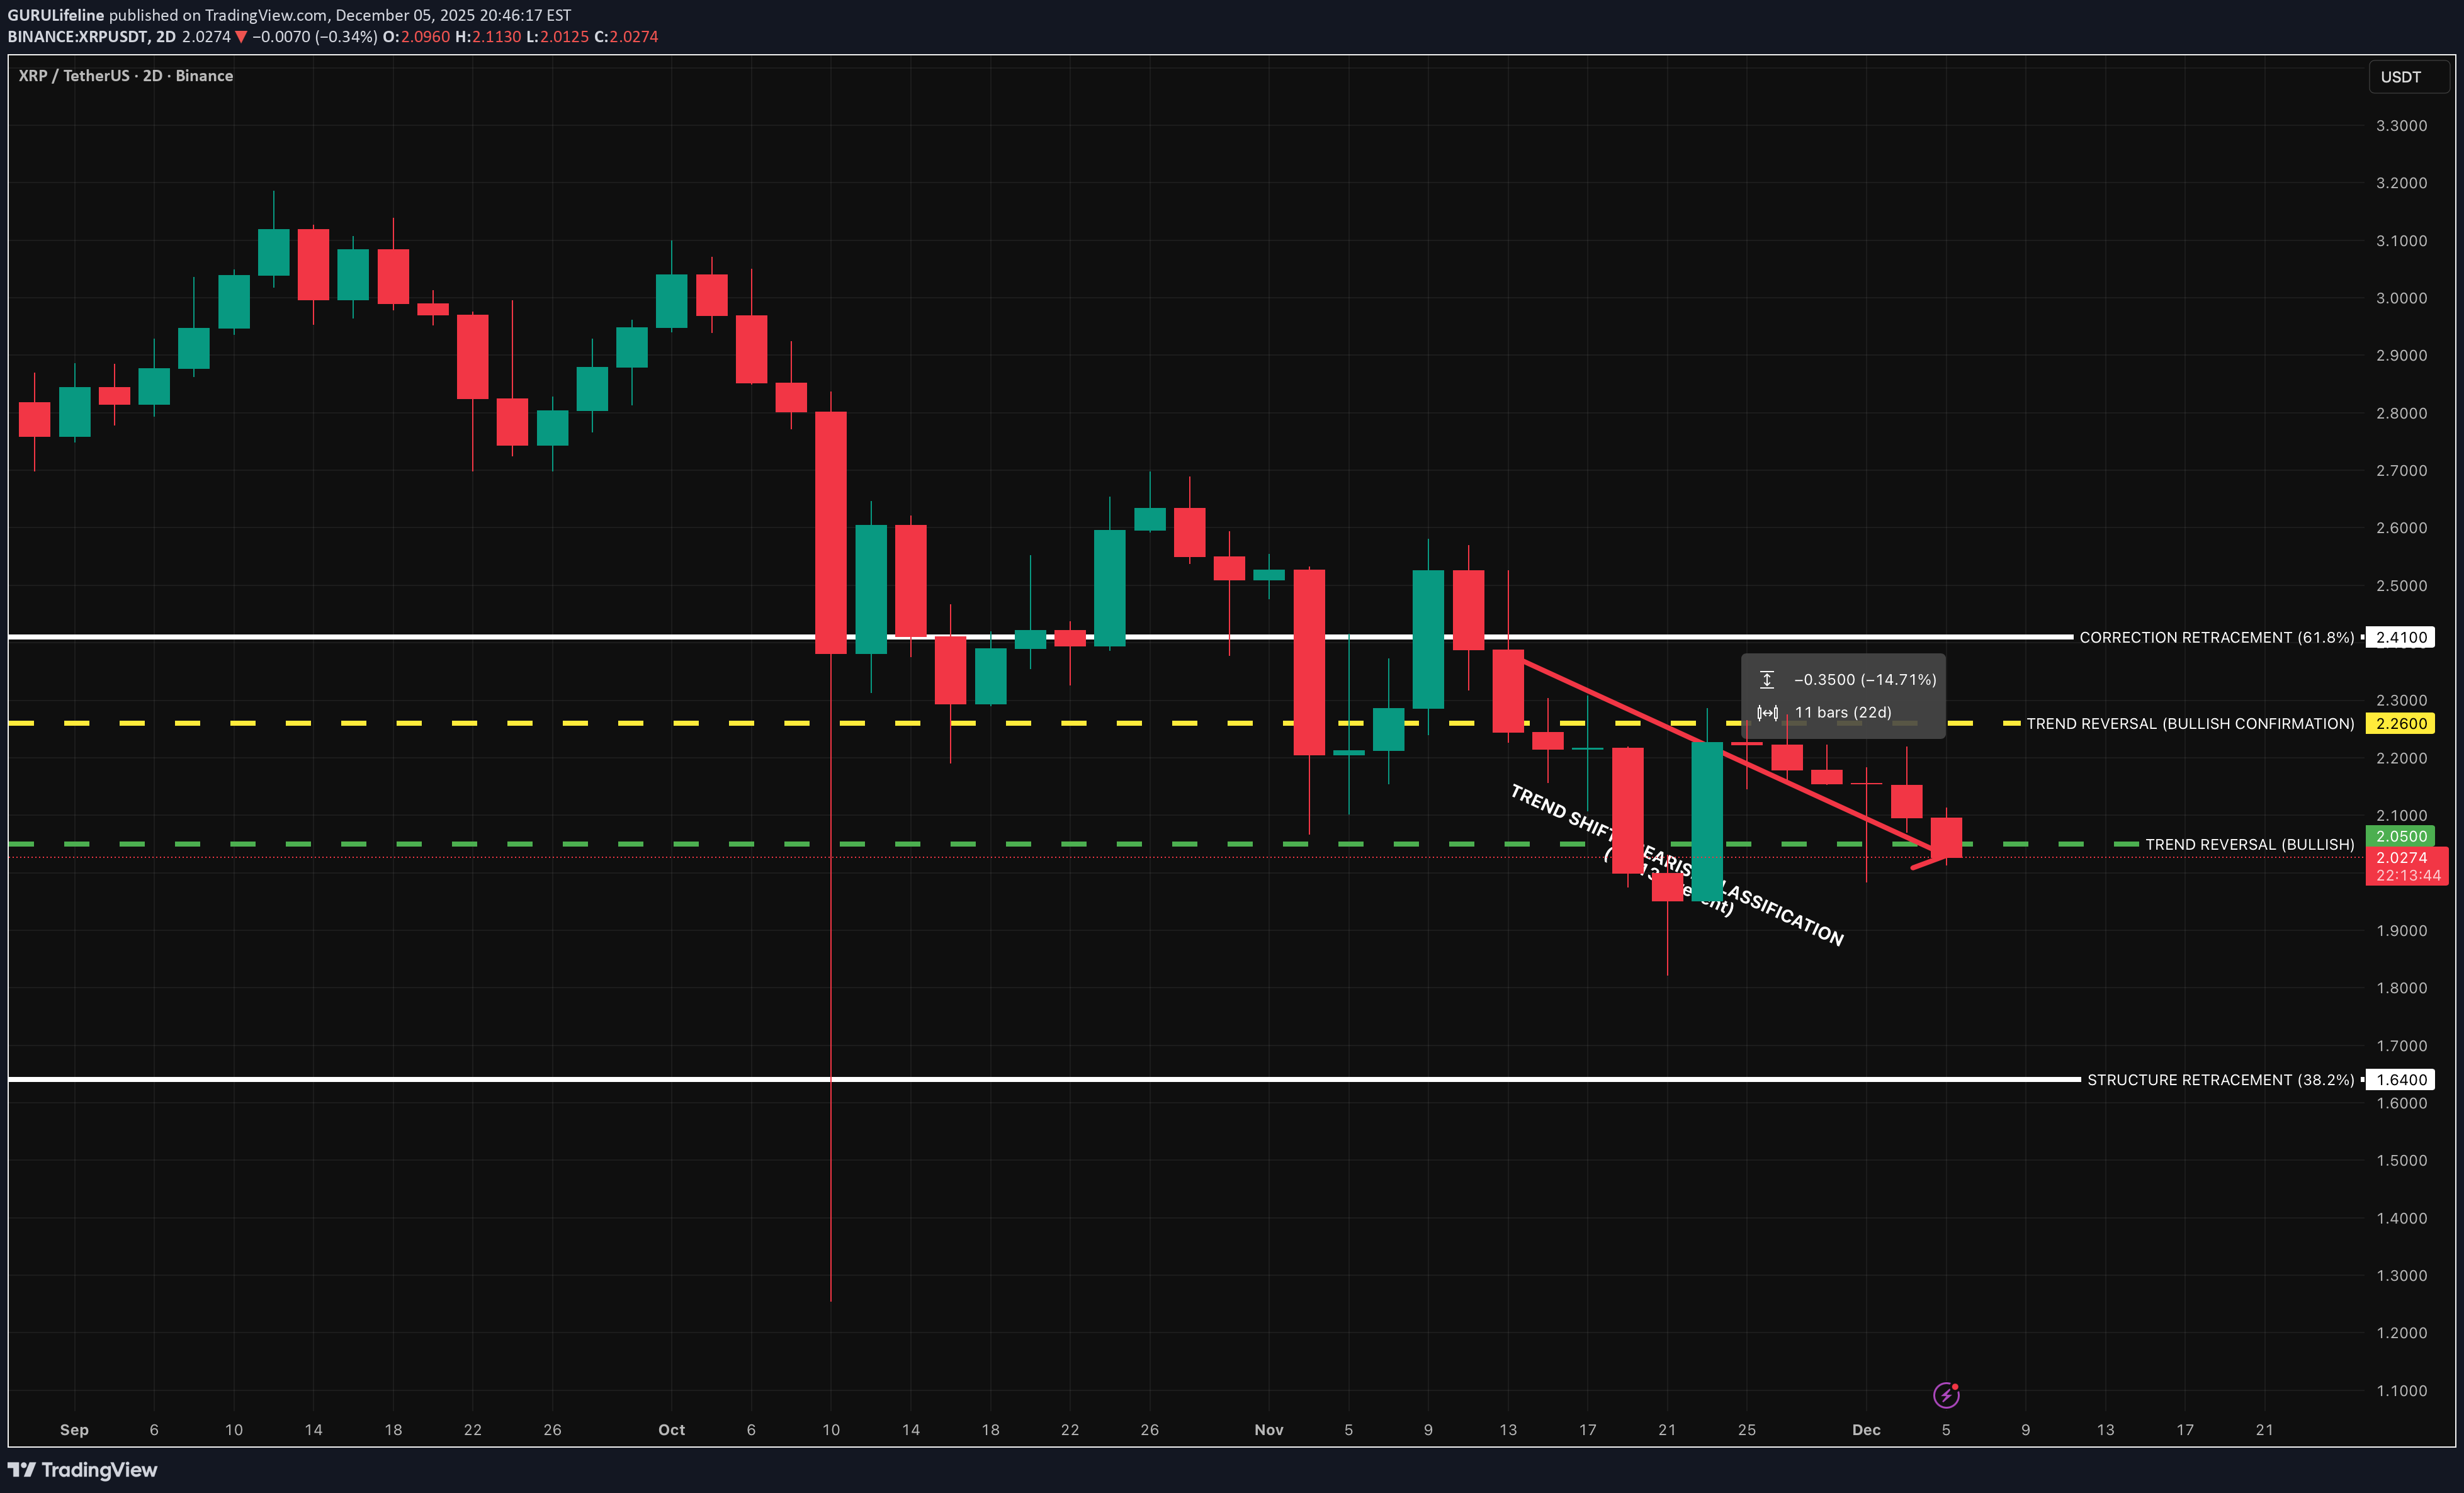
XRP — [2D] WEEK 49 TREND REPORT | 12/05/2025 Ticker: XRPUSDT Timeframe: 2D This is a reactive structural classification of XRP based on the weekly chart as of this timestamp. Price conditions are evaluated as they stand — nothing here is predictive or forward-assumptive. ⸻ 1) Current Trend Condition [ Numbers to Watch ] Current Price @ 2.03 • Trend Duration @ +22 Days ( Bullish ) [-14.71%] • Trend Reversal Level ( Bullish ) @ 2.05 • Trend Reversal Level ( Bullish Confirmation ) @ 2.26 • Correction Retracement @ 2.41 • Structural Support @ 1.64 ⸻ 2) Structure Health • Retracement Phase: Testing Structure (approaching 38.2%) • Position Status: Unstable (price below both structural layers) ⸻ 3) Temperature : Cooling Phase ⸻ 4) Momentum : Bearish ⸻ Author’s Note DOWNWARD STRUCTURAL ALIGNMENT This mark identifies a moment where the market showed clearer alignment with downside direction. It does not predict future movement, but acknowledges where weakness became more evident within the prevailing structure. Its relevance remains only while price continues to hold beneath key structural boundaries. ⸻ Methodology Overview This classification framework evaluates directional conditions using internal trend-interpretation logic that references price behavior relative to its structural layers. These relationships are used to identify when price movement aligns with the framework’s criteria for directional phases, transition points, or regime shifts. Visual elements or structural labels reflect these internal interpretations, rather than explicit trading signals or preset indicator crossovers. This framework is observational only and does not imply future outcomes.
تحلیل ساختاری اتریوم (ETH): وضعیت فعلی، سطوح کلیدی و روند نزولی هفته ۴۹
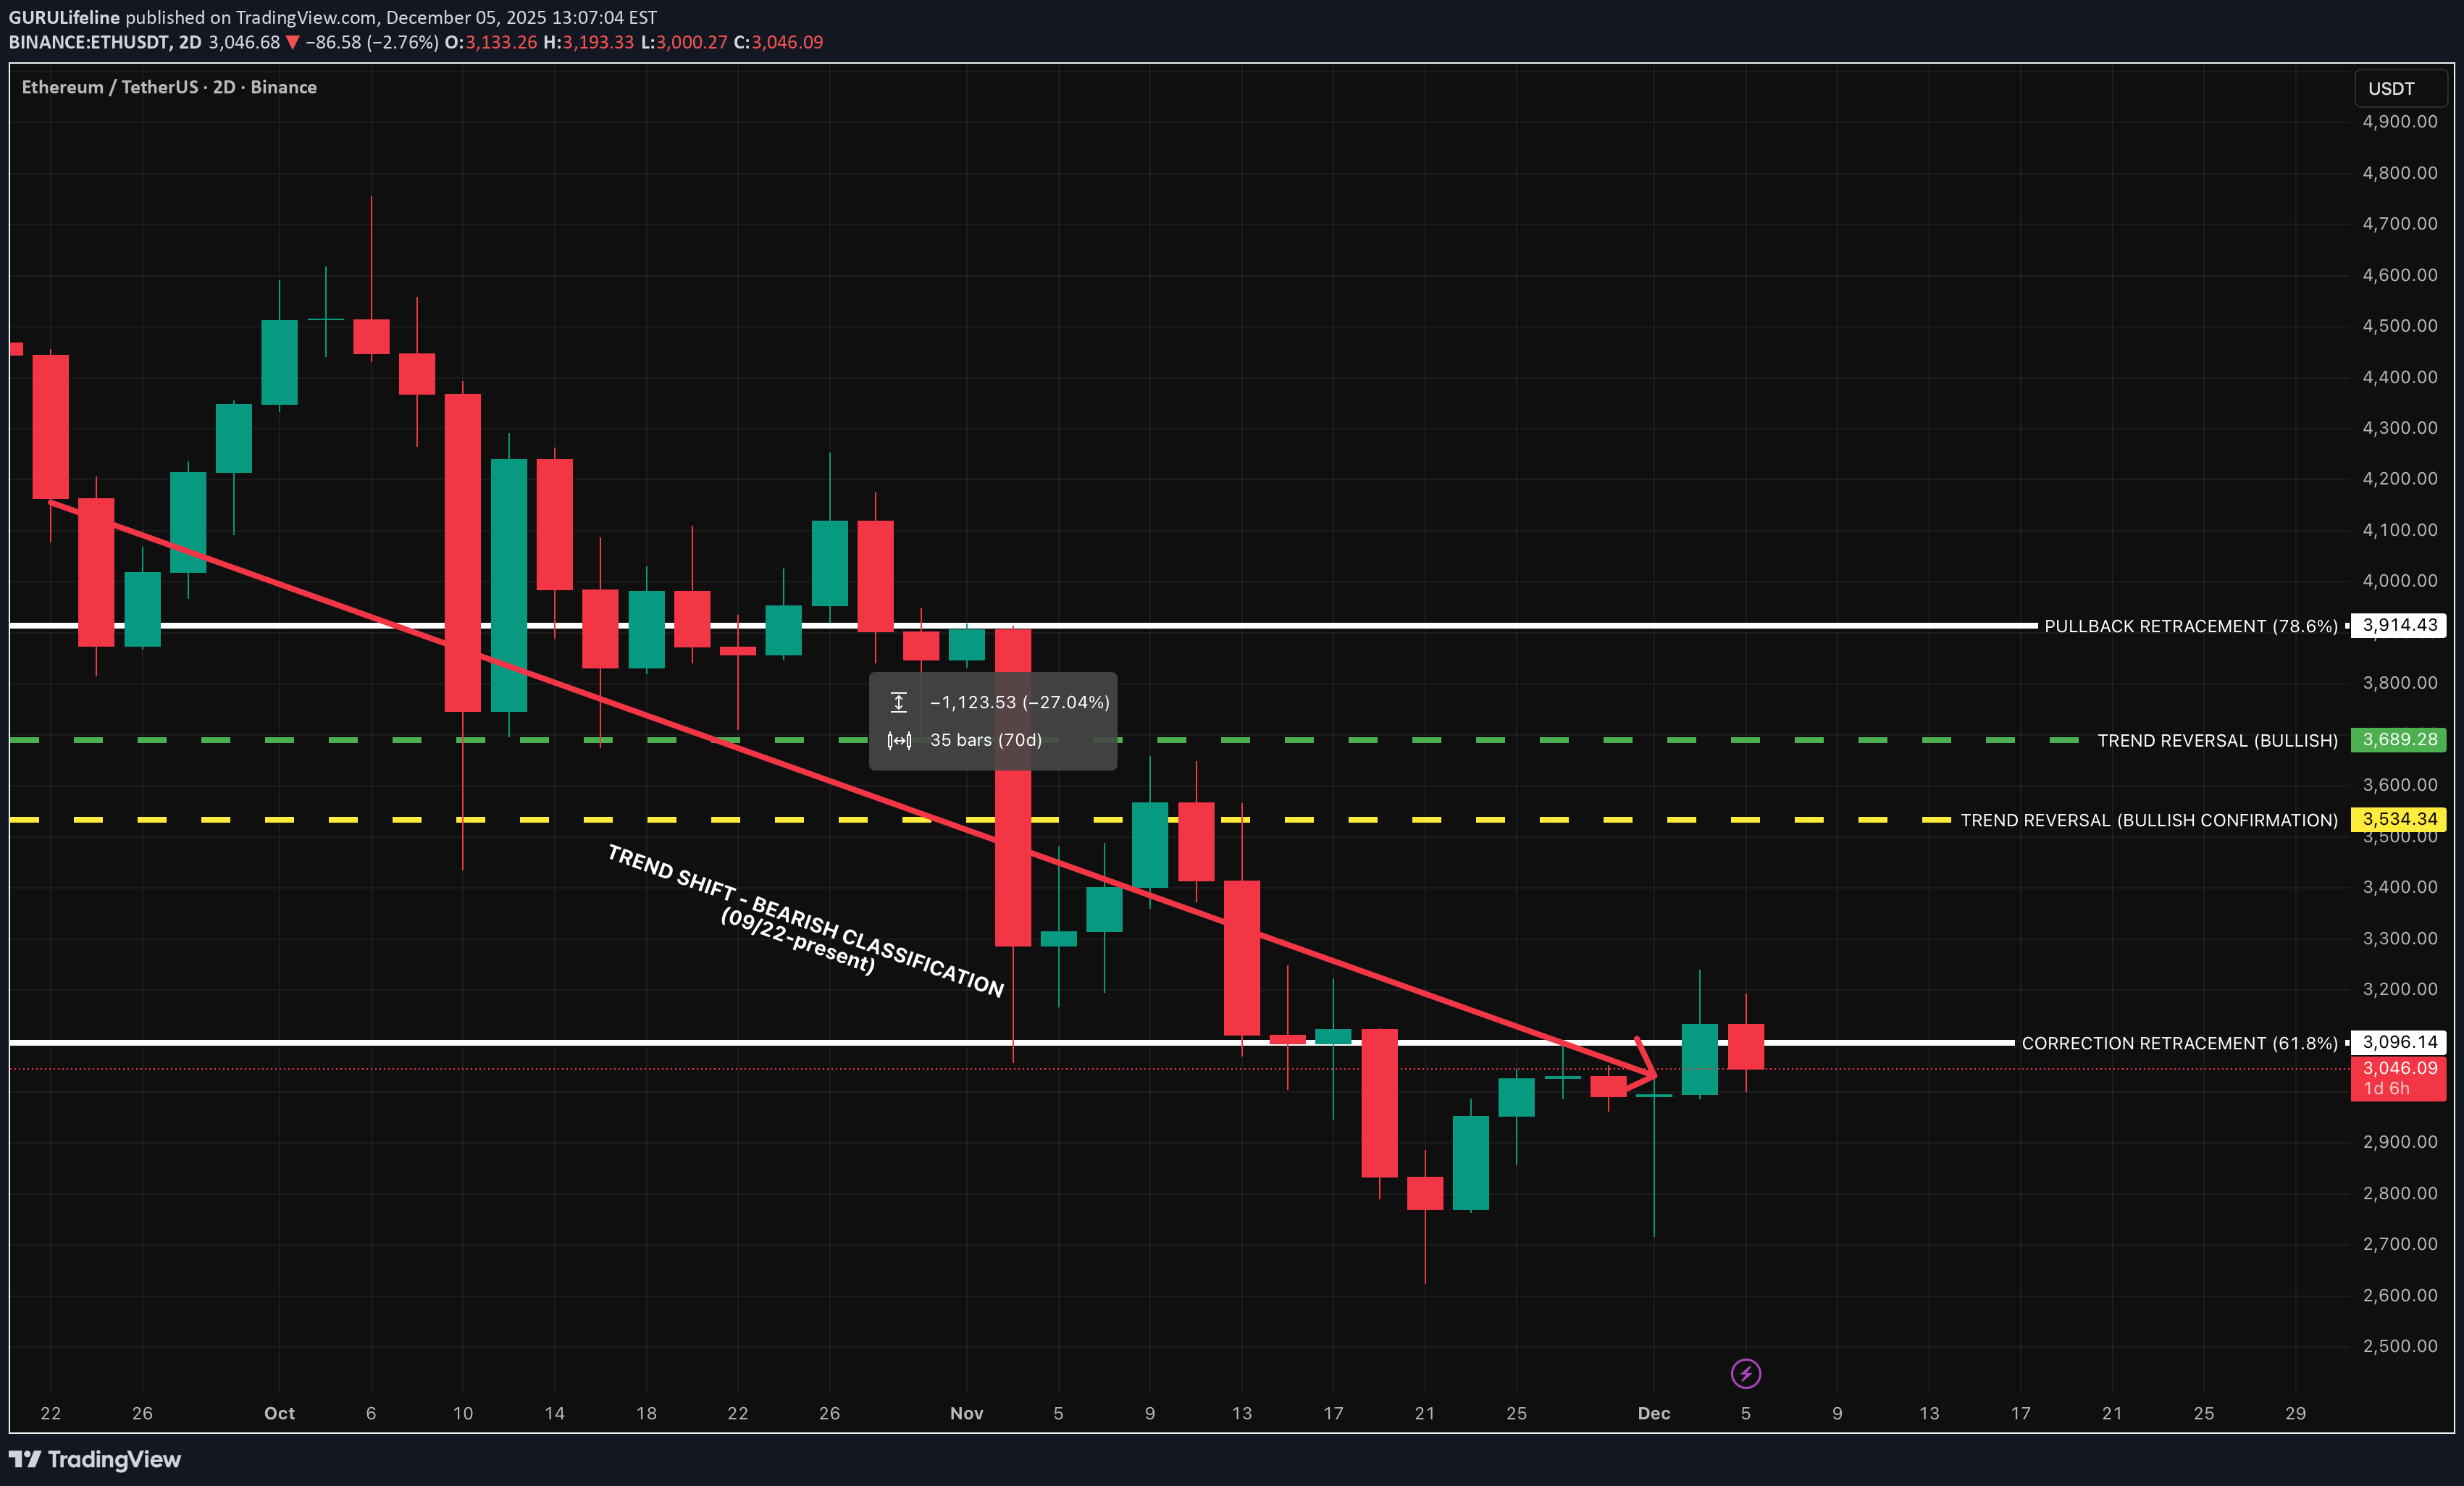
ETH — [2D] WEEK 49 TREND REPORT | 12/05/2025 Ticker: ETHUSDT Timeframe: 2D This is a reactive structural classification of ETH based on the weekly chart as of this timestamp. Price conditions are evaluated as they stand — nothing here is predictive or forward-assumptive. ⸻ 1) Current Trend Condition [ Numbers to Watch ] Current Price @ 3,030 • Trend Duration @ +70 Days ( [I]Bearish [/I]) [-27%] • Trend Reversal Level ( Bullish ) @ 3,689 • Trend Reversal Level ( Bullish Confirmation ) @ 3,534$ • Pullback Resistance @ 3,914 • Correction Support @ 3,096$ • Structural Support @ 1,946$ ⸻ 2) Structure Health • Retracement Phase: Testing Structure (approaching 38.2%) • Position Status: Unstable (price below both structural layers) ⸻ 3) Temperature : Cooling Phase ⸻ 4) Momentum : Bearish ⸻ Author’s Note DOWNWARD STRUCTURAL ALIGNMENT This mark identifies a moment where the market showed clearer alignment with downside direction. It does not predict future movement, but acknowledges where weakness became more evident within the prevailing structure. Its relevance remains only while price continues to hold beneath key structural boundaries. ⸻ Methodology Overview This classification framework evaluates directional conditions using internal trend-interpretation logic that references price behavior relative to its structural layers. These relationships are used to identify when price movement aligns with the framework’s criteria for directional phases, transition points, or regime shifts. Visual elements or structural labels reflect these internal interpretations, rather than explicit trading signals or preset indicator crossovers. This framework is observational only and does not imply future outcomes.
تحلیل ساختاری بیت کوین (BTC): وضعیت فعلی، حمایتها و هشدار نزولی در هفته ۴۹
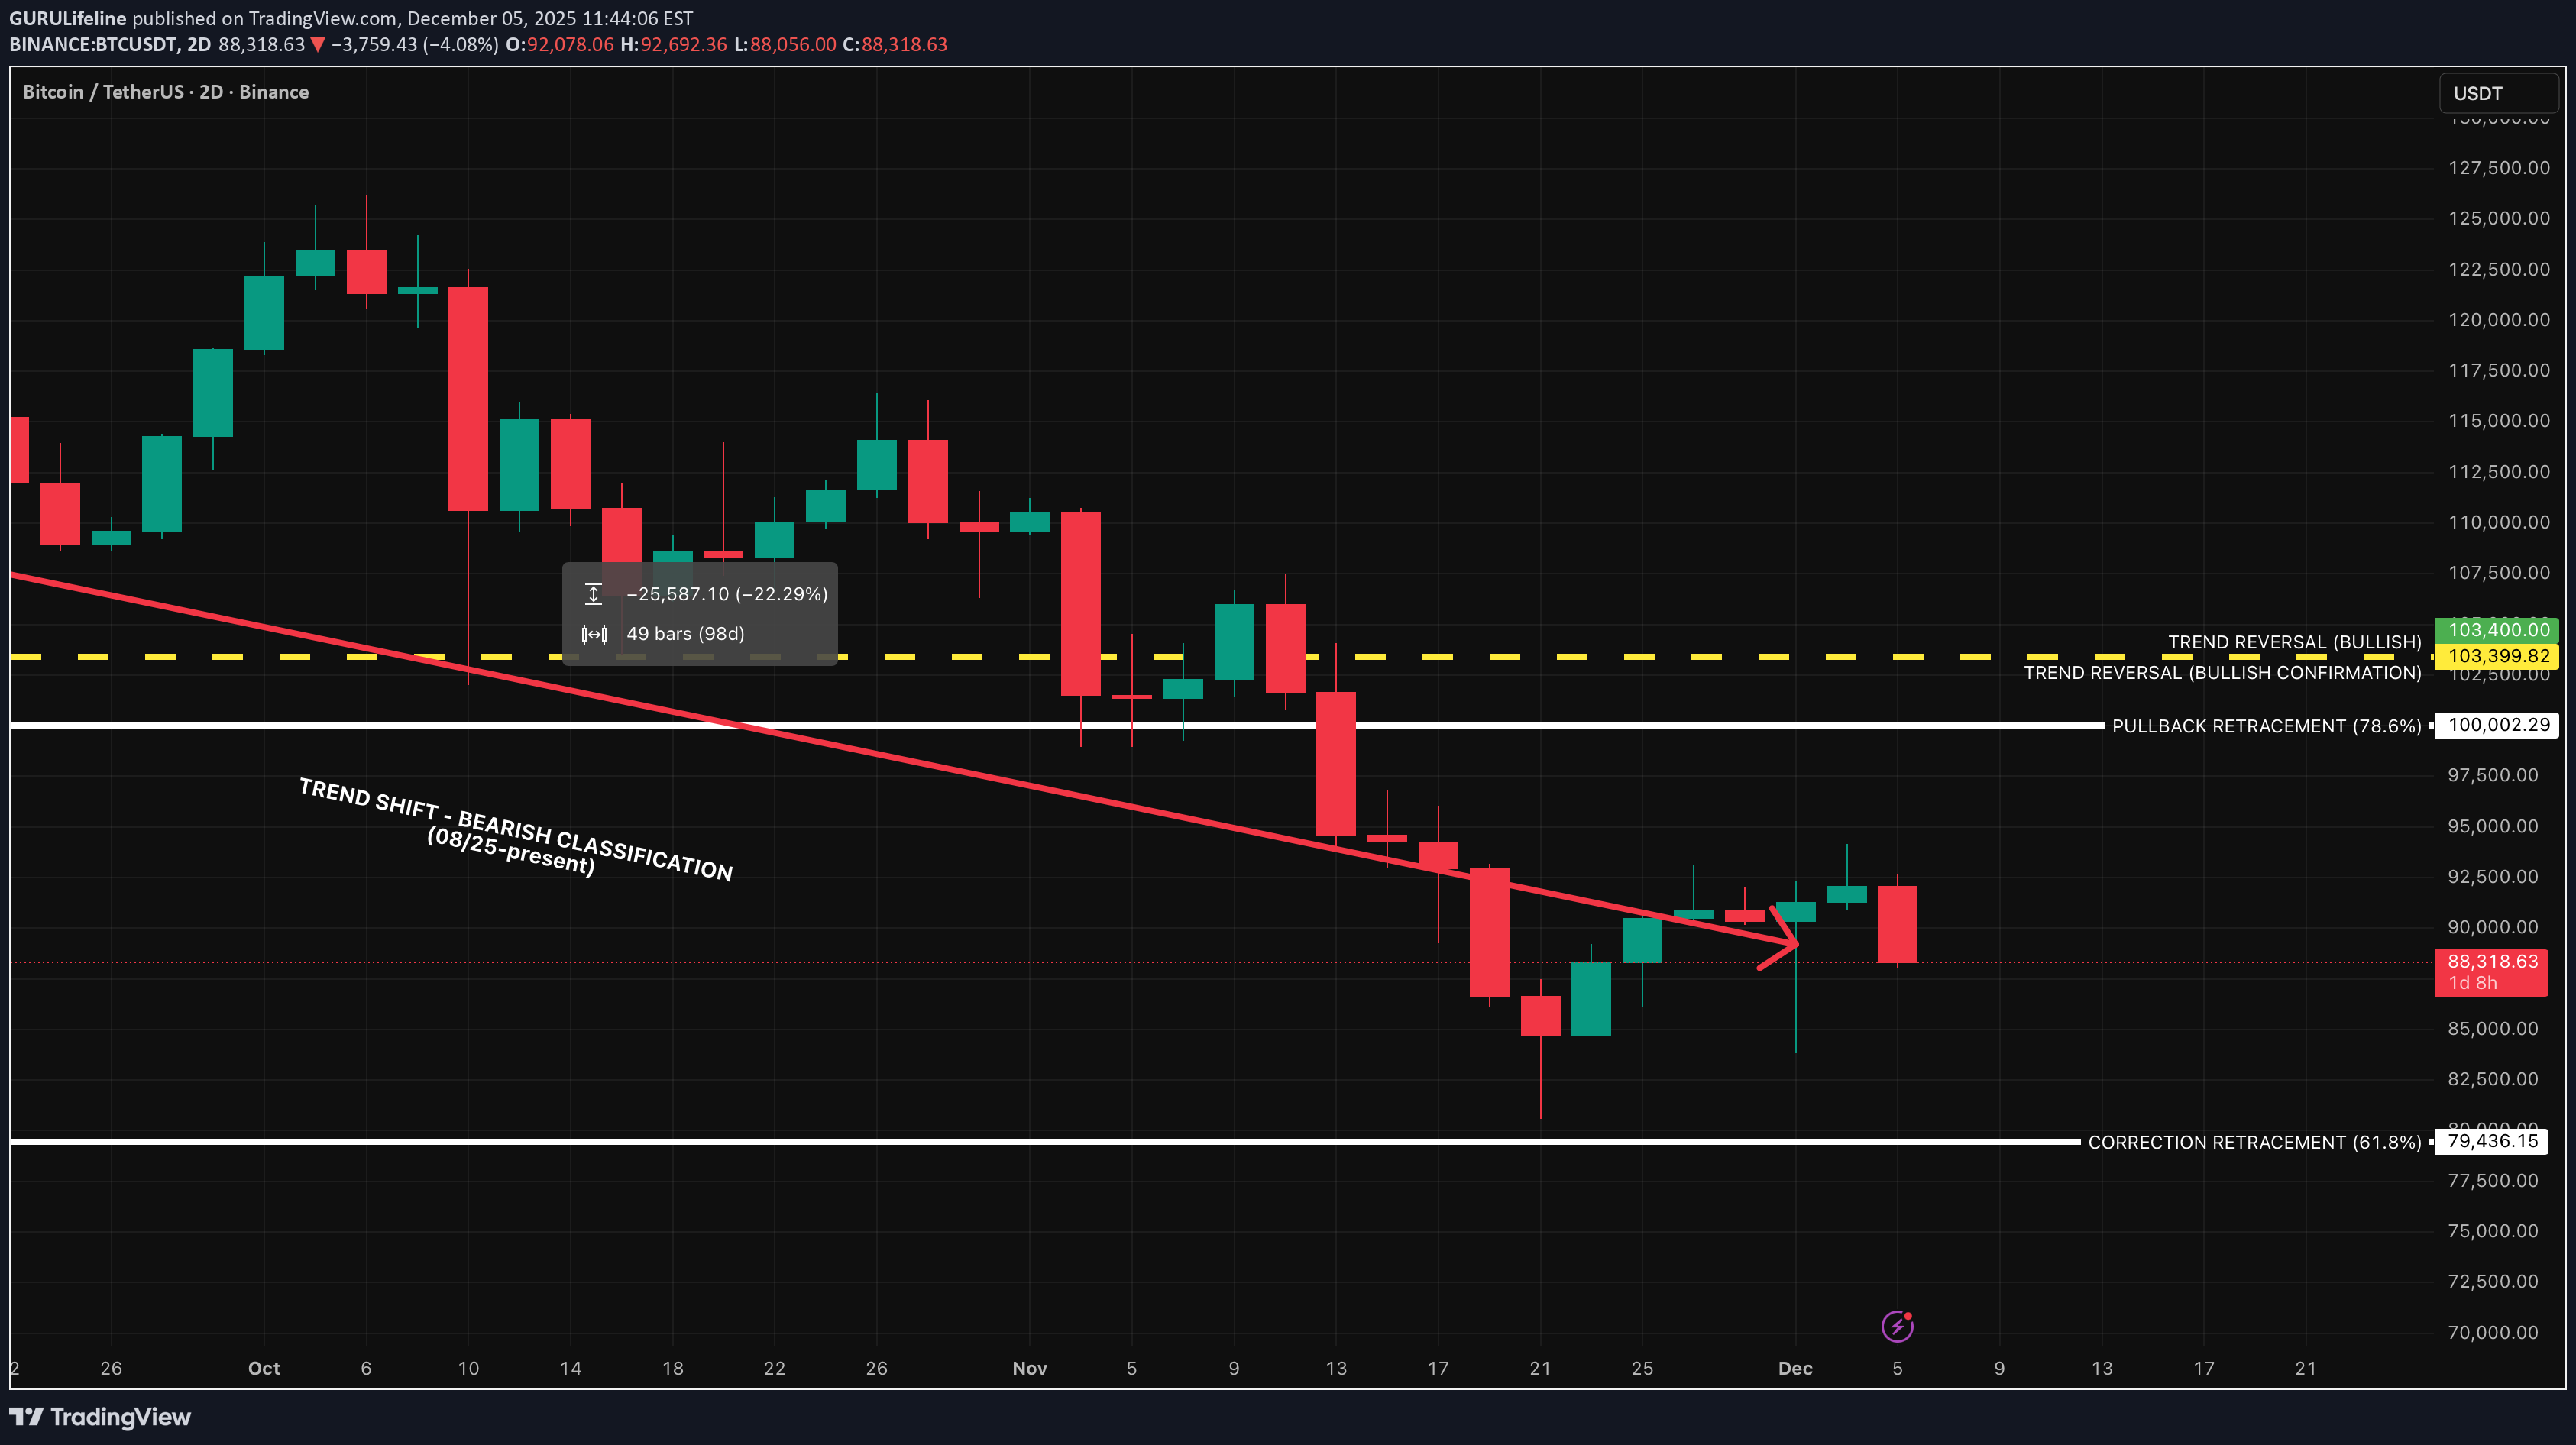
BTC — [2D] WEEK 49 TREND REPORT | 12/05/2025 Ticker: BTCUSDT Timeframe: 2D This is a reactive structural classification of BTC based on the weekly chart as of this timestamp. Price conditions are evaluated as they stand — nothing here is predictive or forward-assumptive. ⸻ 1) Current Trend Condition [ Numbers to Watch ] Current Price @ 89,200 • Trend Duration @ +98 Days ( Bullish ) [-22.29%] • Trend Reversal Level ( Bullish ) @ 103,400 • Trend Reversal Level ( Bullishh Confirmation ) @ 103,400 • Pullback Support @ 100,002 • Correction Support @ 79,436 ⸻ 2) Structure Health • Retracement Phase: Correction (approaching 61.8%) • Position Status: Unstable (price below both structural layers) ⸻ 3) Temperature : Cooling Phase ⸻ 4) Momentum : Bearish ⸻ Author’s Note DOWNWARD STRUCTURAL ALIGNMENT This mark identifies a moment where the market showed clearer alignment with downside direction. It does not predict future movement, but acknowledges where weakness became more evident within the prevailing structure. Its relevance remains only while price continues to hold beneath key structural boundaries. ⸻ Methodology Overview This classification framework evaluates directional conditions using internal trend-interpretation logic that references price behavior relative to its structural layers. These relationships are used to identify when price movement aligns with the framework’s criteria for directional phases, transition points, or regime shifts. Visual elements or structural labels reflect these internal interpretations, rather than explicit trading signals or preset indicator crossovers. This framework is observational only and does not imply future outcomes.
تحلیل هفتگی سولانا (SOL/USD): وضعیت فعلی، سطوح کلیدی و روند نزولی ادامه دار
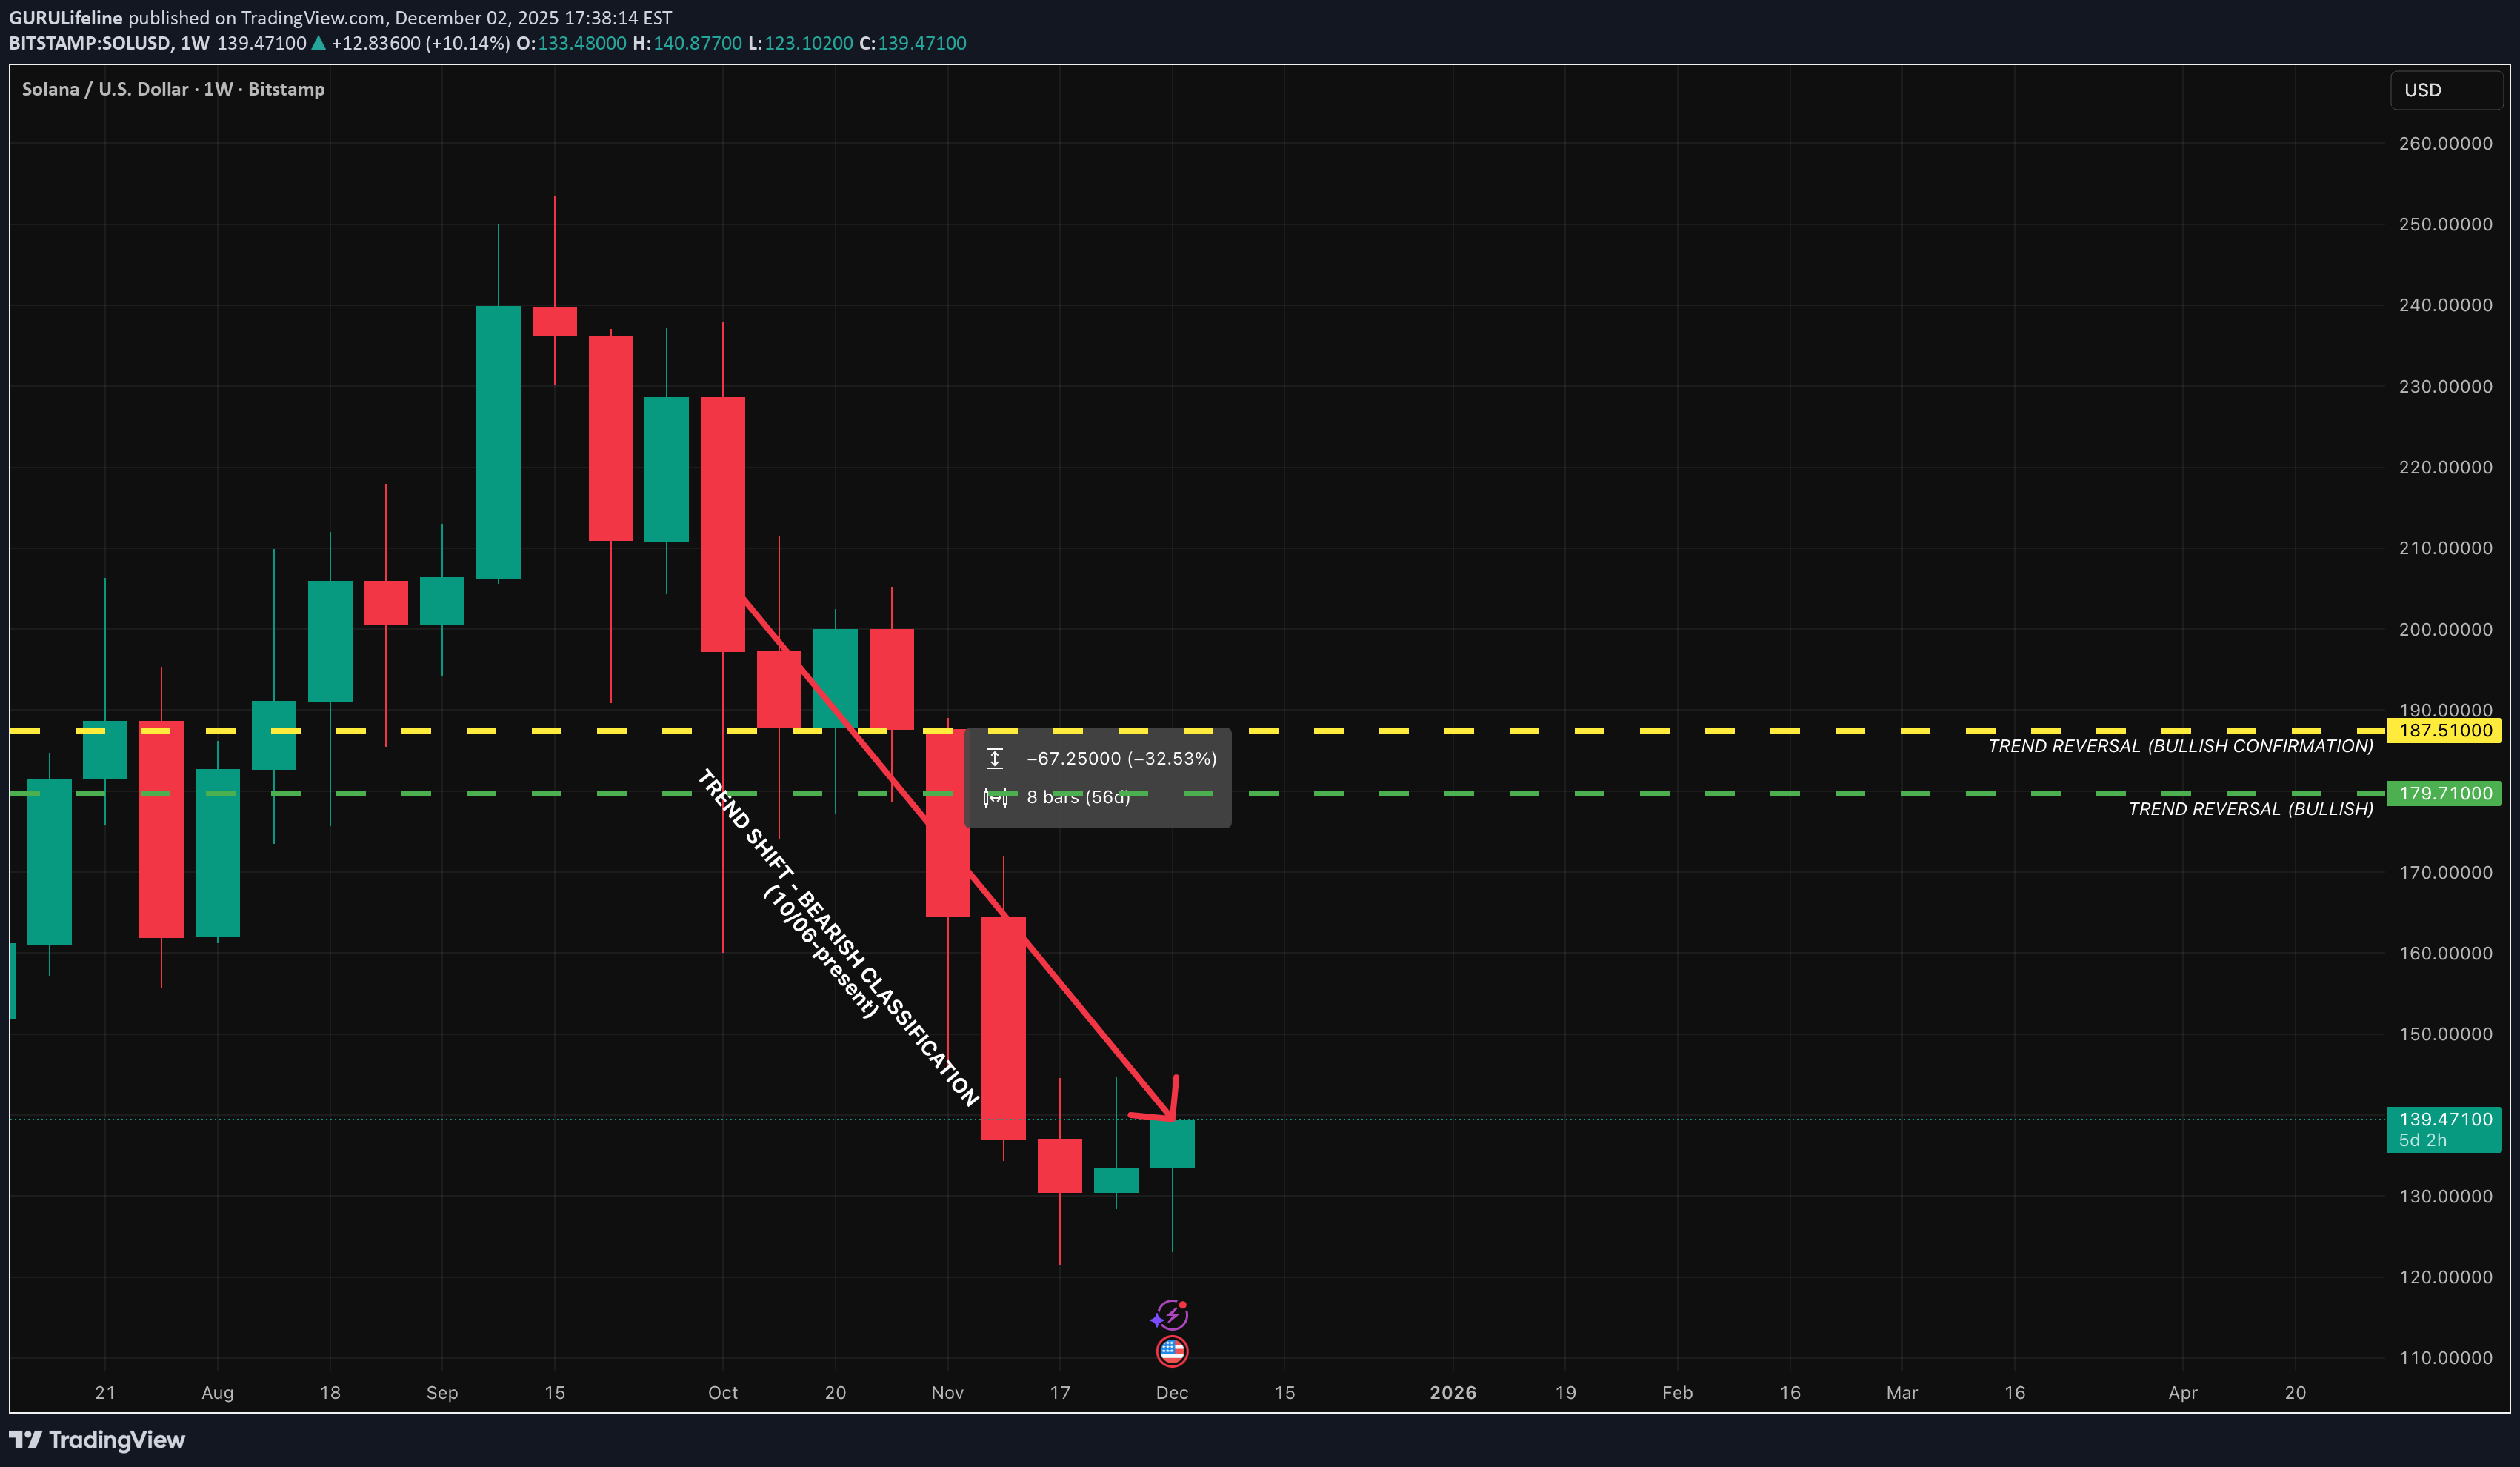
SOLUSD — WEEK 49 TREND REPORT Ticker: SOLUSD — 12/02/2025 @ 139.43$ Timeframe: WEEKLY This is a reactive structural classification of SOL based on the weekly chart as of this timestamp. Price conditions are evaluated as they stand — nothing here is predictive or forward-assumptive. ⸻ 1) Current Trend Condition [Numbers to Watch] • Trend Duration: +8 weeks (Bearish) [-32.53%] • Trend Reversal Level (Bullish): 179.71$ • Trend Reversal Level (Bullish Confirmation): 187.51$ ⸻ 3) Temperature : Cooling Phase ⸻ 4) Momentum : Bearish ⸻ Author’s Note This analysis is fully reactive, not predictive. Market conditions, trend structure, and behavior are classified as they appear in real time. The objective is to identify where directional shifts first occurred, where structural integrity remains intact, and where it would begin to weaken if key levels were breached. Predictive analysis projects outcomes that do not exist yet. Without price confirmation, prediction is built on baseless assumptions. This framework avoids that entirely by responding only to verified structural changes and live conditions. The levels shown simply identify where the current trend structure first shifted and where it would begin to lose integrity if breached. Recognizing these boundaries allows for clearer interpretation of market behavior without relying on forward guarantees, speculative projections, or unsupported assumptions. ⸻ Methodology Overview This classification framework evaluates directional conditions using internal trend-interpretation logic that references price behavior relative to its structural layers. These relationships are used to identify when price movement aligns with the framework’s criteria for directional phases, transition points, or regime shifts. Visual elements or structural labels reflect these internal interpretations, rather than explicit trading signals or preset indicator crossovers. This framework is observational only and does not imply future outcomes.
تحلیل هفتگی XRP: آیا روند نزولی ادامه دارد؟ (هفته 49)
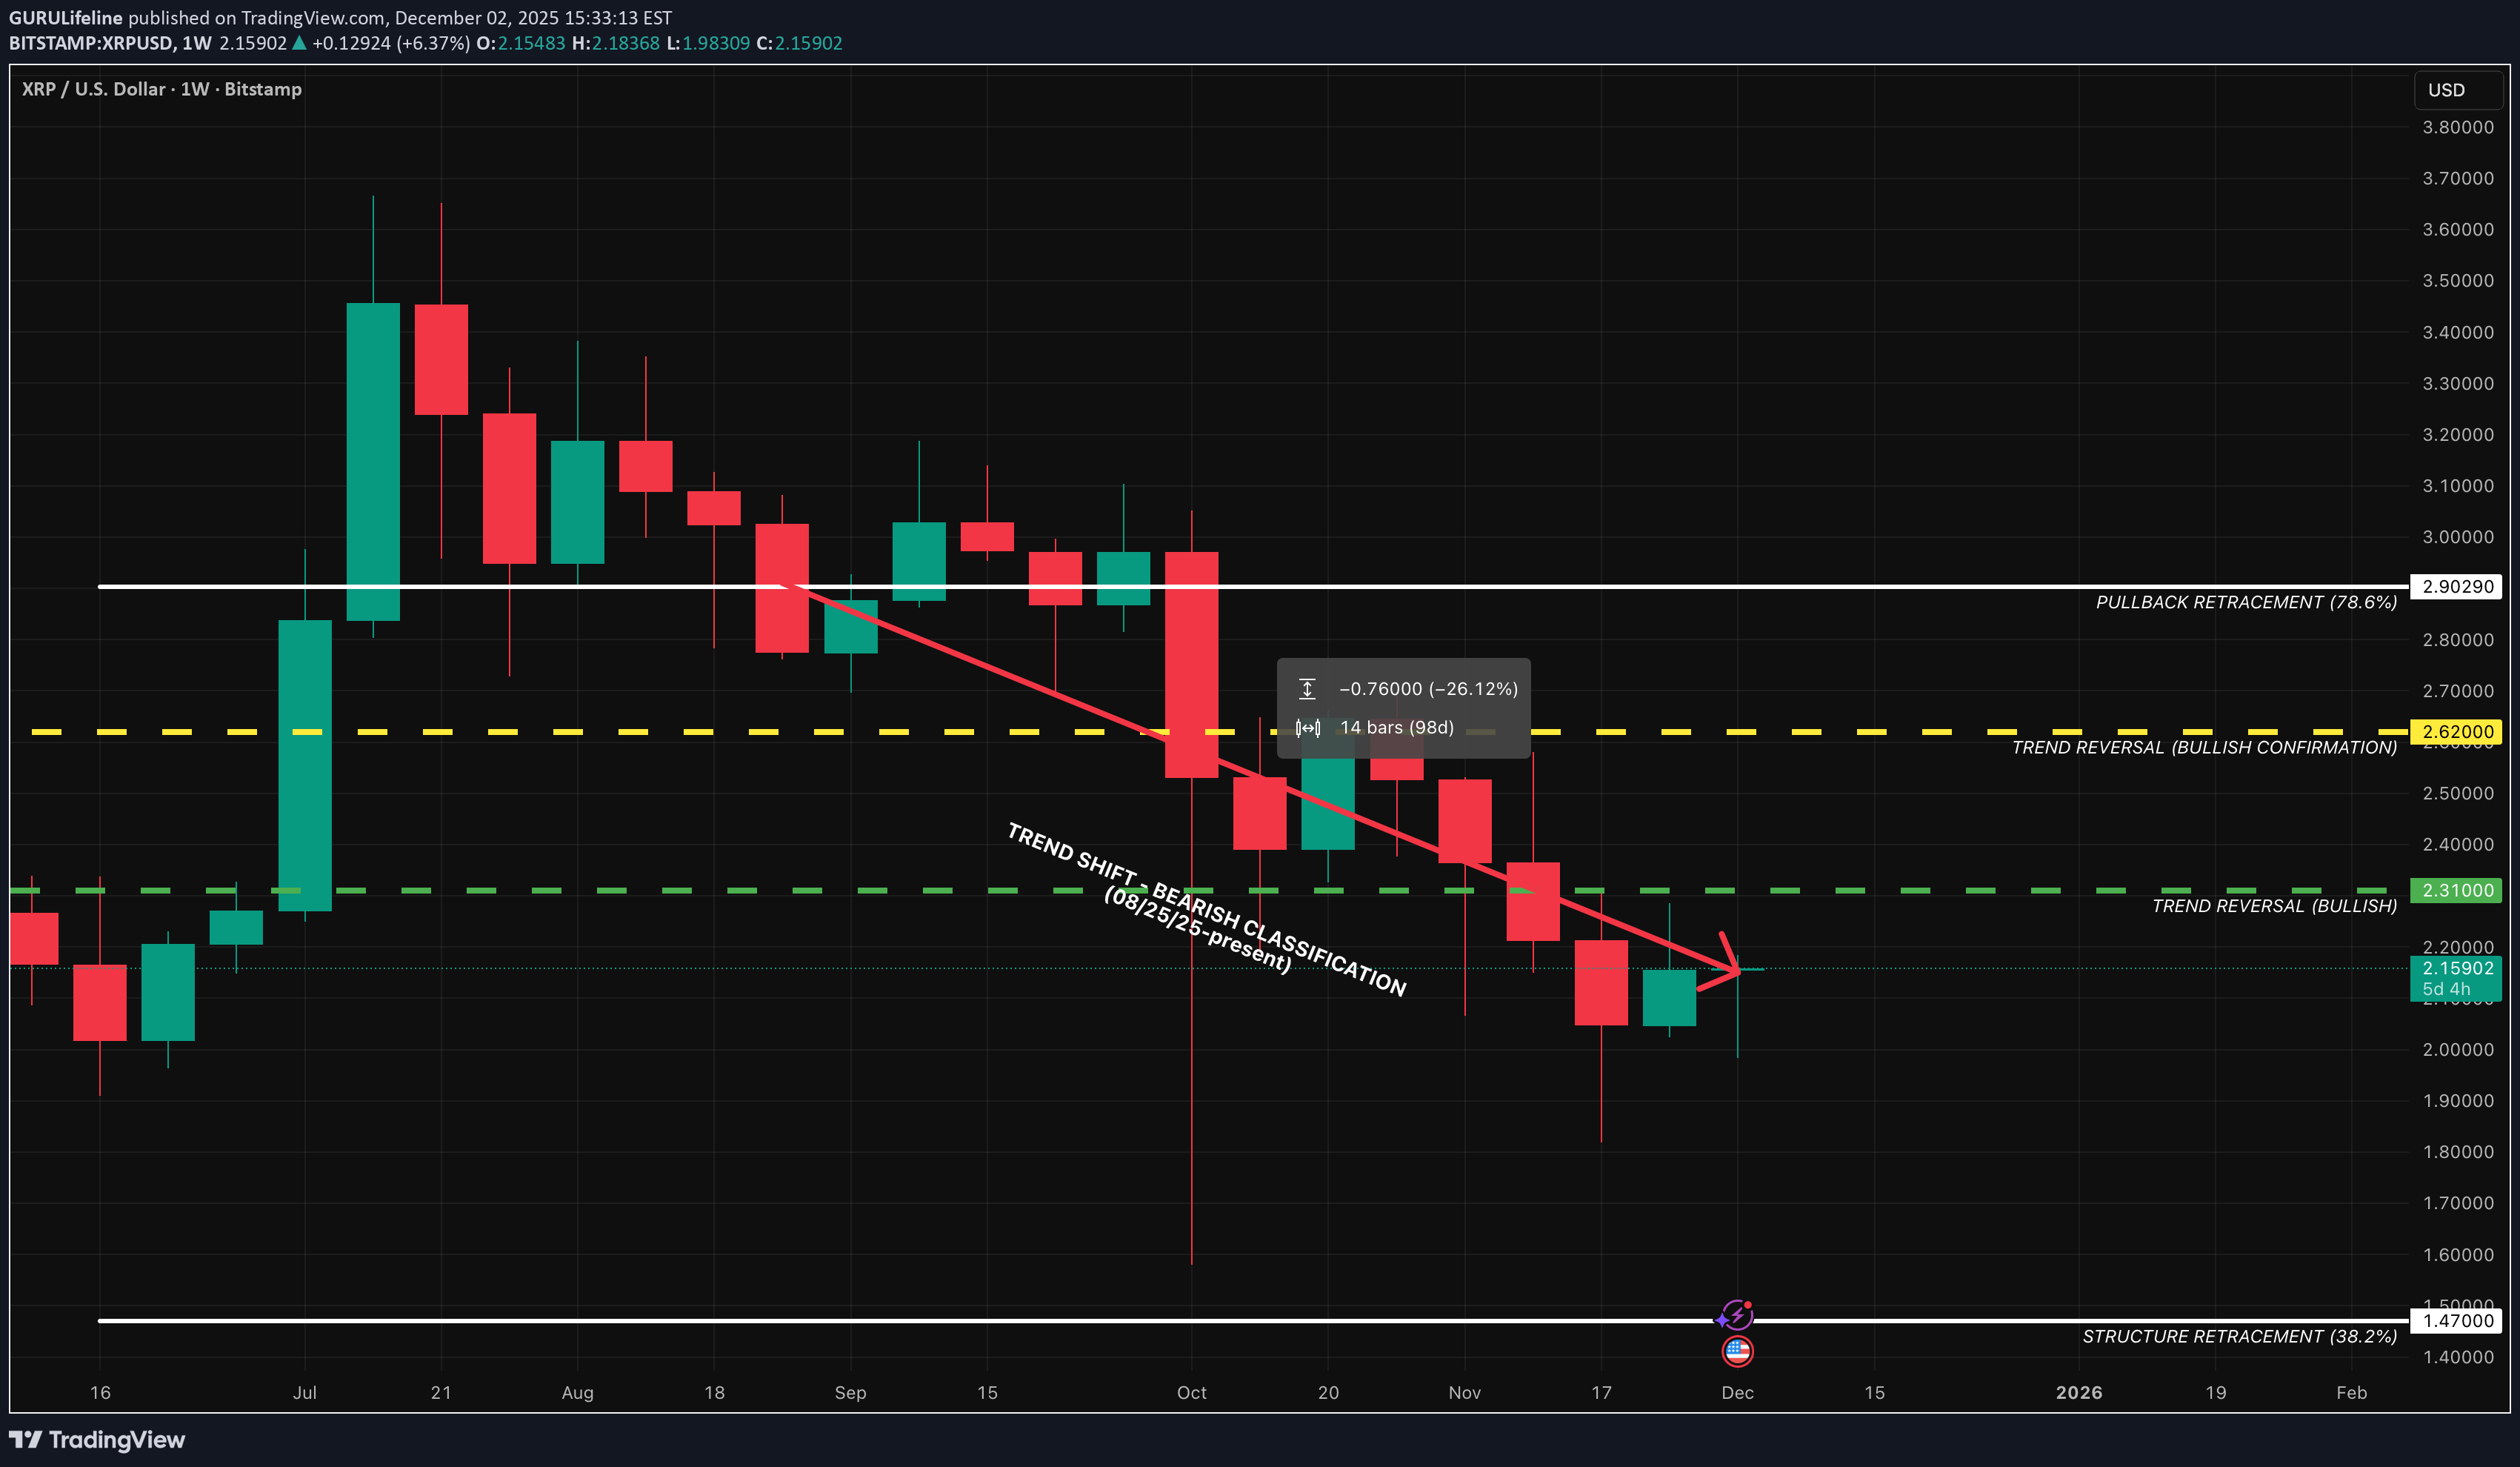
XRP — WEEK 49 TREND REPORT Ticker: XRPUSD — 12/02/2025 @ 2.15$ Timeframe: WEEKLY This is a reactive structural classification of XRP based on the weekly chart as of this timestamp. Price conditions are evaluated as they stand — nothing here is predictive or forward-assumptive. ⸻ 1) Current Trend Condition [Numbers to Watch] • Trend Duration: +14 weeks (Bearish) • Trend Reversal Level (Bullish): 2.31$ • Trend Reversal Level (Bullish Confirmation): 2.62$ • Pullback Support: 2.90$ • Structural Support: 1.47$ ⸻ 2) Structure Health • Retracement Phase: Testing Structure (approaching 38.2%) • Position Status: Unstable (price below both structural layers) ⸻ 3) Temperature Cooling Phase ⸻ 4) Momentum Bearish ⸻ Author’s Note This analysis is fully reactive, not predictive. Market conditions, trend structure, and behavior are classified as they appear in real time. The objective is to identify where directional shifts first occurred, where structural integrity remains intact, and where it would begin to weaken if key levels were breached. Predictive analysis projects outcomes that do not exist yet. Without price confirmation, prediction is built on baseless assumptions. This framework avoids that entirely by responding only to verified structural changes and live conditions. The levels shown simply identify where the current trend structure first shifted and where it would begin to lose integrity if breached. Recognizing these boundaries allows for clearer interpretation of market behavior without relying on forward guarantees, speculative projections, or unsupported assumptions. ⸻ Methodology Overview This classification framework evaluates directional conditions using internal trend-interpretation logic that references price behavior relative to its structural layers. These relationships are used to identify when price movement aligns with the framework’s criteria for directional phases, transition points, or regime shifts. Visual elements or structural labels reflect these internal interpretations, rather than explicit trading signals or preset indicator crossovers. This framework is observational only and does not imply future outcomes.
تحلیل هفتگی بیت کوین: وضعیت کنونی روند، سطوح کلیدی و ریسک ریزش (هفته 49)
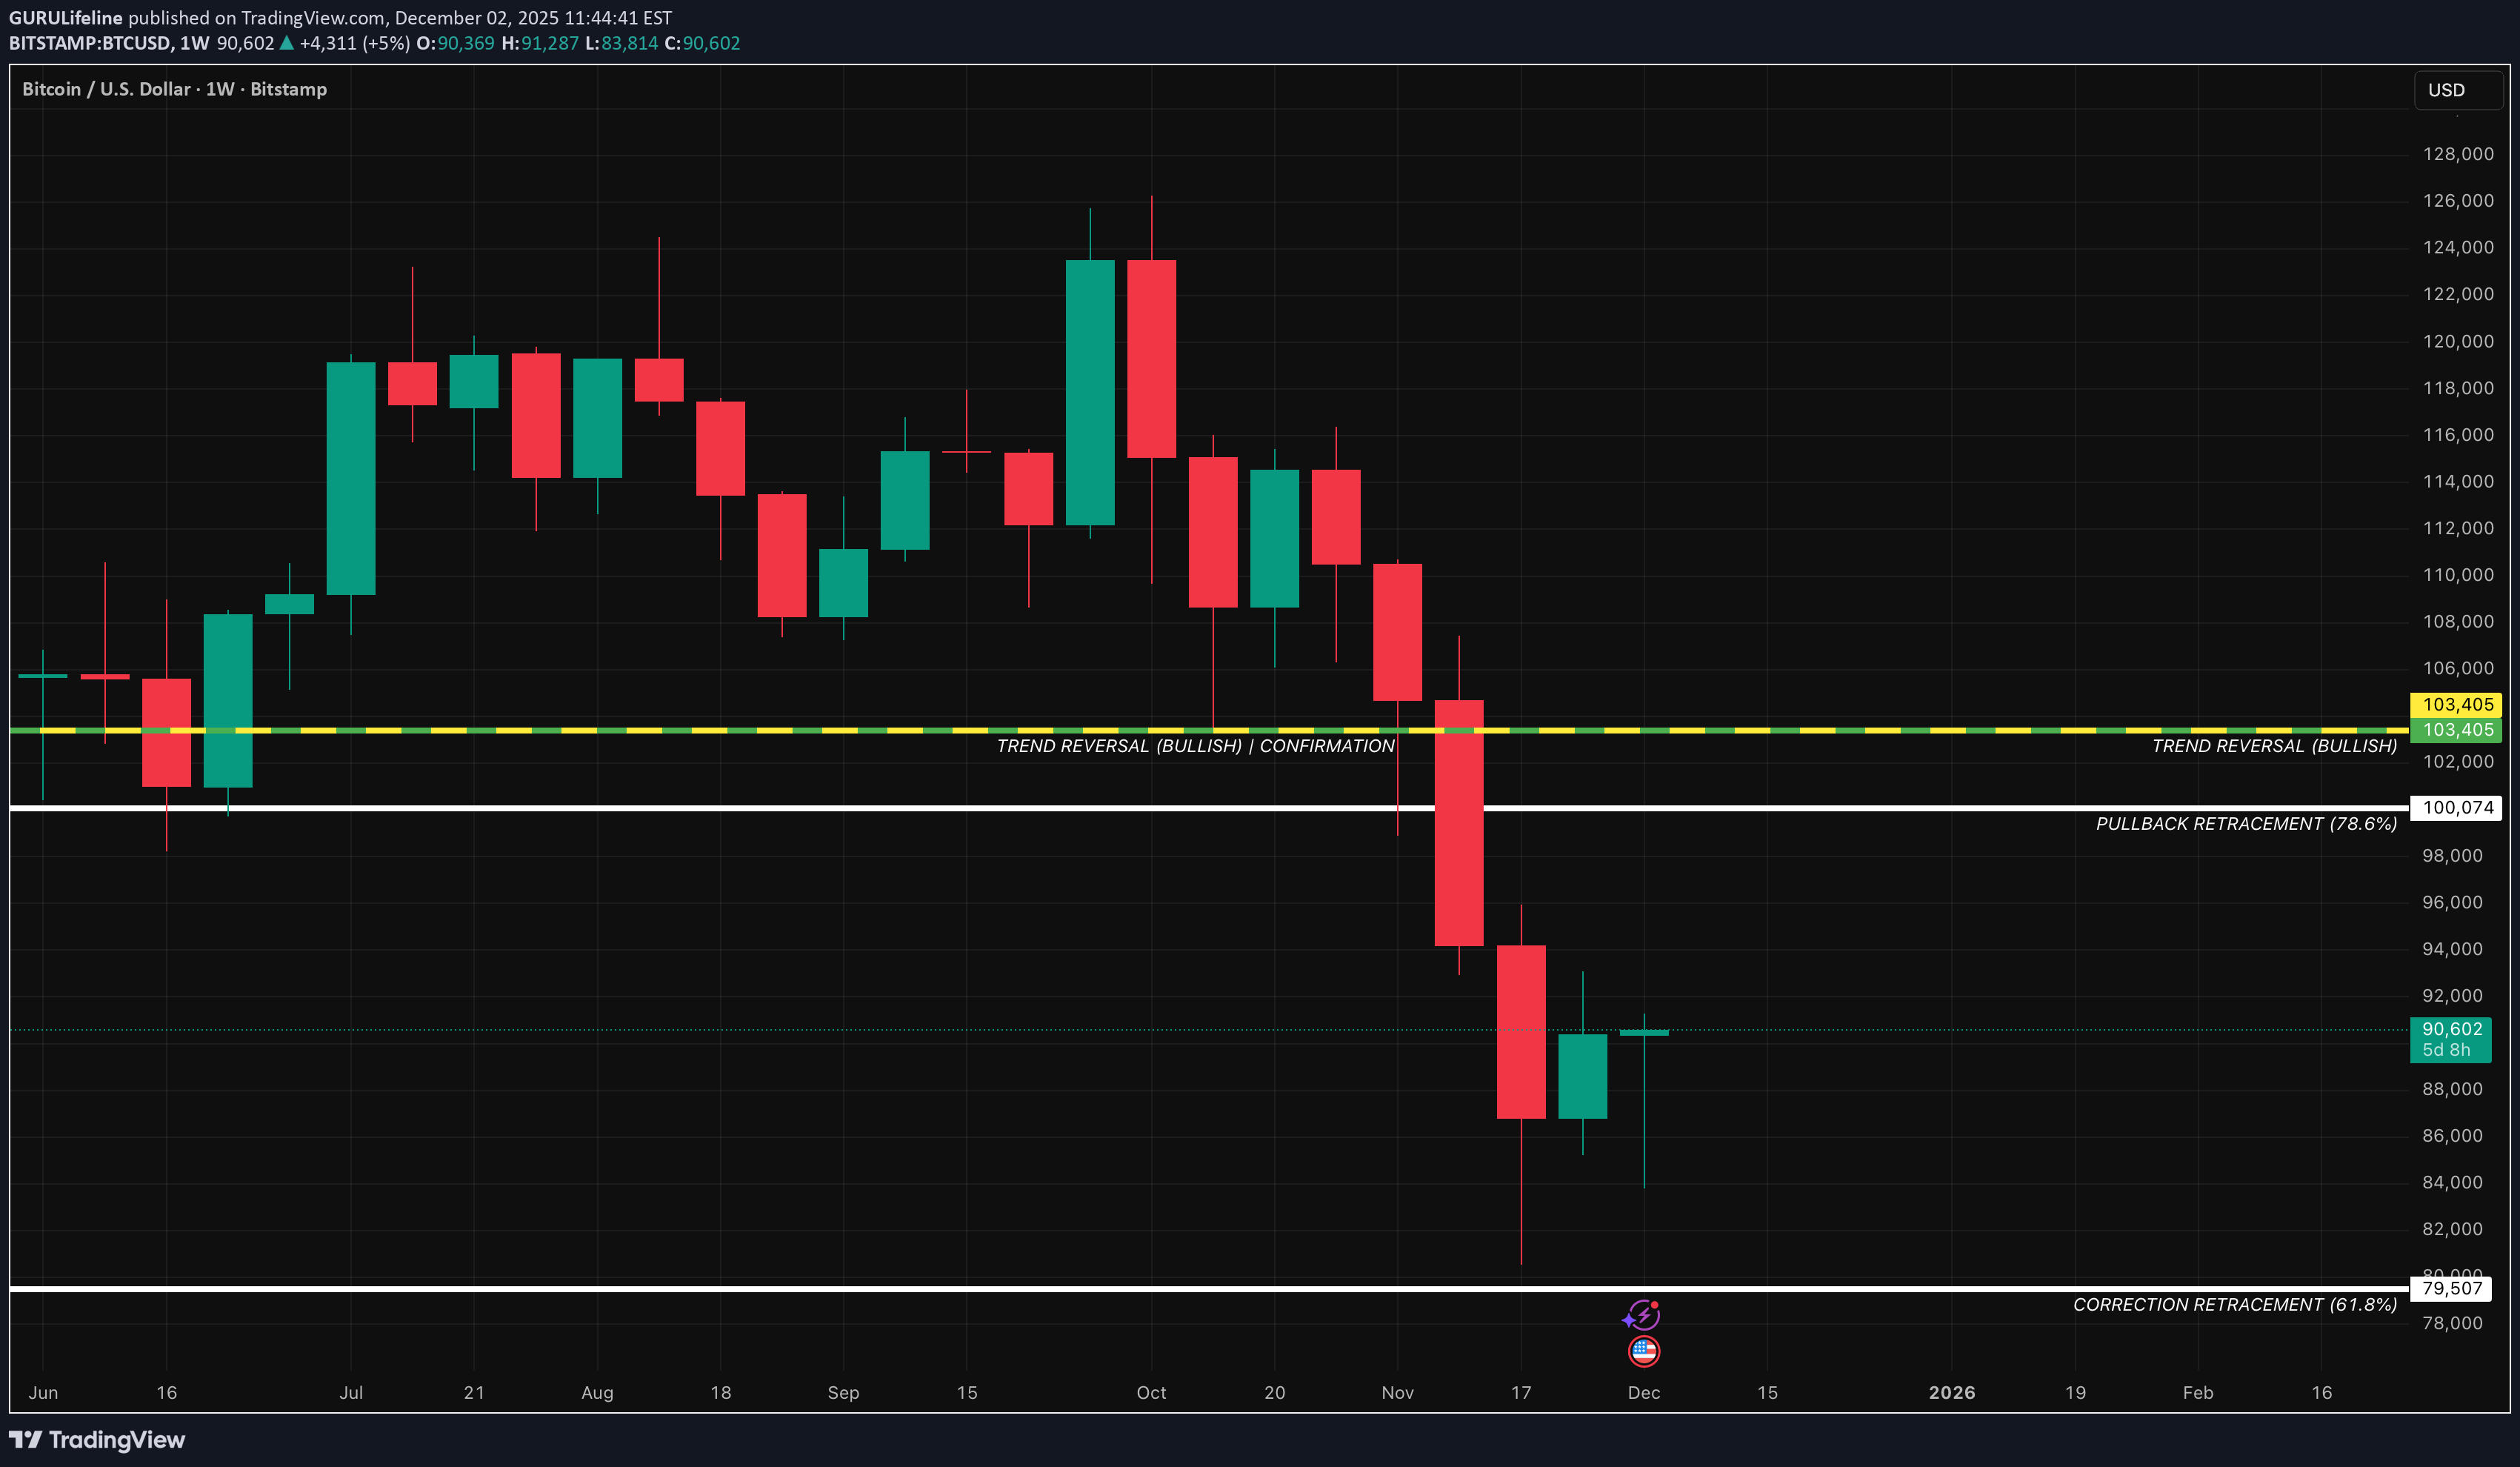
BTC — WEEK 49 TREND REPORT Ticker: BTCUSD — 12/02/2025 @ 90,800 Timeframe: WEEKLY This is a reactive structural classification of BTCUSD based on the weekly chart as of this timestamp. Price conditions are evaluated as they stand — nothing here is predictive or forward-assumptive. ⸻ 1) Current Trend Condition [Numbers to Watch] • Trend Duration: +9 weeks (bearish) • Trend Reversal Level (Bullish): 103404.5$ • Trend Reversal Level (Bullish)( [I]Confirmation ): 103405$ • Pullback Support: 100,074$ • Correction Support: 79,507$ ⸻ 2) Structure Health • Retracement Phase: Correction (approaching 61.8%) • Position Status: Unstable (price below both structural layers) ⸻ 3) Temperature: • Cooling Phase ⸻ 4) Momentum : • Bearish ⸻ Author’s Note This analysis is fully reactive, not predictive. Market conditions, trend structure, and behavior are classified as they appear in real time. The objective is to identify where directional shifts first occurred, where structural integrity remains intact, and where it would begin to weaken if key levels were breached. Predictive analysis projects outcomes that do not exist yet. Without price confirmation, prediction is built on baseless assumptions. This framework avoids that entirely by responding only to verified structural changes and live conditions. The levels shown simply identify where the current trend structure first shifted and where it would begin to lose integrity if breached. Recognizing these boundaries allows for clearer interpretation of market behavior without relying on forward guarantees, speculative projections, or unsupported assumptions. ⸻ Methodology Overview This classification framework evaluates directional conditions using internal trend-interpretation logic that references price behavior relative to its structural layers. These relationships are used to identify when price movement aligns with the framework’s criteria for directional phases, transition points, or regime shifts. Visual elements or structural labels reflect these internal interpretations, rather than explicit trading signals or preset indicator crossovers. This framework is observational only and does not imply future outcomes.
تحلیل ساختاری XRP: آیا قیمت ریپل به سطح بحرانی 1.64 دلار نزدیک میشود؟ (گزارش هفتگی)
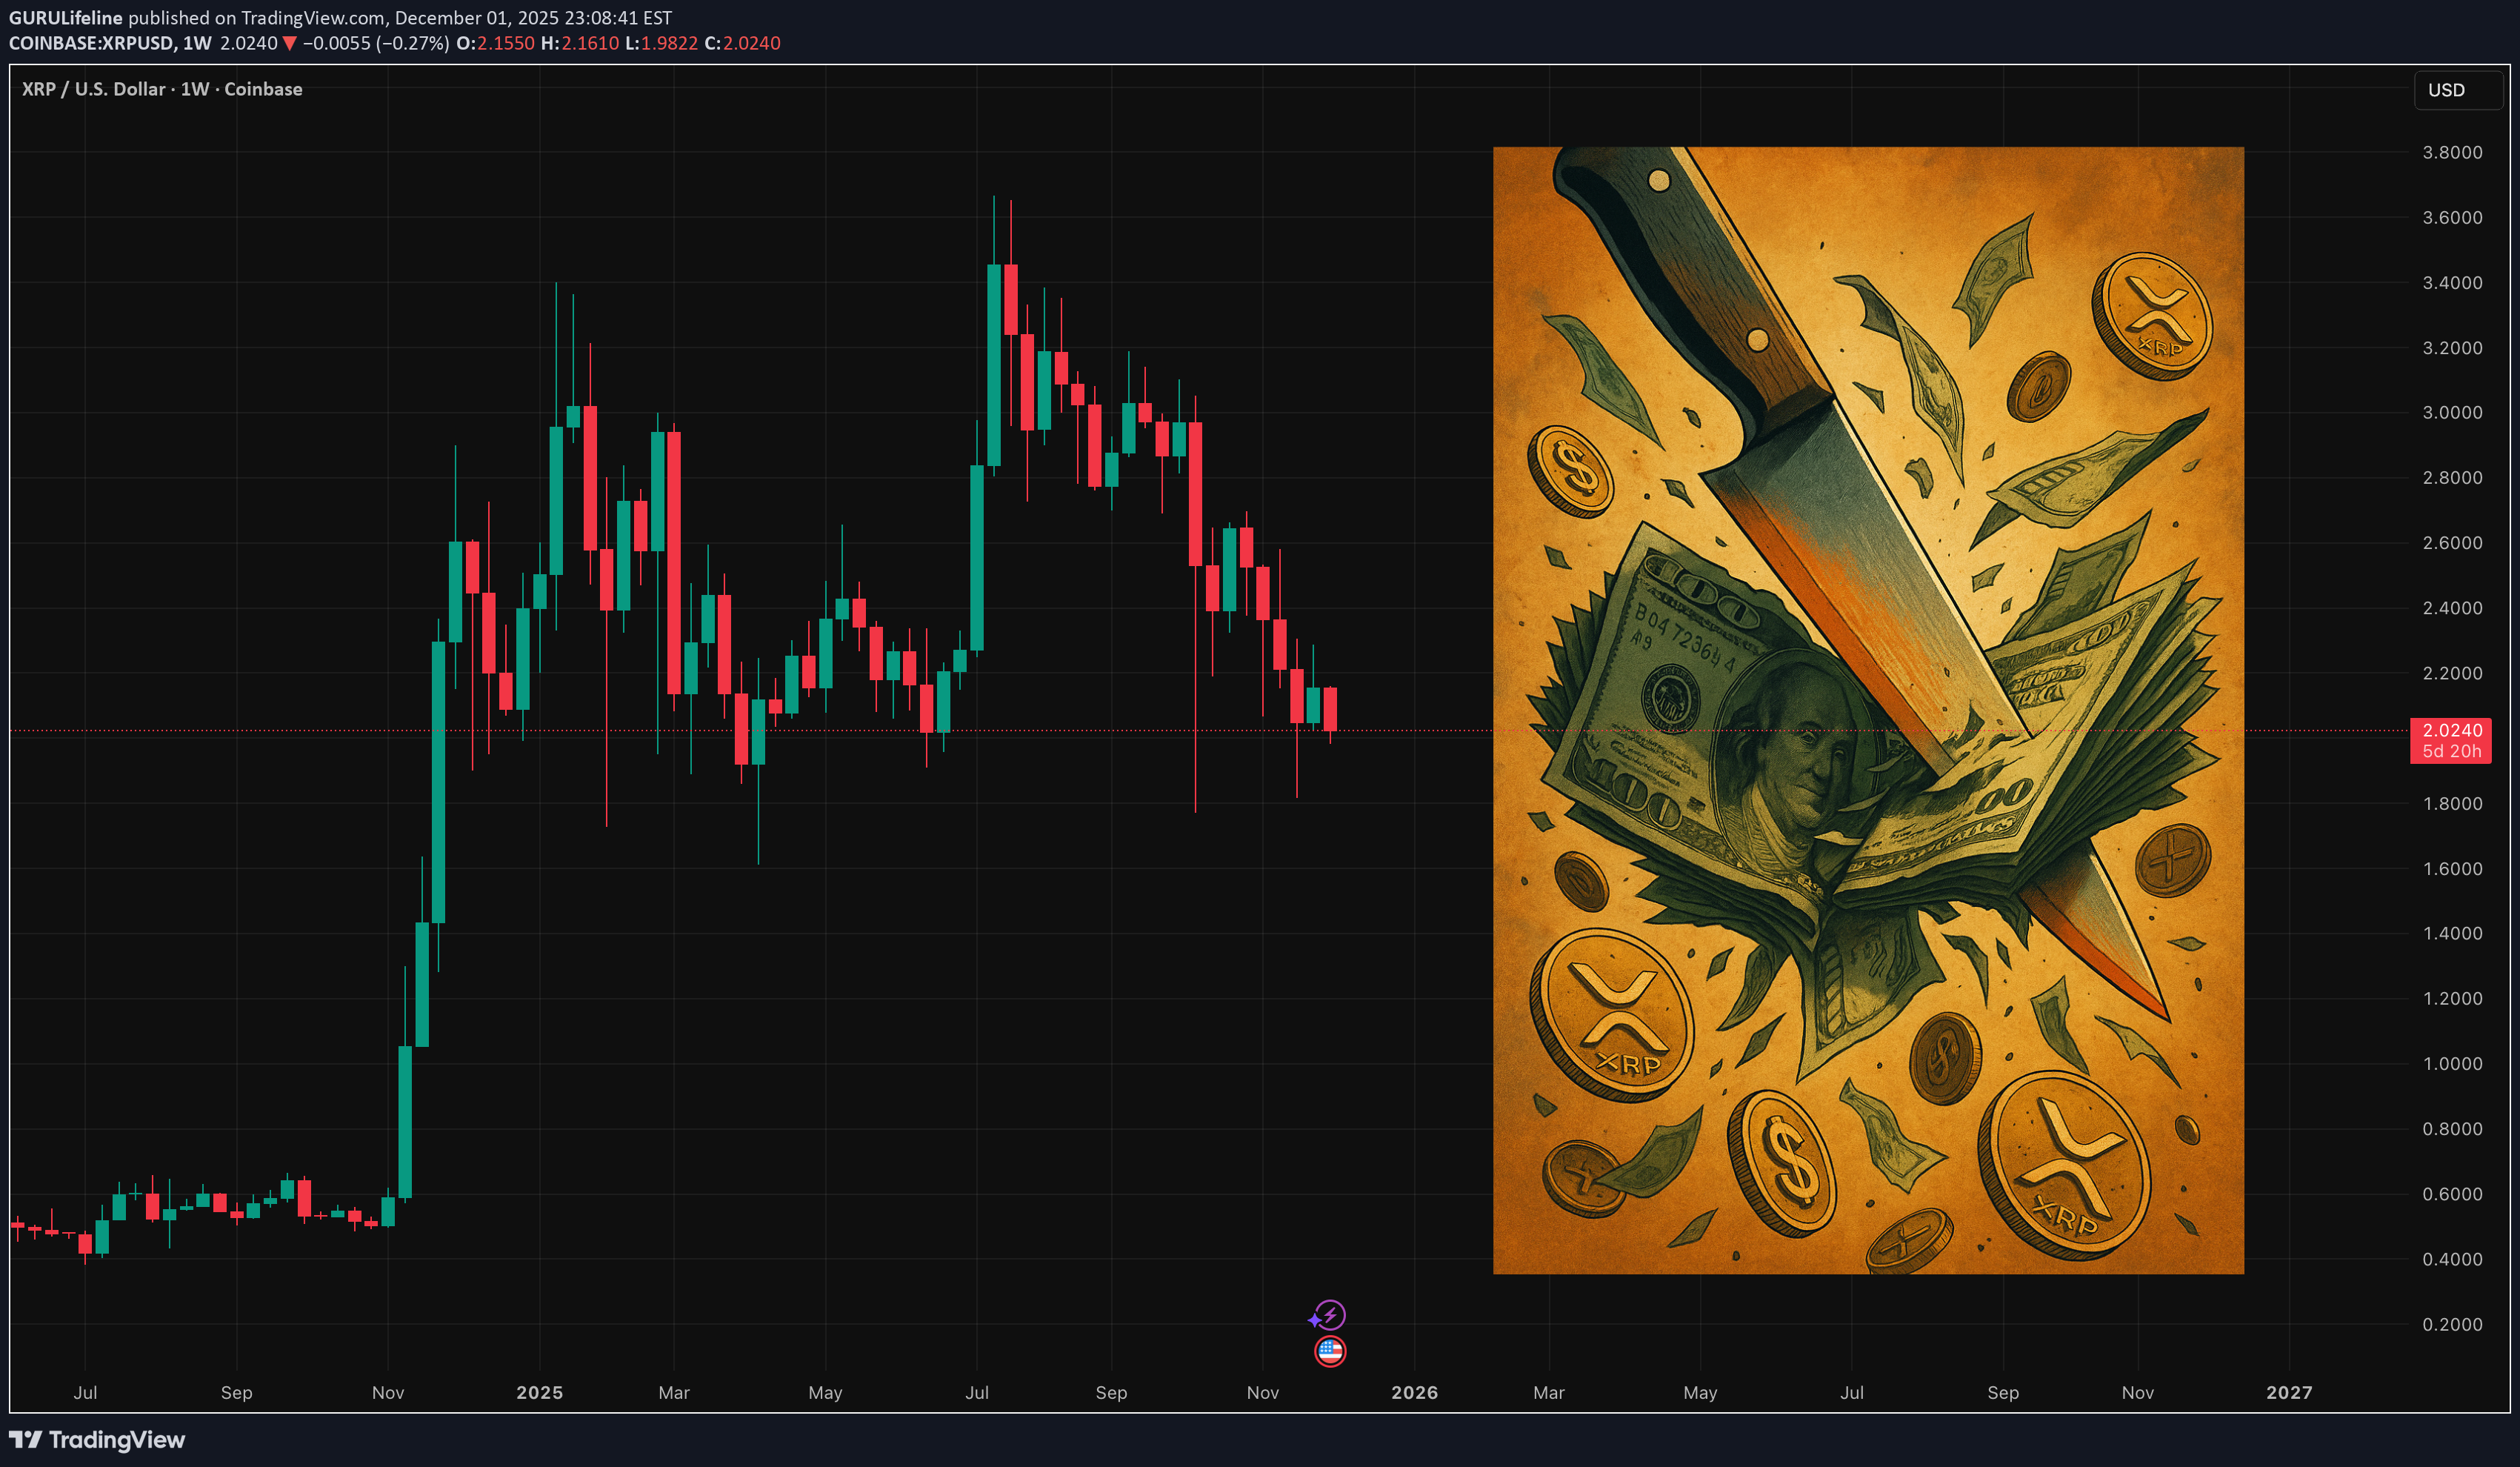
XRP — WEEK 49 TREND REPORT Ticker: XRPUSD XRPUSD — 12/01/2025 @ 2.02$ Timeframe: 2D This is a reactive structural classification of XRPUSD based on the 2D chart as of this timestamp. Price conditions are evaluated as they stand — nothing here is predictive or forward-assumptive. ⸻ 1) Current Trend Condition • Trend Duration: +3 BARS (bearish) • Trend Reversal Level: 2.06$ • Trend Reversal Level ( Confirmation ): 2.26$ ⸻ 2) Structure Health • Retracement Phase: • Testing Structure (approaching 38.2% @ 1.64$) • Position Status: • Unstable (price below both structural layers) ⸻ 3) Temperature: Cooling Phase ⸻ 4) Momentum: Bearish ⸻ Author’s Note This analysis is fully reactive, not predictive. Market conditions, trend structure, and behavior are classified as they appear in real time. The objective is to identify where directional shifts first occurred, where structural integrity remains intact, and where it would begin to weaken if key levels were breached. Predictive analysis projects outcomes that do not exist yet. Without price confirmation, prediction is built on baseless assumptions. This framework avoids that entirely by responding only to verified structural changes and live conditions. The levels shown simply identify where the current trend structure first shifted and where it would begin to lose integrity if breached. Recognizing these boundaries allows for clearer interpretation of market behavior without relying on forward guarantees, speculative projections, or unsupported assumptions. ⸻ Methodology Overview This classification framework evaluates directional conditions using internal trend-interpretation logic that references price behavior relative to its structural layers. These relationships are used to identify when price movement aligns with the framework’s criteria for directional phases, transition points, or regime shifts. Visual elements or structural labels reflect these internal interpretations, rather than explicit trading signals or preset indicator crossovers. This framework is observational only and does not imply future outcomes.
Disclaimer
Any content and materials included in Sahmeto's website and official communication channels are a compilation of personal opinions and analyses and are not binding. They do not constitute any recommendation for buying, selling, entering or exiting the stock market and cryptocurrency market. Also, all news and analyses included in the website and channels are merely republished information from official and unofficial domestic and foreign sources, and it is obvious that users of the said content are responsible for following up and ensuring the authenticity and accuracy of the materials. Therefore, while disclaiming responsibility, it is declared that the responsibility for any decision-making, action, and potential profit and loss in the capital market and cryptocurrency market lies with the trader.