
ForexTrader4all
@t_ForexTrader4all

What symbols does the trader recommend buying?
Purchase History
پیام های تریدر
Filter
ForexTrader4all
XAUUSD - A Dip before next ATH
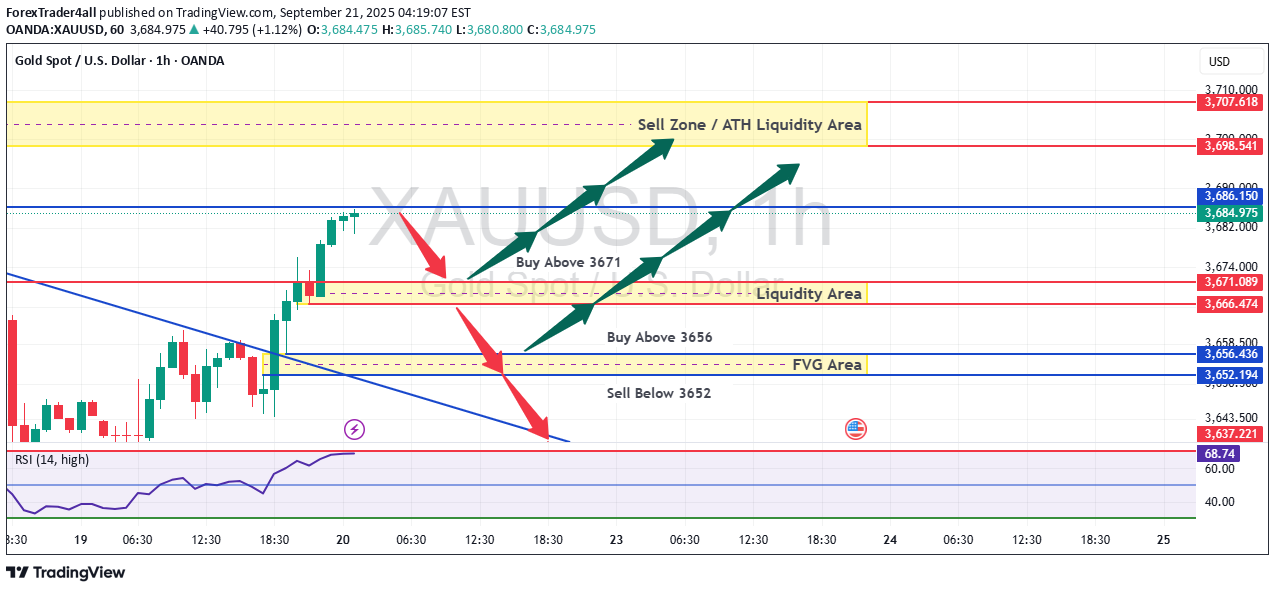
Overall Trend: Bullish with Consolidation at Highs The primary, long-term trend for XAUUSD is decisively bullish. This is evident from the fact that the price is trading near its All-Time High (ATH) liquidity area at 3,684.975. The chart notes the price is up +40.795 (+1.12%), confirming recent upward momentum. However, the price action shows it is currently in a phase of consolidation or pullback from these extreme highs. The key question is whether this is a minor pause before continuing higher or the beginning of a larger correction. Key Technical Levels & Areas 1. Resistance (Sell Zone / ATH) ATH Liquidity Area: 3,684.975 This is the absolute highest point and the strongest resistance. A clean break and close above this level would signal a continuation of the bullish trend towards new uncharted territory. 2. Immediate Support & Demand Zones The chart outlines two primary "Buy" zones, which are clusters of support where buying interest is expected to be strong. Primary Buy Zone (Above 3671): 3,671.062 - 3,682.976 This is the first and most immediate support cluster. The price is currently interacting with this area. A hold above 3,671 could see a bounce back towards the ATH. Secondary Buy Zone (Above 3656): 3,635.200 - 3,647.000 This is a deeper support zone, filled with Fair Value Gaps (FVGs)—areas of imbalanced buying that often get retested. A drop into this area would indicate a stronger pullback but could present a higher probability buying opportunity for a rebound. 3. Critical Support (Bearish Trigger) Sell Trigger Level: Below 3652 This is the most critical level for the bullish thesis. A decisive break and close below 3652 would likely invalidate the immediate bullish structure. It would signal that sellers have taken control, potentially triggering a deeper correction towards lower support levels not visible in this snippet. Momentum Indicator ESI (14, high): 68.74 The Efficient Strength Index reading of 68.74 indicates that the market is in bullish territory (above 50) but is not yet in extreme overbought conditions (often considered above 80). This suggests there is still room for upward movement before the market becomes excessively stretched to the upside. Summary and Outlook Bullish Scenario: Price holds above the 3,671 support zone and uses it as a base to launch another attack on the ATH resistance at 3,685. A break above this level confirms trend continuation. Consolidation Scenario: Price oscillates between the primary support zone (3,671) and the ATH resistance (3,685), building energy for its next major move. Bearish Scenario : Price fails to hold 3,671 and breaks down through the secondary FVG support zone. A break below the 3,652 level would be a strong signal that a short-term top is in place and a deeper pullback is underway. Conclusion: The bias remains cautiously bullish as long as price stays above 3,652. The most probable short-term outcome is continued consolidation between the key support and resistance zones. Traders would be looking for bullish reversal signals (e.g., pin bars, engulfing patterns) within the defined buy zones to enter long positions targeting the ATH. DISCLAIMER- We are not responsible for your losses. Do you own research before entering into the volatile market of XAUUSD
ForexTrader4all
XAUUSD - Holding on Major Resistance Buy/Sell
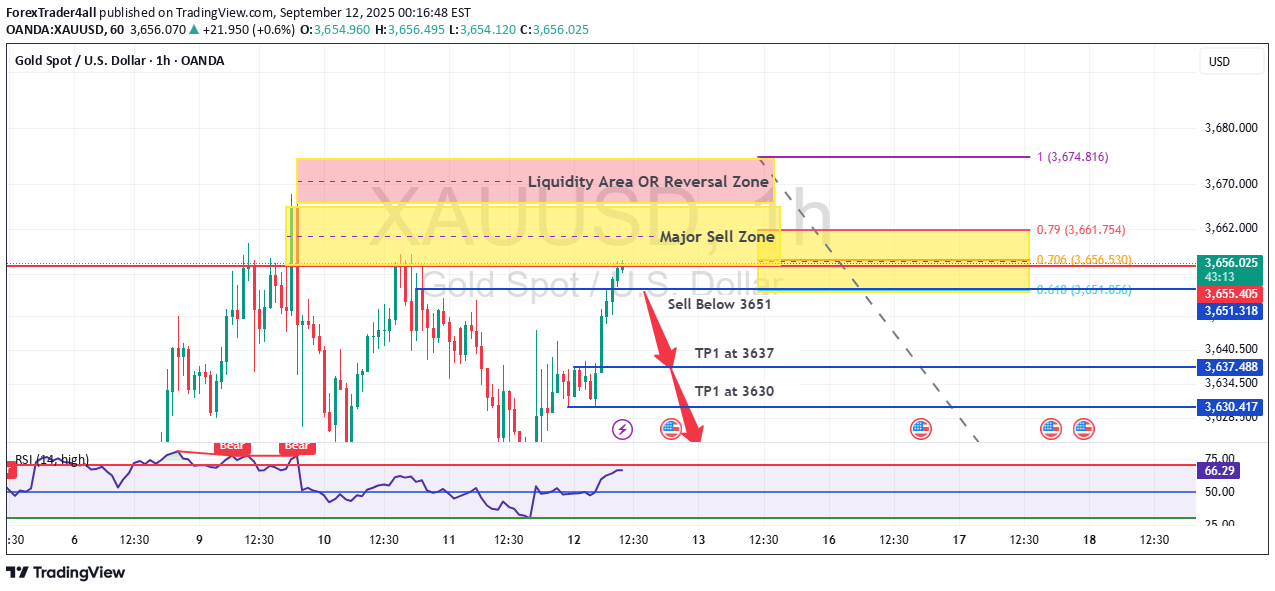
Analysis of XAU/USD (Gold) Chart - Bearish Potential Based on the current chart position for XAU/USD on September 12, 2025, the market structure and indicators point to a strong bearish (downward) potential. Here are the key points supporting this analysis: Prevailing Downtrend: The price action shows the asset is already in a downtrend for the session, trading down approximately -0.58% from its previous close. The current price (63,655.135) is positioned near the lower end of the displayed range. Position Relative to Key Zones: The current price is trading significantly below the identified " Major Sell Zone " and " Liquidity Area OR Reversal Zone ," which are concentrated between approximately 3,674 and 3,680. This suggests the market has already rejected these higher price levels and is moving away from them, confirming the selling pressure. Resistance Levels: Multiple strong resistance levels are stacked above the current price (e.g., 3,662.000, 3,670.000, 3,674.816, 3,680.000). This creates a "ceiling" that could cap any upward attempts and reinforce the bearish outlook. Potential Trade Signal: The chart is explicitly indicating the analysis has issued a sell signal based on its strategy. In summary, the chart evidence strongly suggests a bearish inclination . The price is in a short-term downtrend, resides well below major resistance and sell zones, and is accompanied by an active sell signal. Disclaimer:- We are not responsible for your losses due to this analysis, do your own research or consult your financial advisor to invest in this volatile market
ForexTrader4all
XAUUSD → Correction before a Breakout and Rally
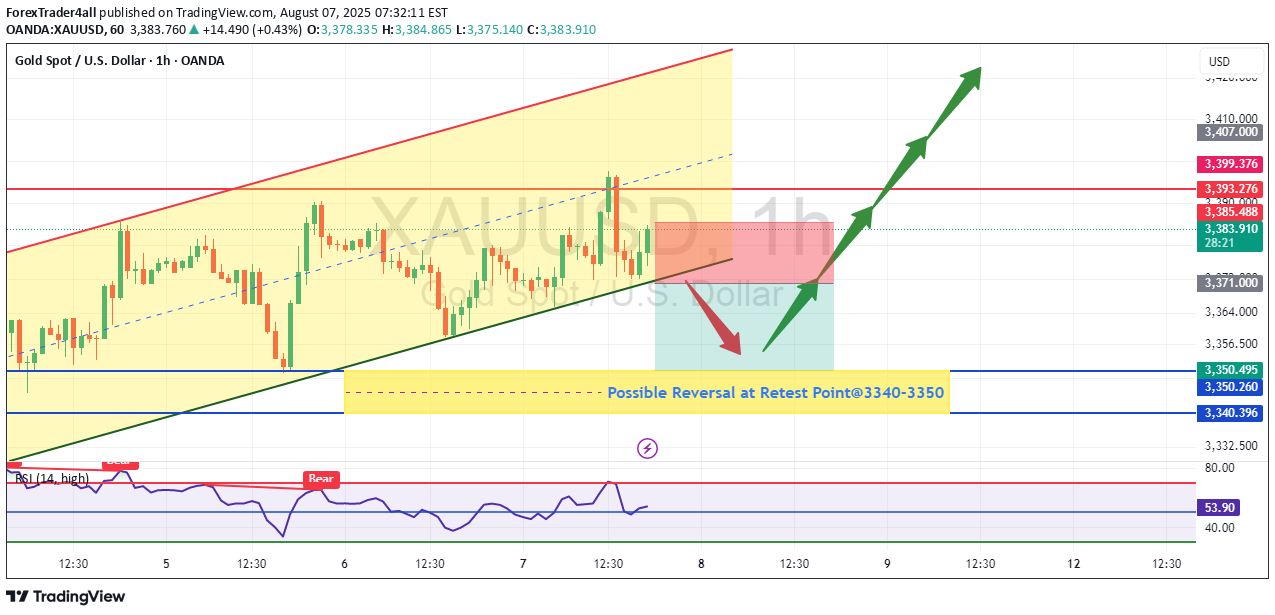
Gold (XAUUSD) is expected to pull back slightly before making a bigger move up. Right now, it’s facing some resistance, so a small drop is likely. But the long-term trend remains bullish due to factors like possible Fed rate cuts and global uncertainty. After this correction, gold could break higher. Traders should watch for buying opportunities near support levels. The strategy is to "buy the dip" for a potential rally later. Read the chart for entry and exit points Do your own research before making any decision of Buying or selling trade in gold as market is more volatile... This is not a financial advise to trade and this is just an educational purposes
ForexTrader4all
XAUUSD - Retesting 3400 before Decline
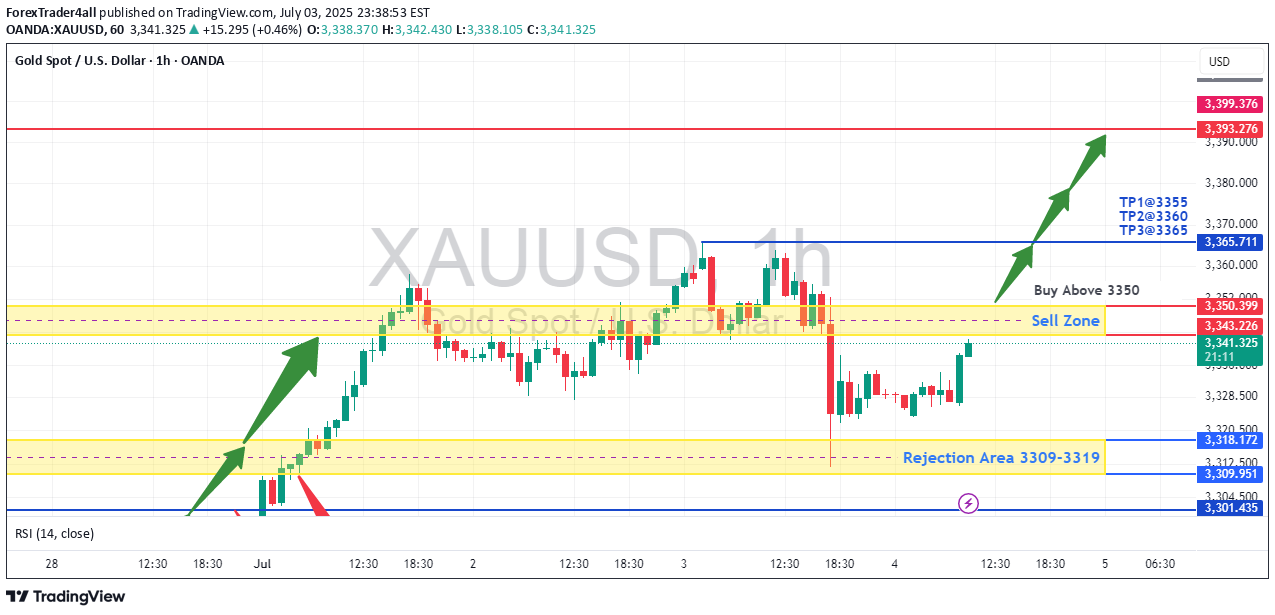
The chart shows a potential buy setup for gold (XAUUSD) with the following key points: Price Action: Gold is trading at 3,341.465, above the suggested "Buy Above 3350" level, indicating a bullish bias. Support/Resistance: The rejection area at 3309-3319 held as support, and price has moved higher, confirming buyer interest. Take Profit Levels: TP1 (3355), TP2 (3360), and TP3 (3365) provide clear upside targets. RSI Confirmation: The RSI (14) at 54.21 shows moderate bullish momentum without being overbought. Volume & Close: The slight increase in price (+0.09%) with supportive volume suggests accumulation. Trade Idea: Enter long above 3350 with stops below 3309, targeting TP1-TP3. The rejection zone and RSI support further upside. Disclaimer: This is not financial advice. Please consult with a financial advisor before making any investment decisions. We are not responsible for your loss because we are not SEBI registered and this analysis based on technical aspects and only for educational practice. Do your own research.Trade closed with huge profit from Buy Trade Setup....
ForexTrader4all
XAUUSD - Local Bearish Trend and Retest of Support-Resistance
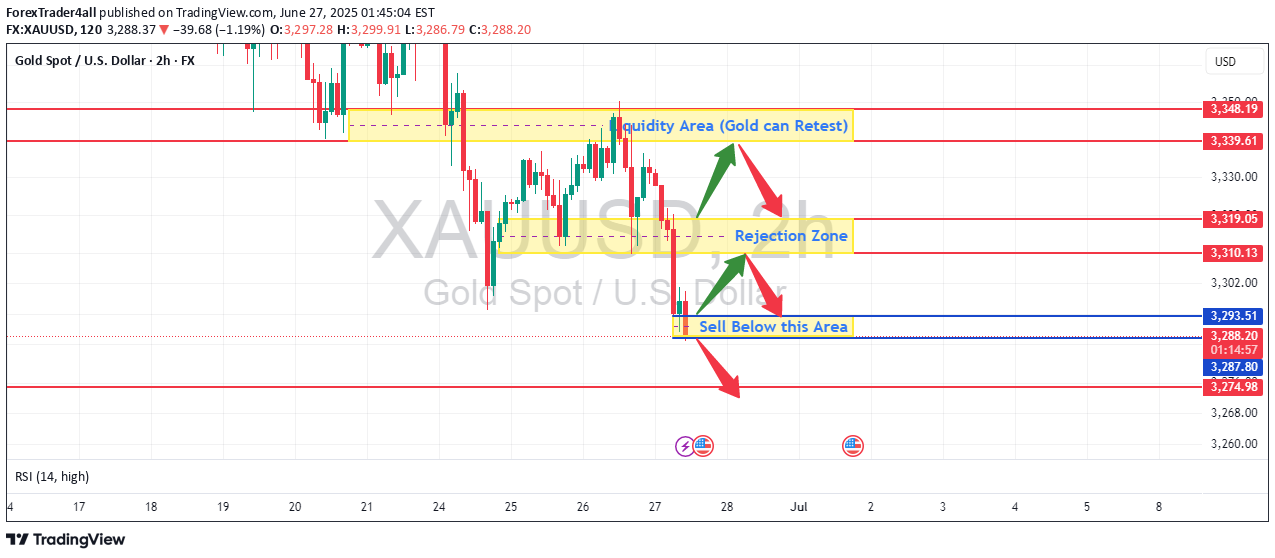
Overall Trend: The chart shows that Gold (XAUUSD) has been in a downtrend over the depicted period, particularly after a significant drop around June 24th/25th from the higher price levels (around 3348-3350). While there have been attempts at recovery, the price has generally been making lower highs and lower lows, indicating bearish momentum. Key Observations and Potential Entry Points: Liquidity Area (Resistance/Potential Retest Zone): -The yellow shaded area marked "Liquidity Area (Gold can Retest)" between approximately 3330 and 3348 acted as a strong resistance zone after the initial drop. Potential Entry (Short): If the price were to rally back into this "Liquidity Area" and show clear signs of rejection (e.g., bearish candlestick patterns like pin bars, engulfing patterns, or failure to break above it), it would be a strong point to consider a short (sell) entry. The red arrow indicates this possibility. Rejection Zone (Current Resistance): - The yellow shaded area marked "Rejection Zone" around 3310-3319 is currently acting as a significant resistance. The price has attempted to break above it multiple times and has been rejected. Potential Entry (Short): This area also presents a potential short (sell) entry if the price retests it and shows clear signs of rejection. The current candle is below this zone, indicating the rejection has already occurred. "Sell Below this Area" (Breakdown Point): - The blue shaded area around 3293.51 - 3287.80 is highlighted as a critical support level. Strong Point to Enter Trade (Short): - The chart explicitly labels this as "Sell Below this Area." If the price breaks convincingly below this support level (with strong bearish candle close below and follow-through), it would be a high-conviction short (sell) entry point. This indicates a potential continuation of the downtrend to lower targets. The red arrow signifies this downward move. RSI (Relative Strength Index): - The RSI (14) is currently at 28.33. This indicates that Gold is approaching or is in oversold territory. While oversold conditions can sometimes precede a bounce, in a strong downtrend, prices can remain oversold for extended periods. It's crucial to combine RSI with price action. If the price breaks below the "Sell Below this Area" with an already oversold RSI, it might suggest a strong bearish momentum overwhelming any immediate bounce. Trade Entry Strategy Summary: Aggressive Short Entry: Consider a short if the price retests the "Rejection Zone" (3310-3319) or the higher "Liquidity Area" (3330-3348) and shows clear bearish rejection. Confirmation Short Entry (Strongest Signal): The most robust short entry highlighted is a confirmed break and close below the "Sell Below this Area" (3293.51 - 3287.80). This would signal a continuation of the bearish momentum. Important Considerations: Risk Management: Always define your stop-loss order (e.g., above the rejection zone or above the breakdown level) to limit potential losses. Target Levels: While not explicitly marked with targets, after a breakdown, look for previous swing lows or significant psychological levels as potential profit targets. The red line at 3274.98 could be an initial target if the "Sell Below this Area" is breached. Confirmation: Always wait for candlestick confirmation (e.g., a strong bearish close) before entering a trade. Timeframe: This is a 2-hour chart. The analysis is valid for this timeframe, but always consider higher timeframes for broader trend confirmation. News/Fundamentals: While this is a technical analysis, be aware of any upcoming economic news or events that could impact Gold prices. In conclusion, the chart strongly suggests a bearish bias for Gold, with key resistance zones above and a critical support level below that, if broken, could lead to further significant downside. Disclaimer Warning - Do your own research before trading in Gold, we are not responsible for your loss...
ForexTrader4all
XAUUSD - Next Course of Action
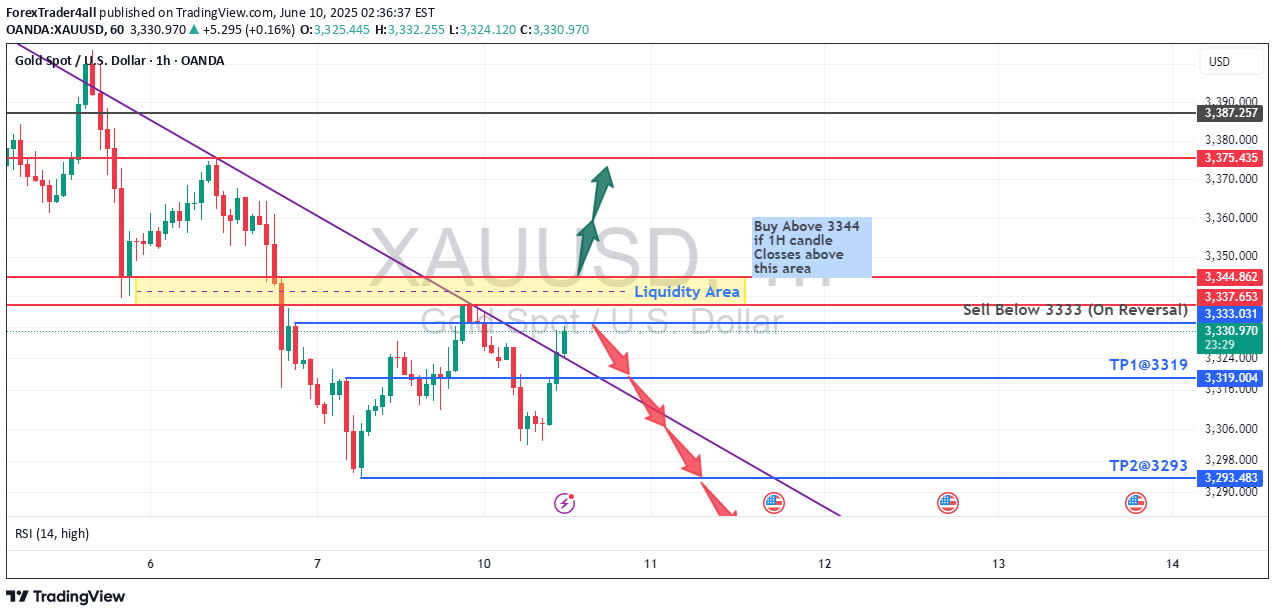
XAUUSD is near the Liquidity Area 3337-3344, if 1H time frame candle closes above this area then on the confirmation of RSI, you can go for Buy Trade setup with the following Targets:- TP1 at 3354 TP2 at 3359 TP3 at 3365 TP4 at 3375 (By Trailing Stop Loss) But if it pullback from the are then you can place a Sell Trade below 3333 with the following Targets:- TP1 @3319 TP2 @3293 TP3 @3275 (by trailing stop loss) Always wait for proper confirmation before you plan your trades... This setup is for educational purposes... Do your own research before trading in Gold, we are not responsible for your loss...
ForexTrader4all
GOLD potential PULLBACK and CONTINUATION

Rejection Zone 3350-3369 if Broken Downward then retest of another Buy Zone 3230-3272 is possible... This is not an investment advice, we are not responsible for any loss because this is just for educational purposes... Do your own research before trading Gold...
ForexTrader4all
DENTUSDT - Ready for Bull Rally on Retest or Breakot

As per my analysis, DENTUSDT is ready for a bull rally after the retest of the zone or breakout of the trend as shown on the chart... Do your own research before entering in the crypto trading as we are not responsible for your loss and this is just for educational purposes... Thanks for your support as always...
ForexTrader4all
XAUUSD - Time to Sell Gold or wait for Consolidation Break

As per technical analysis and chart pattern, XAUUSD is consolidating and ready for a big downfall. You can setup a sell trade either at CMP or wait for the consolidation to break downside All points are mentioned on the chart but do your own research as I am not a financial advisor Thanks for your support as always
ForexTrader4all
XAUUSD - An Opportunity to Buy Gold

As per previous chart history and technical analysis, a buying opportunity has been seen in GOLD. You can buy this golden metal at above 2029 with a stop loss below 2019 @2017 This is not an investment advice, do your own research before entering into any trade setup in Gold as market is more volatile before dump and it may wash all your equity Thanks for your support as alwaysTrade closed: target reached: All Buy targets are reached till 2088 and closed all the buy trades. Also I guided my students to sell XAUUSD 3 times and all targets reached
Disclaimer
Any content and materials included in Sahmeto's website and official communication channels are a compilation of personal opinions and analyses and are not binding. They do not constitute any recommendation for buying, selling, entering or exiting the stock market and cryptocurrency market. Also, all news and analyses included in the website and channels are merely republished information from official and unofficial domestic and foreign sources, and it is obvious that users of the said content are responsible for following up and ensuring the authenticity and accuracy of the materials. Therefore, while disclaiming responsibility, it is declared that the responsibility for any decision-making, action, and potential profit and loss in the capital market and cryptocurrency market lies with the trader.