Technical analysis by ForexTrader4all about Symbol PAXG: Sell recommendation (9/12/2025)

ForexTrader4all
XAUUSD - Holding on Major Resistance Buy/Sell
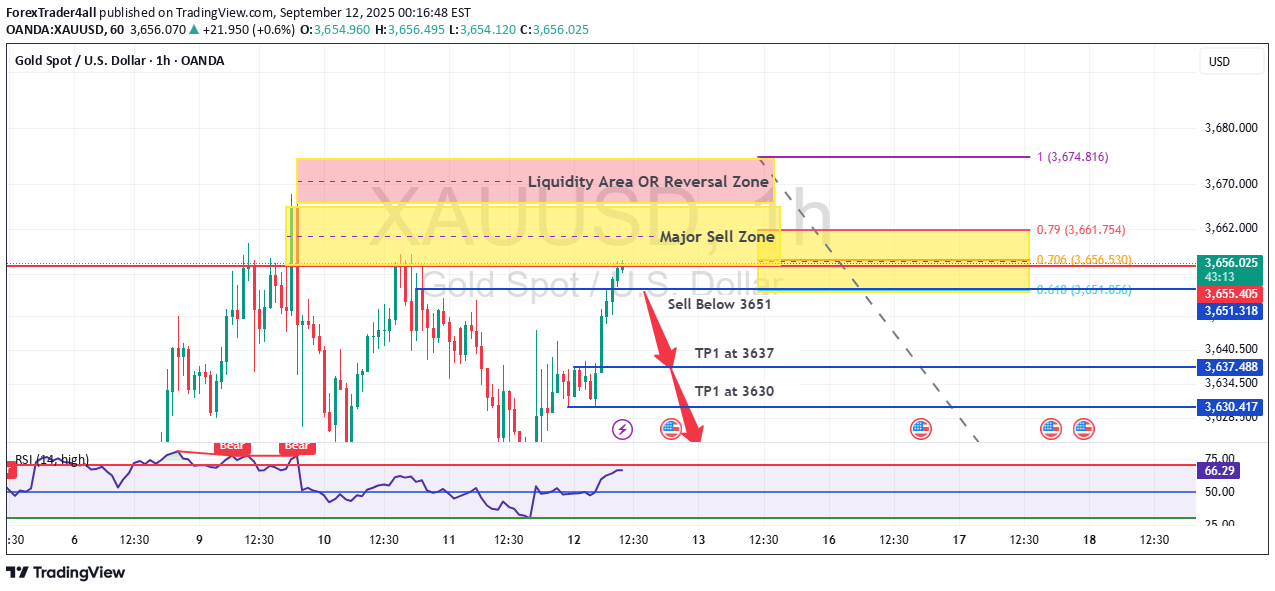
Analysis of XAU/USD (Gold) Chart - Bearish Potential Based on the current chart position for XAU/USD on September 12, 2025, the market structure and indicators point to a strong bearish (downward) potential. Here are the key points supporting this analysis: Prevailing Downtrend: The price action shows the asset is already in a downtrend for the session, trading down approximately -0.58% from its previous close. The current price (63,655.135) is positioned near the lower end of the displayed range. Position Relative to Key Zones: The current price is trading significantly below the identified " Major Sell Zone " and " Liquidity Area OR Reversal Zone ," which are concentrated between approximately 3,674 and 3,680. This suggests the market has already rejected these higher price levels and is moving away from them, confirming the selling pressure. Resistance Levels: Multiple strong resistance levels are stacked above the current price (e.g., 3,662.000, 3,670.000, 3,674.816, 3,680.000). This creates a "ceiling" that could cap any upward attempts and reinforce the bearish outlook. Potential Trade Signal: The chart is explicitly indicating the analysis has issued a sell signal based on its strategy. In summary, the chart evidence strongly suggests a bearish inclination . The price is in a short-term downtrend, resides well below major resistance and sell zones, and is accompanied by an active sell signal. Disclaimer:- We are not responsible for your losses due to this analysis, do your own research or consult your financial advisor to invest in this volatile market