Technical analysis by ForexTrader4all about Symbol PAXG: Buy recommendation (9/21/2025)

ForexTrader4all
XAUUSD - A Dip before next ATH
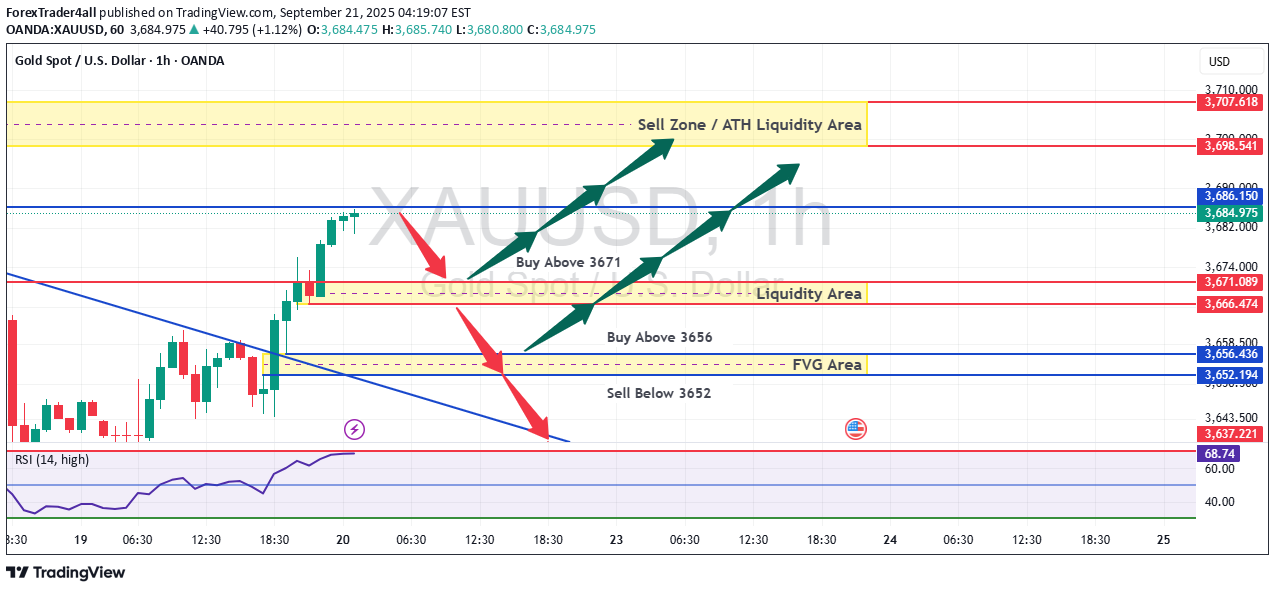
Overall Trend: Bullish with Consolidation at Highs The primary, long-term trend for XAUUSD is decisively bullish. This is evident from the fact that the price is trading near its All-Time High (ATH) liquidity area at 3,684.975. The chart notes the price is up +40.795 (+1.12%), confirming recent upward momentum. However, the price action shows it is currently in a phase of consolidation or pullback from these extreme highs. The key question is whether this is a minor pause before continuing higher or the beginning of a larger correction. Key Technical Levels & Areas 1. Resistance (Sell Zone / ATH) ATH Liquidity Area: 3,684.975 This is the absolute highest point and the strongest resistance. A clean break and close above this level would signal a continuation of the bullish trend towards new uncharted territory. 2. Immediate Support & Demand Zones The chart outlines two primary "Buy" zones, which are clusters of support where buying interest is expected to be strong. Primary Buy Zone (Above 3671): 3,671.062 - 3,682.976 This is the first and most immediate support cluster. The price is currently interacting with this area. A hold above 3,671 could see a bounce back towards the ATH. Secondary Buy Zone (Above 3656): 3,635.200 - 3,647.000 This is a deeper support zone, filled with Fair Value Gaps (FVGs)—areas of imbalanced buying that often get retested. A drop into this area would indicate a stronger pullback but could present a higher probability buying opportunity for a rebound. 3. Critical Support (Bearish Trigger) Sell Trigger Level: Below 3652 This is the most critical level for the bullish thesis. A decisive break and close below 3652 would likely invalidate the immediate bullish structure. It would signal that sellers have taken control, potentially triggering a deeper correction towards lower support levels not visible in this snippet. Momentum Indicator ESI (14, high): 68.74 The Efficient Strength Index reading of 68.74 indicates that the market is in bullish territory (above 50) but is not yet in extreme overbought conditions (often considered above 80). This suggests there is still room for upward movement before the market becomes excessively stretched to the upside. Summary and Outlook Bullish Scenario: Price holds above the 3,671 support zone and uses it as a base to launch another attack on the ATH resistance at 3,685. A break above this level confirms trend continuation. Consolidation Scenario: Price oscillates between the primary support zone (3,671) and the ATH resistance (3,685), building energy for its next major move. Bearish Scenario : Price fails to hold 3,671 and breaks down through the secondary FVG support zone. A break below the 3,652 level would be a strong signal that a short-term top is in place and a deeper pullback is underway. Conclusion: The bias remains cautiously bullish as long as price stays above 3,652. The most probable short-term outcome is continued consolidation between the key support and resistance zones. Traders would be looking for bullish reversal signals (e.g., pin bars, engulfing patterns) within the defined buy zones to enter long positions targeting the ATH. DISCLAIMER- We are not responsible for your losses. Do you own research before entering into the volatile market of XAUUSD