
Expate
@t_Expate

What symbols does the trader recommend buying?
Purchase History
پیام های تریدر
Filter
Expate
سیگنال انفجاری سولانا: آیا الگوی سر و شانه معکوس طلسم طلایی صعود است؟

SOLUSDT weekly chart shows a Reverse Head and Shoulders pattern. This structure usually forms after a downtrend and often signals a trend reversal to the up. The left shoulder is formed after the first decline. The head is the deepest low. The right shoulder is a higher low, which confirms strengthening structure. Price is now sitting around the neckline area near 120–125, which is the key level to watch. If SOL breaks and closes a weekly candle above the neckline, the Reverse Head and Shoulders pattern gets confirmed. In this case, price could move toward the 160–180 zone first. If momentum continues, the measured move points to the 220–250 area over time. If price fails to break the neckline and gets rejected, the pattern remains unconfirmed. In that case, SOL could see again the 90–80 support zone and trust me, I will buy that diiip! Buuut, a loss of 80s can open the door for a deeper move toward 65–70. Weekly RSI is trying to stabilize after a long decline, which supports the bullish reversal idea, but confirmation is still needed. Let's see how it plays out in 2026! FIngers crossed my friends.
Expate
اتریوم در مثلث، آیا ریزش تا ۳۰۶۰ و سپس صعود بزرگ در راه است؟
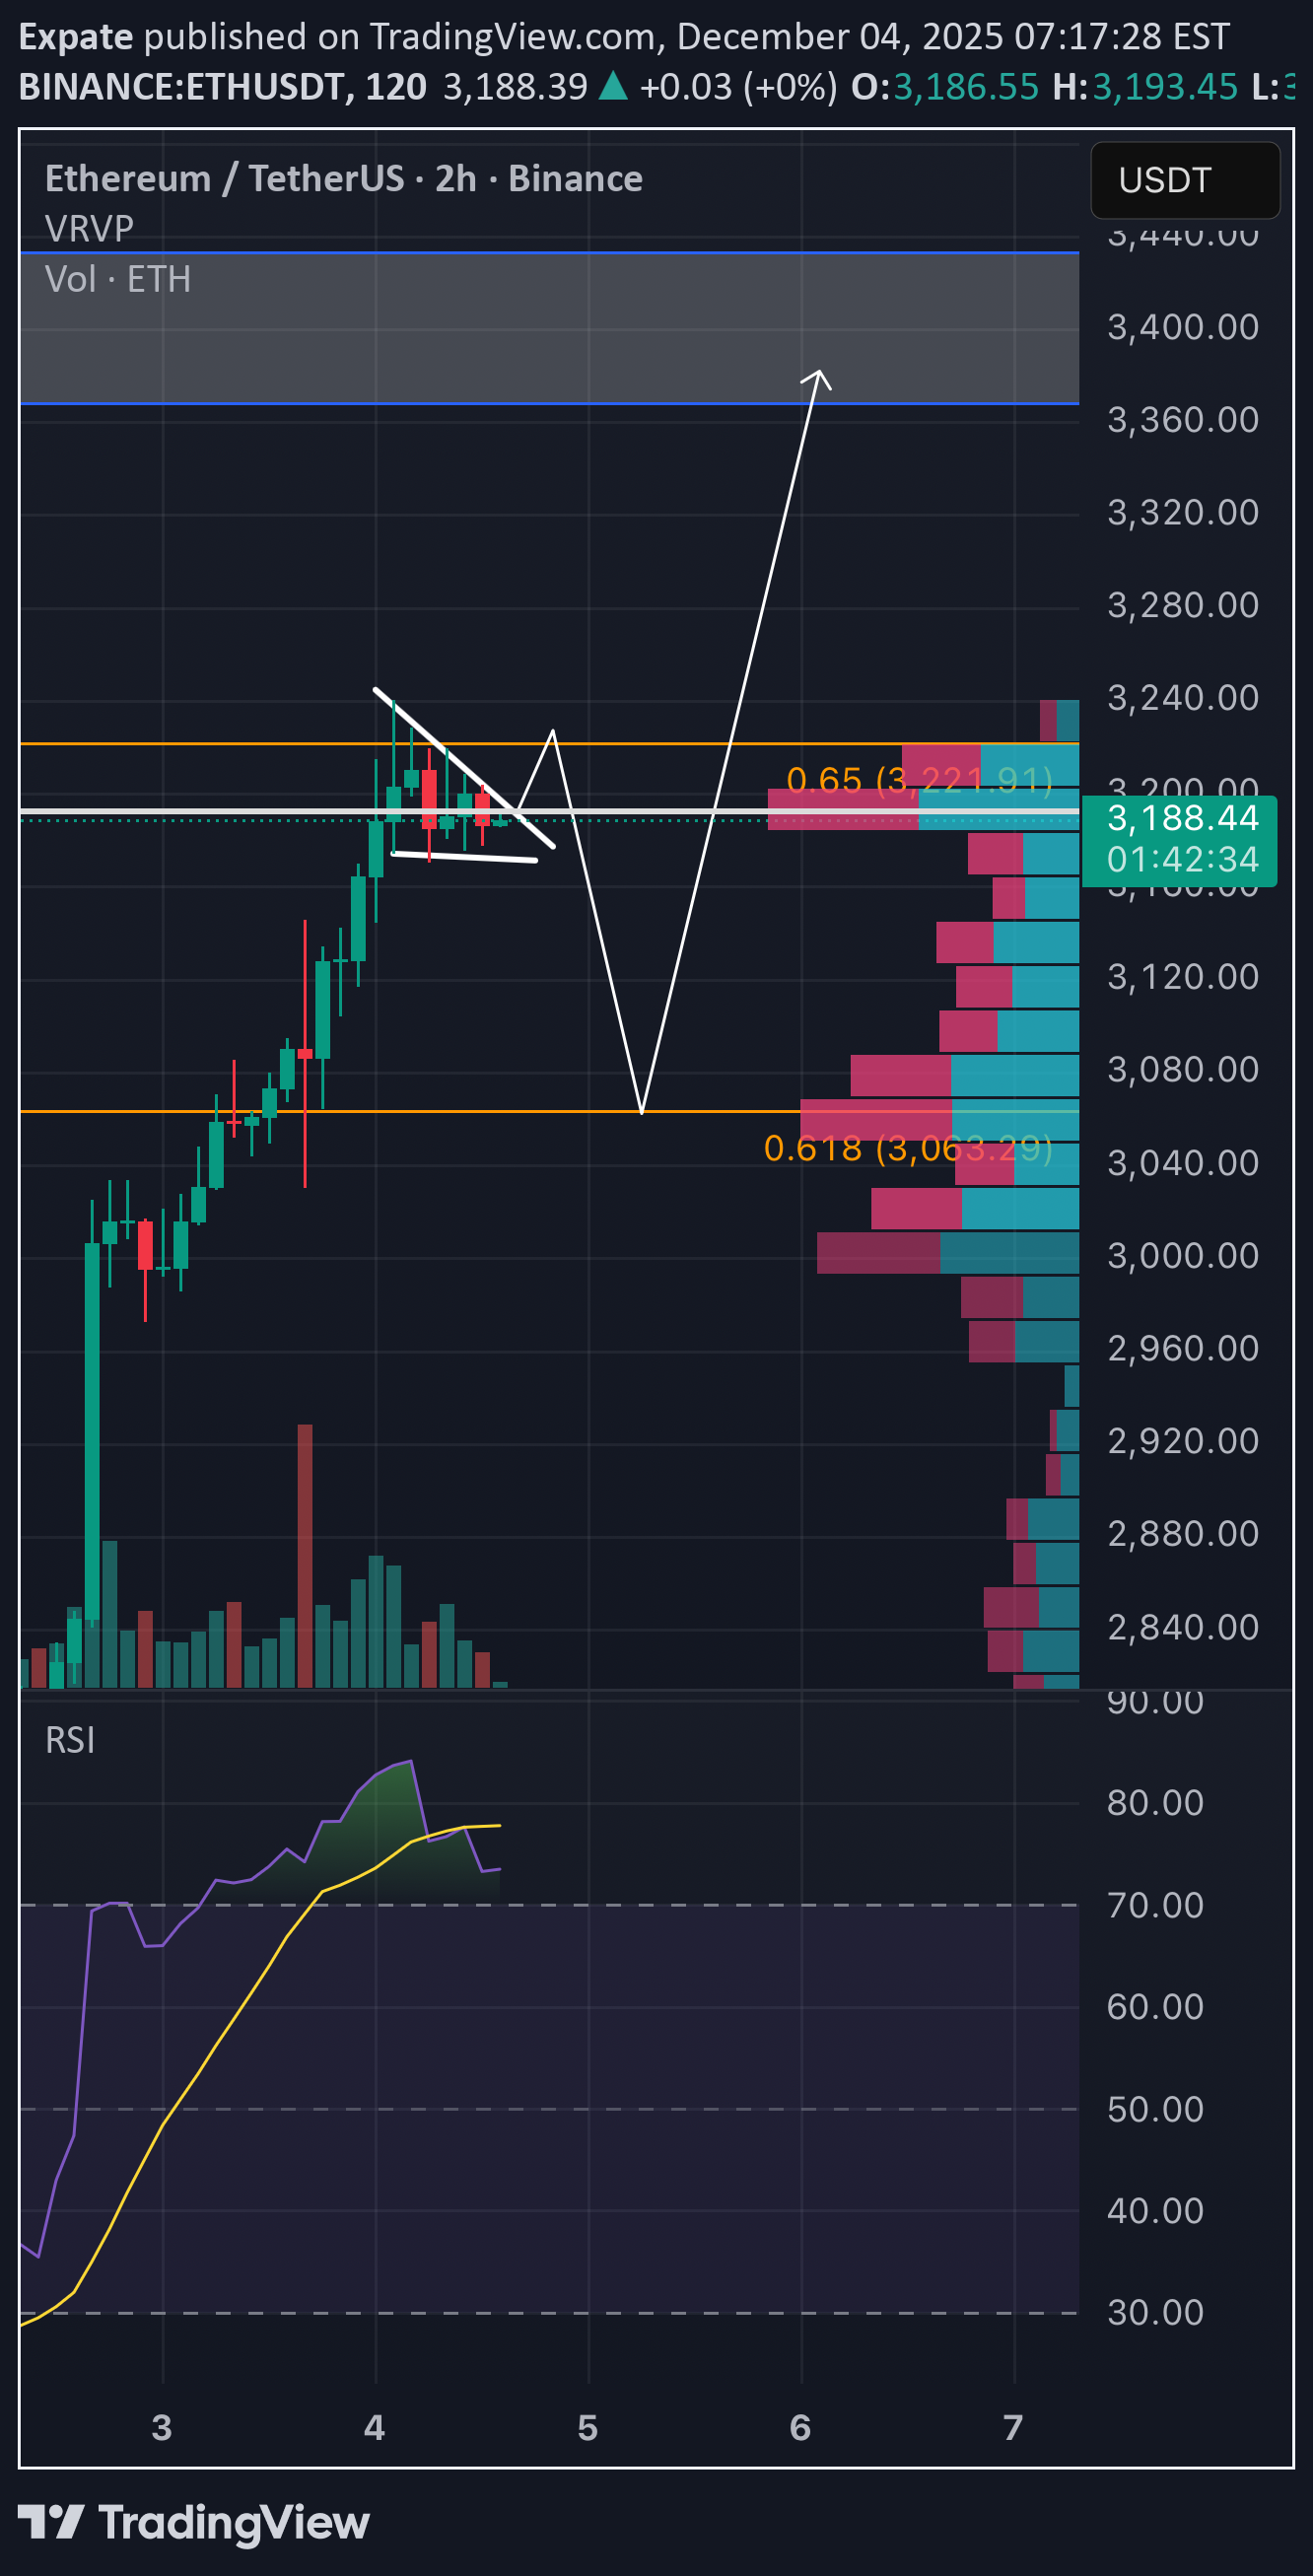
Price is currently around $3190 and is consolidating inside a small descending triangle. Volume is decreasing, showing indecision. A major support zone appears near the 0.618 Fibonacci level at ~$3063, where there is also a strong VRVP volume node, which could act as a liqudity grab zone. Two possible paths are: 1.Bullish scenario: Price breaks out of the triangle upward and continues toward the $3350–$3400 resistance zone. 2.Bearish scenario: Price dips down to the $3060–$3080 region, finds support at the 0.618 fib, and then continues up toward the same target zone. RSI is cooling off after being in the higher range.So far so good.Looks like ETH will have bigger correction than expected, since its already friday, I would sugget to close all trades, as we could retest 2800 levels during the weekend.
Expate
آیا فایل کوین (FIL) دوباره صعود میکند؟ تحلیل کلیدی حمایت و مقاومت در تایم فریم 4 ساعته
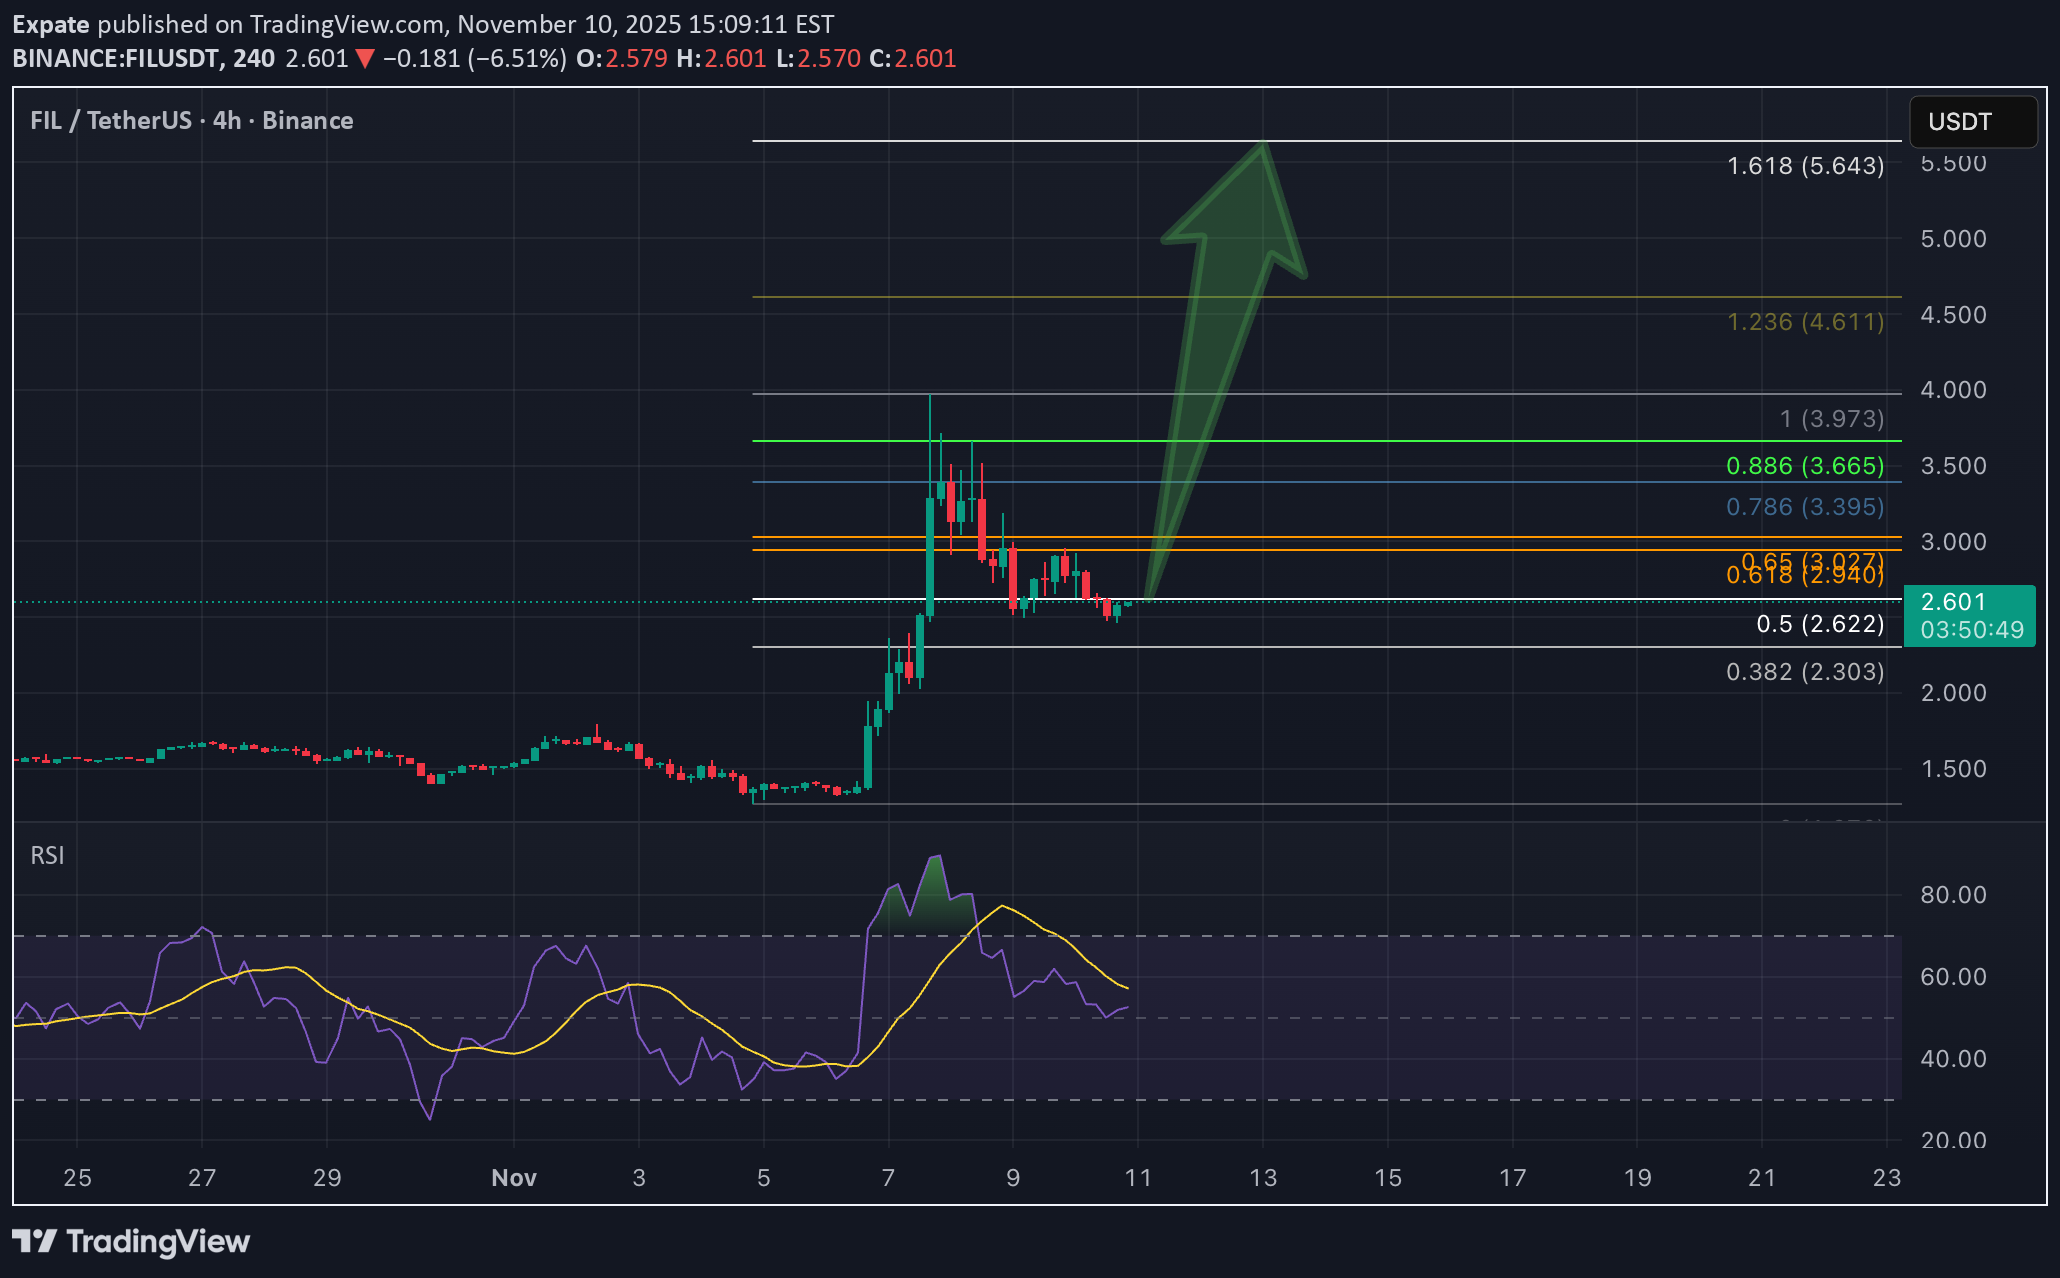
Filecoin made a strong move up and then started to cool down, pulling back to the 0.5 Fibonacci zone around $2.6. This area now works as support where buyers are stepping in. If price holds here, the next resistance is at $2.92-3.00, and then $3.40-3.65. A breakout above $3.65 could push FIL toward $3.97, then $4.61, and maybe up to $5.64. But if price closes below $2.30, the bullish setup will be canceled and we could see a deeper drop. Summary: 📈 Pattern: Strong move up with Fibonacci pullback 🟢 Support: $2.50-2.60 🔵 Resistance: $2.92-3.65 🎯 Targets: $3.97 - $4.61 - $5.64 ⚠️ Cancel: 4H close below $2.30 RSI is starting to rise from low levels, showing early signs that buyers may take control again. A candle close above $3 would confirm the move and then, let's follow the volume. A good entry point for this setup would be around $2.55-2.65, close to the 0.5 Fibonacci zone, where price has already shown signs of holding support. Here’s how we could plan it: Entry: $2.55-2.65 Stop loss: Below $2.30 (to protect from deeper drop) Targets: TP1: $2.92 TP2: $3.40 TP3: $3.97+ This gives roughly a 1:2.5 to 1:3 risk/reward, which is solid if Bitcoin stays stable or moves up.The previous setup was invalid because price never gave a clean entry. But now, the chart shows something different. FIL is moving just under the 0.382 Fibonacci level at 2.30, and this level is the key right now. RSI is slowly turning up, which means buyers are trying to push it higher. A simple and clean plan: Entry: when price breaks above 2.30 and holds above it. Stop loss: under 2.05 Take profit targets: TP1: 2.62 TP2: 2.94 to 3.03 TP3: 3.39 to 3.66 If price cannot break above 2.30 and rejects again, it can drop down to the 1.90 to 1.80 area.This could be it, everyone is scared, therefore, good entry from current $2.00 RANGE.
Expate
دوجی سنجاقک در اتریوم: راز سیگنال صعودی قدرتمند در نمودار ETH!
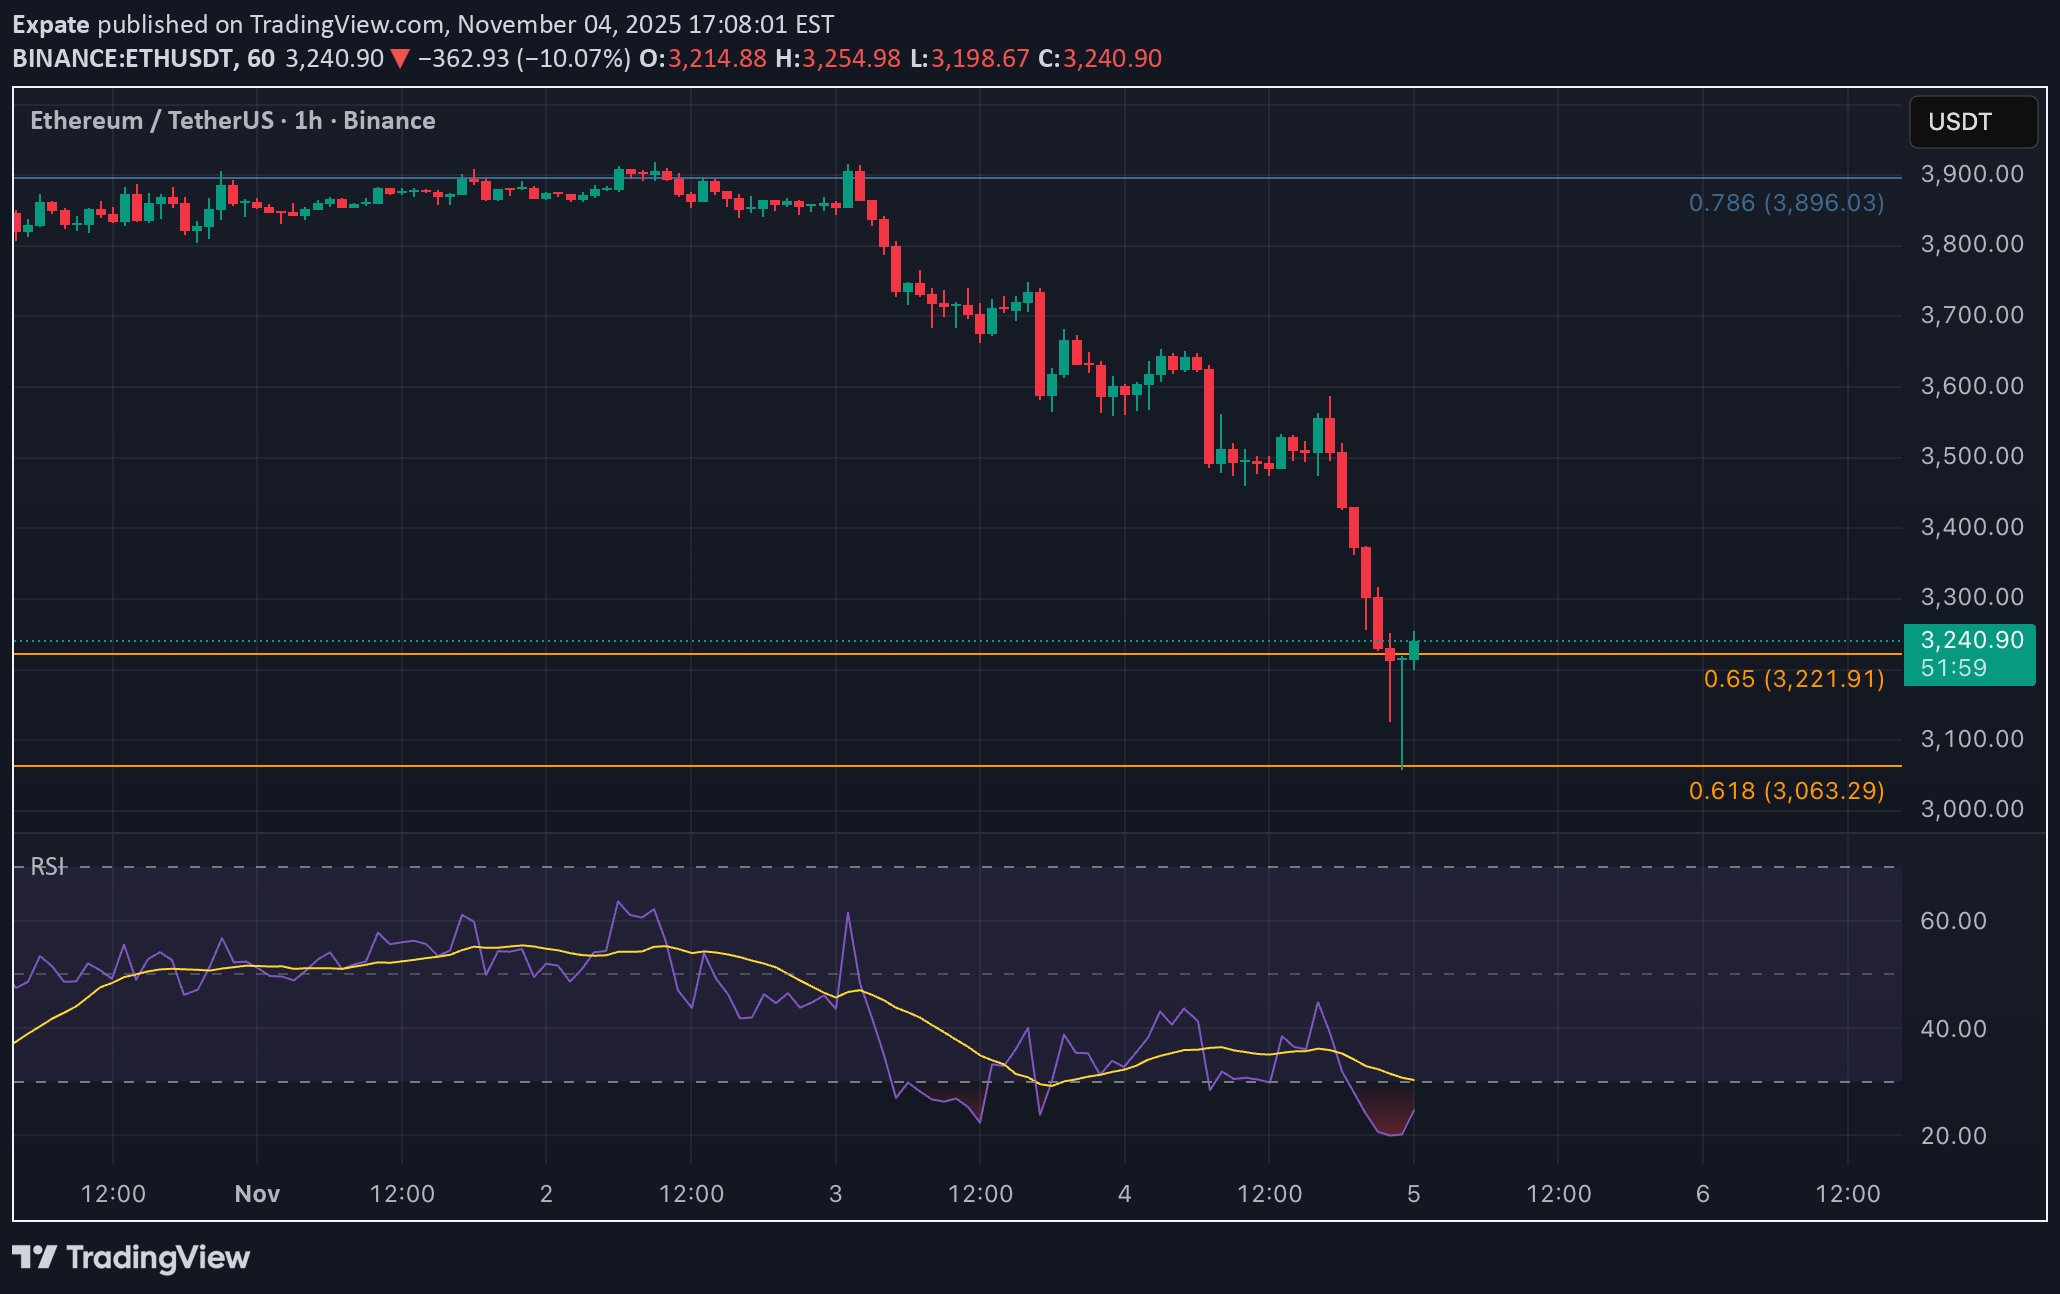
A Dragonfly Doji is a candlestick pattern that looks like a “T”. It means the price dropped during the candle but then came back up to close near the opening price. This shows that buyers pushed the price back up, and it can be a bullish reversal signal, especially after a downtrend like we saw right now on ETH. Fingers crossed, bulls!Let's go bulls! Next stop 3.8k at least!
Expate
آیا بیت کوین در آستانه تغییر مسیر است؟ فرصت خرید زودهنگام!
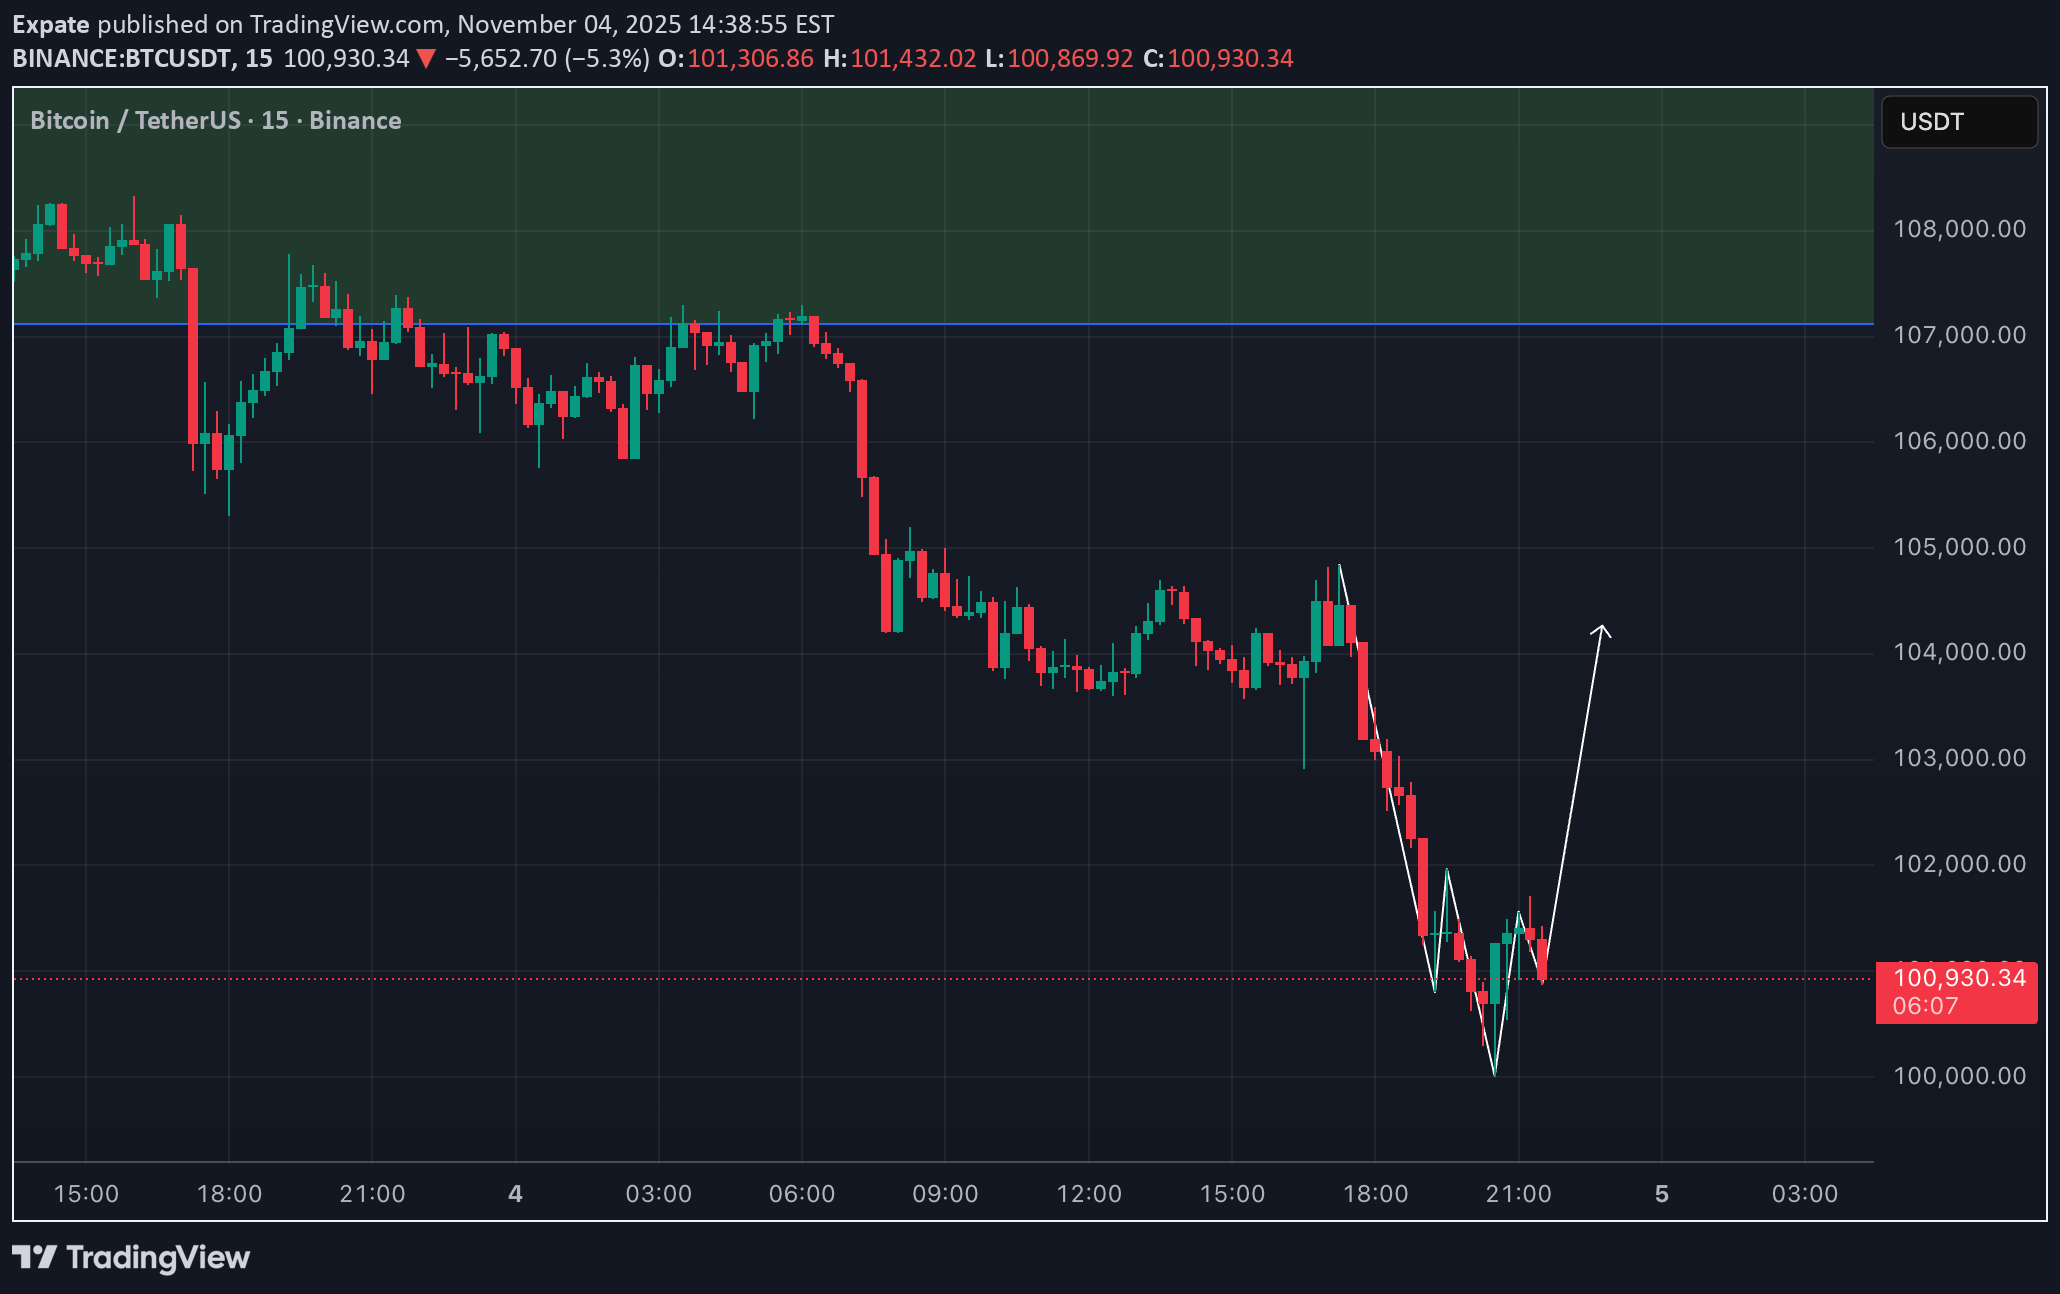
BTC could find some reversal. very soon, take your chances now!!!Entry 100.4 SL 98.4 TP 104.4Currently we are out fro mreversal structure, but divergence here comesClosing manually, I'm ok with 104.1 😁😁
Expate
احتمال برگشت قیمت طلا: رازهای نهفته در واگرایی RSI و سقف دوقلو!
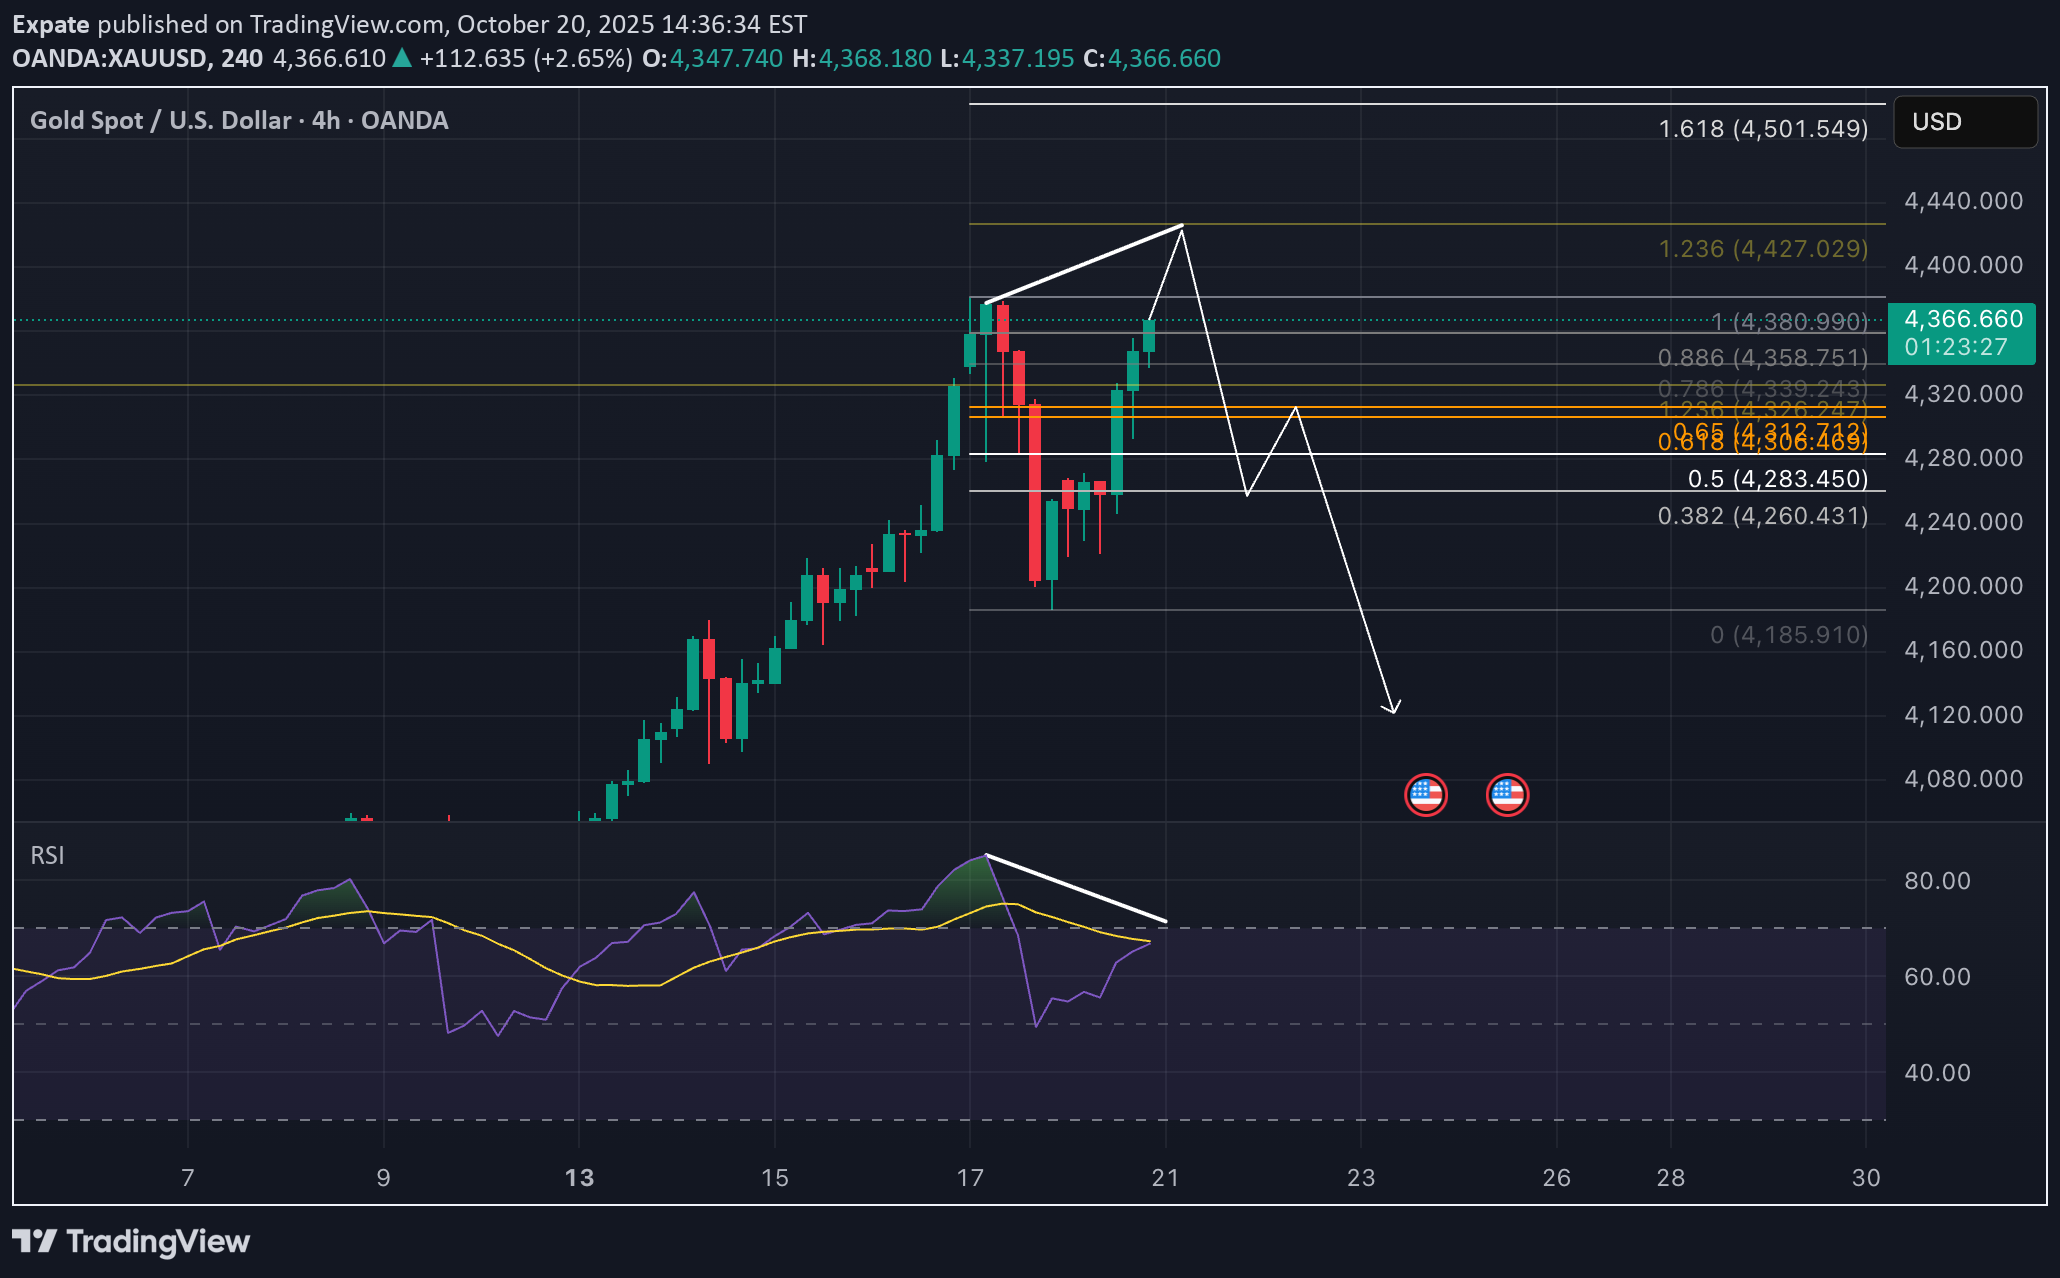
Gold is showing some wild moves lately, and I think a reversal might be on the horizon based on a possible divergence on the RSI. Check out this 4-hour chart from TradingView—let’s break it down! The Setup: We’ve seen gold climbing recently, hitting a peak around $4,380 before dropping back. The RSI looks like it’s diverging, hinting that momentum might be fading that could be a sign of a reversal incoming! * Two Possible Plays 1) Double Top & Retest: We might see a double top forming, followed by a drop to retest the recent bottom liquidity levels around $4,120-$4,160. 2) Divergence & Retest: The RSI divergence could lead to the same retest of those bottom liquidity levels, giving us a chance to see where it bounces. Key Technicals: RSI is showing a potential divergence aka momentum weakening while price peaked. Support zone sits around $4,120-$4,160. Resistance is near the recent high of $4,366. Trade Idea (not financial advice): Watch for a break below $4,160 to confirm the retest, or a bounce from there for a potential long. If it drops past $4,080, might be time to rethink. Targets? Could/or would climb back to $4,366 or higher if momentum kicks in! Summary: Gold’s at a crossroads with a possible reversal brewing. Whether it’s a double top or RSI divergence, the next move might retest those lower levels. Keep an eye on it, it can get interesting soon! P.s. sure it can also continue its growth, so before proceeding with any type of entry find your reversal structure on lower timefrae. GL!This was really funny, because there was actual divergence 😀 Previuos ath = 4380.990 Current ath = 4381.440 and RSI 85 vs 66 So, in terms of the rules, it is divergence, after what gold fell to 0.382 fib (from last growth) and hit lowest point at 4245.245. I closed trade with a profit, and will consider to re-enter it after 0.65 fib retest. Good luck!
Expate
BTC - Continuation of Bull Trap 21.06.2025

Hello Friday! Never, ever, ever trade crypto on weekend, but let's hop in! 🔻 What I expect more? Continuation of Bull Trap! (Probability 70/30) Few Reasons: Price broke 20 EMA(daily) and is sliding just above the 50 EMA with "dead-cat" bounce attempts. RSI is going down below 50 — momeentuum is faaadiing. No signs of some big demand at this level (low volume on small green candles + Iran uncertainty). Notable, that we are far from any bounce move (which would support re-accumulation). Scenario 1: Bearish Continuation (Most likely) Expecting BTC to test the 99.5k zone — this is the key support level becasue of several arguments: 1) 0.886 Fib 2) Confluence with previous horizontal range support 3) 100 EMA 4) Under psychological level 100k 5) RSI needs to cool off before taking higher targets. If 99.5k broken, next stop is near 88.5k (0.786 Fib) I wouldn't like to analyse further possible downslide of BTC, so lets stay so far in already negative scenario within 88.5k, but let's keep in mind, that maximum pain we will see near 75k zone. 🟡 Alternative: Short-term Bounce (Probability 30/70) BTC could attempt bounce towards 105–106.5k (retest of broken structure + 20 EMA resistance) If this bounce has low volume and rejection near EMAs or RSI stays below 50 , it's a sell opportunity — not a bullish reversal. ✅ Final thoughts for short term: stay away from the market. From 103.5k I would expect downward continuation toward 99.5k with possible minor bounce attempts along the way. Wait for strong reversal signal near 100k and enter LONG with tight SL. Don't trade during the weekend, unless there's a once in a lifetime opportunity. Have fun!Ready for a long? Structure touched 98 673, currently trading near 99 400. Let's check this long setup: Entry 99400 SL 98300Wow, this setup was really nice. Long closed within 107 100, big fat profit was taken. Let's see what follows next. Hope my idea was helpful for you and you earned some extra $$$$.Well, we did hit 110+ — but in the end, it’s the one who takes the money that’s right! 😉💰
Expate
ETH: 6th consolidation week, AMD!?

Ethereum is super slow these days, ranging tightly between $2430 and $2800 for weeks after a recovery. Current price action shows signs of preparation for the next BIG move, but in what side!?!! Let’s break this down using the AMD model: 🔸 Accumulation We saw ETH bottoming out in April after a deep correction. Since then, price reclaimed the 200 EMA and consolidated just above the 0.5 Fib level at $2437. This horizontal zone has been the accumulation range base. 🔸 Manipulation Currently, ETH is testing the lower part of this range. Based on the chart structure, a possible liquidity squeeze breaking $2437 (mid-level) so we expect bearish trap for late sellers and non-believers before a viiolent reversal. This would be the classic “spring” move often seen in Wyckoff chart structures. 🔸 Distribution (later stage)** If (or when) ETH breaks above $2800 and gets new attention with strong volume, this can lead to a mind blown fuses expansion — targeting the psychological $3000 and after recovery to previous ATH zone. Previous ATH at $4875 is the main target. Reasonably, this would be the final stage of distribution before a probable pump and altseason madness starts. But we are far for that right now, expect it not earlier than mid-autumn. 🧠 Key Technicals: Okay, my Heikin Ashi candles show weakening — which means that we are close to the start of the Manipulation phase. RSI pulling back, resetting momentum for the next move. Fibonacci zones: 0.5 = $2437 0.618 = $1862 0.65 = $1706 🔮 Trade Idea (not financial advice): A fake move below $2437 followed by fast and immediate recovery would be an ideal long entry. Cancel trade if daily close below $1860, we can get lower this time. TP? Well, depends on your belief. If btc made almost 2x from previous high, $3000 / $3500 / $4000 / $4500 / $5000 could be good? ETH could see even 8-8.5k this cycle, but its super positive outlook on current market structure. 📊 Summary: ETH is showing classic AMD structure: Accumulation (in progress for 6 weeks, 6 fn weeks!) ⏳ Manipulation (going down) 📉 Distribution (recovery + growth) 🚀 Some while ago, ETH was already playing simillar games, so why it should be different this time? Breakout will come only after weak hands are shaken out, only after retail traders will sh*t their pants we will see growth. Hopefully we will see immediate growth from current levels, but I'm more realist this time. Ciao!Few days passed and there we go, ETH has reached first shoulder near 2100$.Neckline aka support was retested, and let's see further reaction. As usually, we have two options: 1) to start boosting from current levels, or 2) to see one more (healthy) dip to get rid from the recent "passengers" who took their longs.🚀 Nearly 60 days of consolidation — we’ve seen the shakeouts, and now distribution could be next. Get ready… the next rocket might be launching soon! 💥📈Fabolous trade.
Expate
ETH/USDT – Bullish Reversal From Demand Zone | 1H Setup

After a clean downtrend with lower highs and lower lows, ETH has just printed a clear local reversal from the previous demand zone around $2 480–$2 510 . Price-action shows us a rounded bottom, that is holding above the 0.5 Fib from the previous pump. We now see: ✅ Break of structure on the lower timeframes (check 15m) ✅ Price reclaiming 20/50 EMA with increasing volume ✅ Strong green engulfing candle, coming before momentum shift ✅ Stop hunter candle below support and quick recovery aka retest. Trade Idea: If ETH holds above $2510–$2520, we may see a strong move toward the next supply zone near $2750–$2780 . Entry: $2520–$2530 Stop-loss: Below $2440 (or around $2400 for safer invalidation below Fib 0.5) Targets: • TP1: $2666 • TP2: $2720 • TP3: $2770 🟩 Watch for confirmation with a candle close above $2540 + volume spike. 🟥 Cancel if price loses $2480 local support zone.TP1 is almost there, you can close trade fully within 2650, or you can close 40% of the trade and move SL to BE (entry point).Original TP1 was reached, recent high 2679.88. We could see one more spike, but afterwards correction is possible.
Expate
ETH local early double top formation - 25th of May, 2025.

(c) First things first. First Top: Around $2,860 on May 6. Second Top: Around $2,830–2,850, recently. Neckline is near marked by horizontal 0.5 Fibonacci level — current setup is very clean. I would say even too clean to be truth. Price has pulled back after the second peak and is hovering near the neckline. No breakdown yet, but we are close to that. _________________________________________ 📉 Trade Setup (If Double Top Confirms) 1. Entry: → Short below the neckline , approx. @ $2 430 with confirmation (candle should close below this level). 2. Stop Loss (SL):** → Should be above second top, around $2 860. → High risk SL: Above recent candle high ~$2 620. 3. Take Profit (TP):** → We get it from height measure: Top was at $2 850, neckline at $2 430 = ~$400 range → TP1: $2 430 − $420 = $2 010 → TP2: Optional — 0.618 Fib zone near $1 860 _________________________________________ 🔁 Retest Setup (If Break + Retest Happens) If price breaks below the neckline and then comes back up to retest ~$2 430 as resistance, we are looking to: 1) Weak bullish candle or bearish engulfing on retest 2) Lower volume on retest 3) Enter short there with a tighter SL above retest wick. ⚠️ !! WARNING !! DOUBLE TOP IS Not yet confirmed – price needs to break neckline and re-test it. We are already in BULL's market, therefore FOLLOW THE GLOBAL TREND. We are expecting volatility today because of Powells speech, thereofre this setup can be a TRAP, especially, If price closes back above ~$2 600 with strength — pattern is invalidated. If you trade against the trend you should be ready for consequences. Good luck!DOUBLE TOP IS NOT CONFIRMED
Disclaimer
Any content and materials included in Sahmeto's website and official communication channels are a compilation of personal opinions and analyses and are not binding. They do not constitute any recommendation for buying, selling, entering or exiting the stock market and cryptocurrency market. Also, all news and analyses included in the website and channels are merely republished information from official and unofficial domestic and foreign sources, and it is obvious that users of the said content are responsible for following up and ensuring the authenticity and accuracy of the materials. Therefore, while disclaiming responsibility, it is declared that the responsibility for any decision-making, action, and potential profit and loss in the capital market and cryptocurrency market lies with the trader.