
Eddy_Trade_
@t_Eddy_Trade_

What symbols does the trader recommend buying?
Purchase History
پیام های تریدر
Filter
Eddy_Trade_
هشدار جدی: بیت کوین به زیر ۹۰ هزار دلار سقوط میکند؟ دو سناریوی قطعی تحلیل تکنیکال
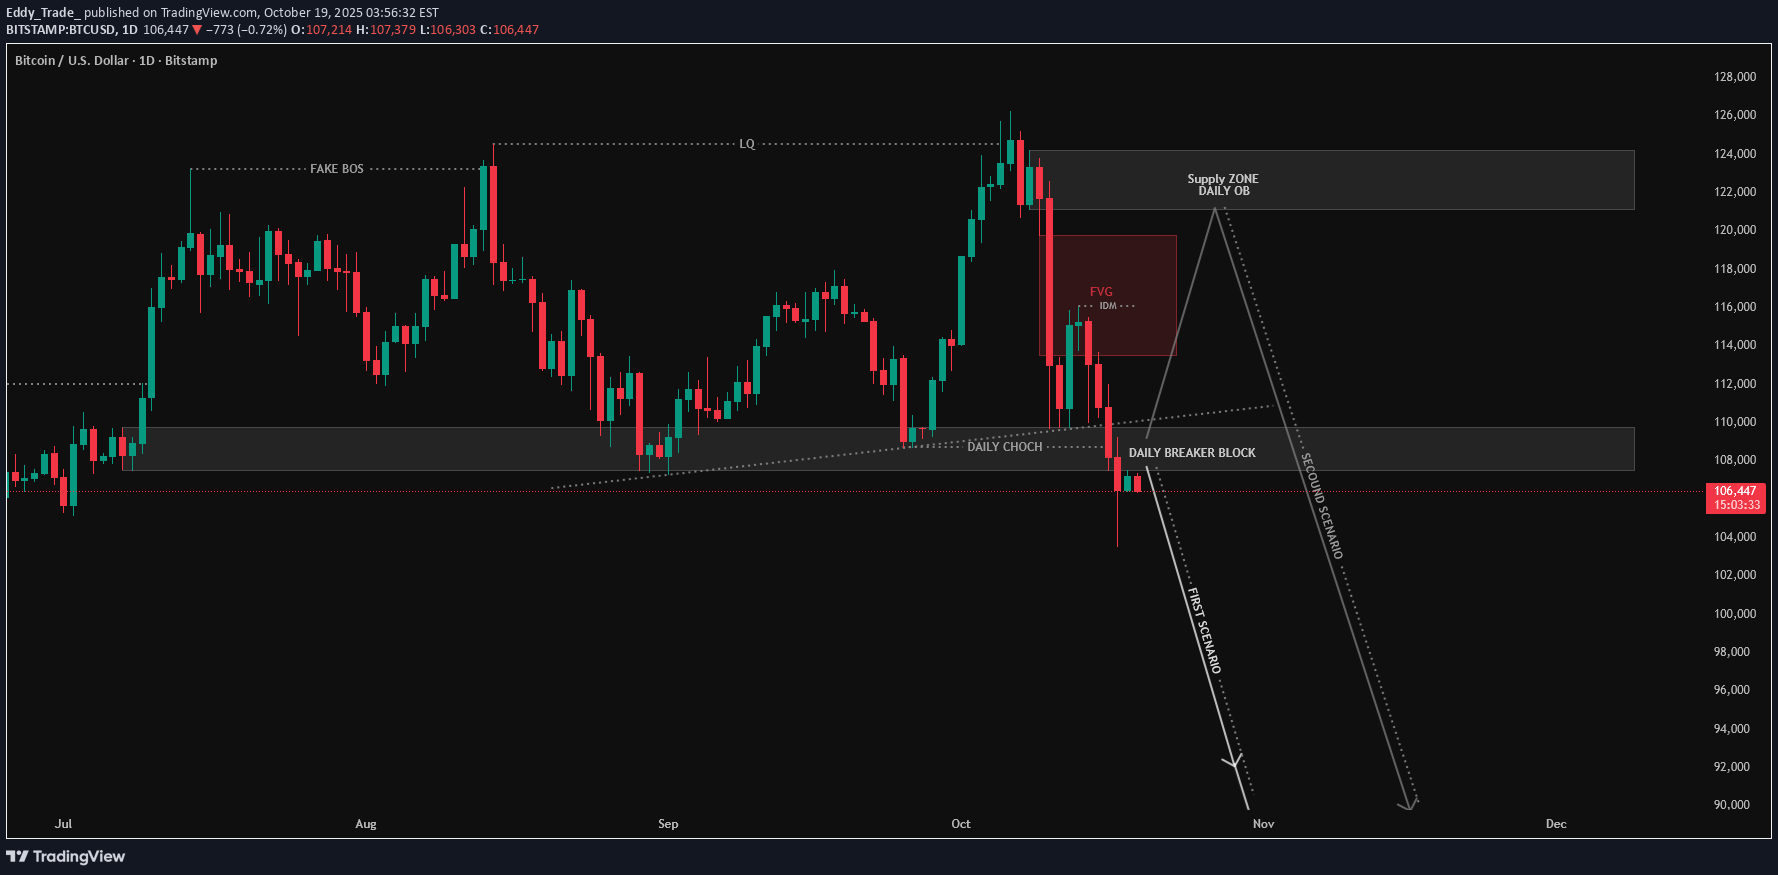
#BTC #BTCUSD #BTCUSDT #BITCOIN #Update #Analysis #Eddy Warning: Bitcoin and the cryptocurrency market are poised for the next wave of decline. I envision 2 scenarios for Bitcoin, both of which aim to see Bitcoin fall below $90,000. The first scenario, which is a daily block breaker, is more likely. The second scenario will only be activated when Bitcoin consolidates above $109,000, aiming to fill the FVG. Eventually, the second scenario will be activated, and the main decline will begin from the upper supply range that I have identified for you. I have identified the important supply and demand zones of the higher timeframe for you. As you can see in the chart, the trend change from bullish to bearish has been confirmed in the decline we had. This analysis is based on a combination of different styles, including the volume style with the ict style. Based on your strategy and style, get the necessary confirmations for this analysis to enter the trade. Don't forget about risk and capital management. The responsibility for the transaction is yours and I have no responsibility for your failure to comply with your risk and capital management. 💬 Note: This is just a possibility And this analysis, like many other analyses, may be violated. Given the specific circumstances of Bitcoin, it is not possible to say with certainty that this will happen, and this is just a view based on the ICT style and strategy with other analytical styles, including the liquidity style. Be successful and profitable. Review the result of my previous analysis on bitcoin :
Eddy_Trade_
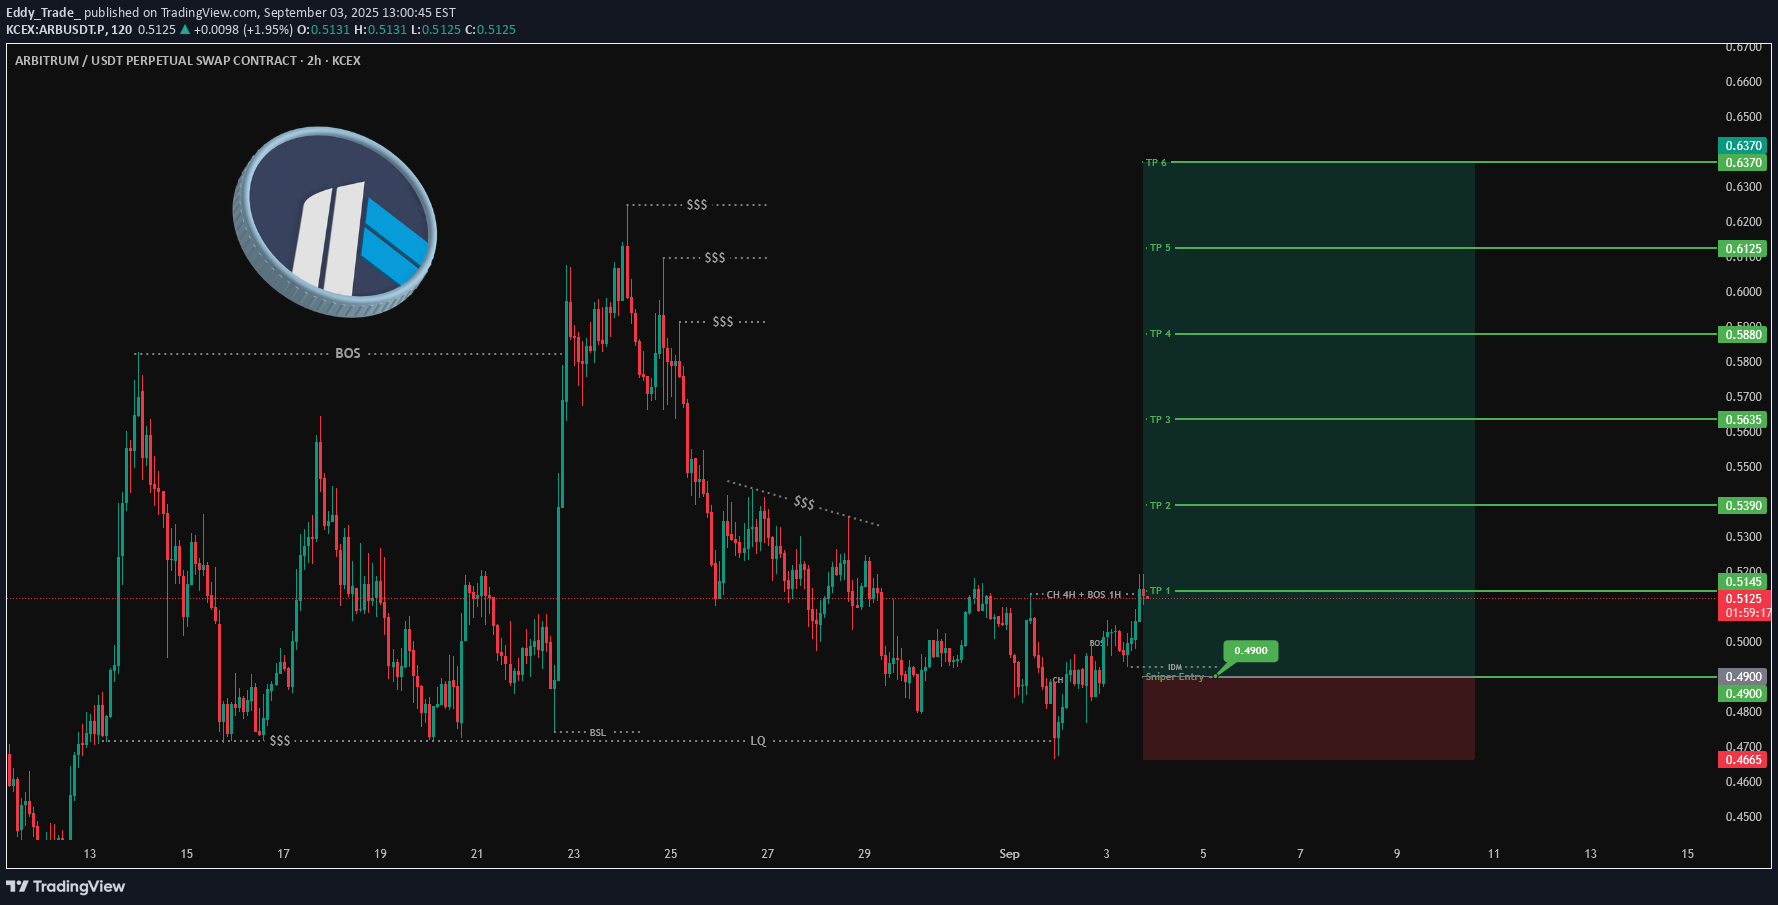
#ARBITRUM #ARBUSDT #LONG #Eddy ARBUSDT.P SWING Long Setup Important areas of the upper time frame for swing are identified and named. This setup is based on a combination of different styles, including the volume style with the ict style. Based on your strategy and style, get the necessary confirmations for this Swing Setup to enter the trade. Don't forget risk and capital management. The entry point, take profit point, and stop loss point are indicated on the chart along with their amounts. The responsibility for the transaction is yours and I have no responsibility for not observing your risk and capital management. By scratching the price and time bar, you can see the big picture of targets. Buy Position "LONG" Spot & Future Details : Entry : 0.4900 Stop : 0.4665 (( 4.80% )) "You can enter with a small stop by getting approval." Target 1 : 0.5145 "5%" Target 2 : 0.5390 "10%" Target 3 : 0.5635 "15%" Target 4 : 0.5880 "20%" Target 5 : 0.6125 "25%" Target 6 : 0.6370 "30%" Be successful and profitable.
Eddy_Trade_
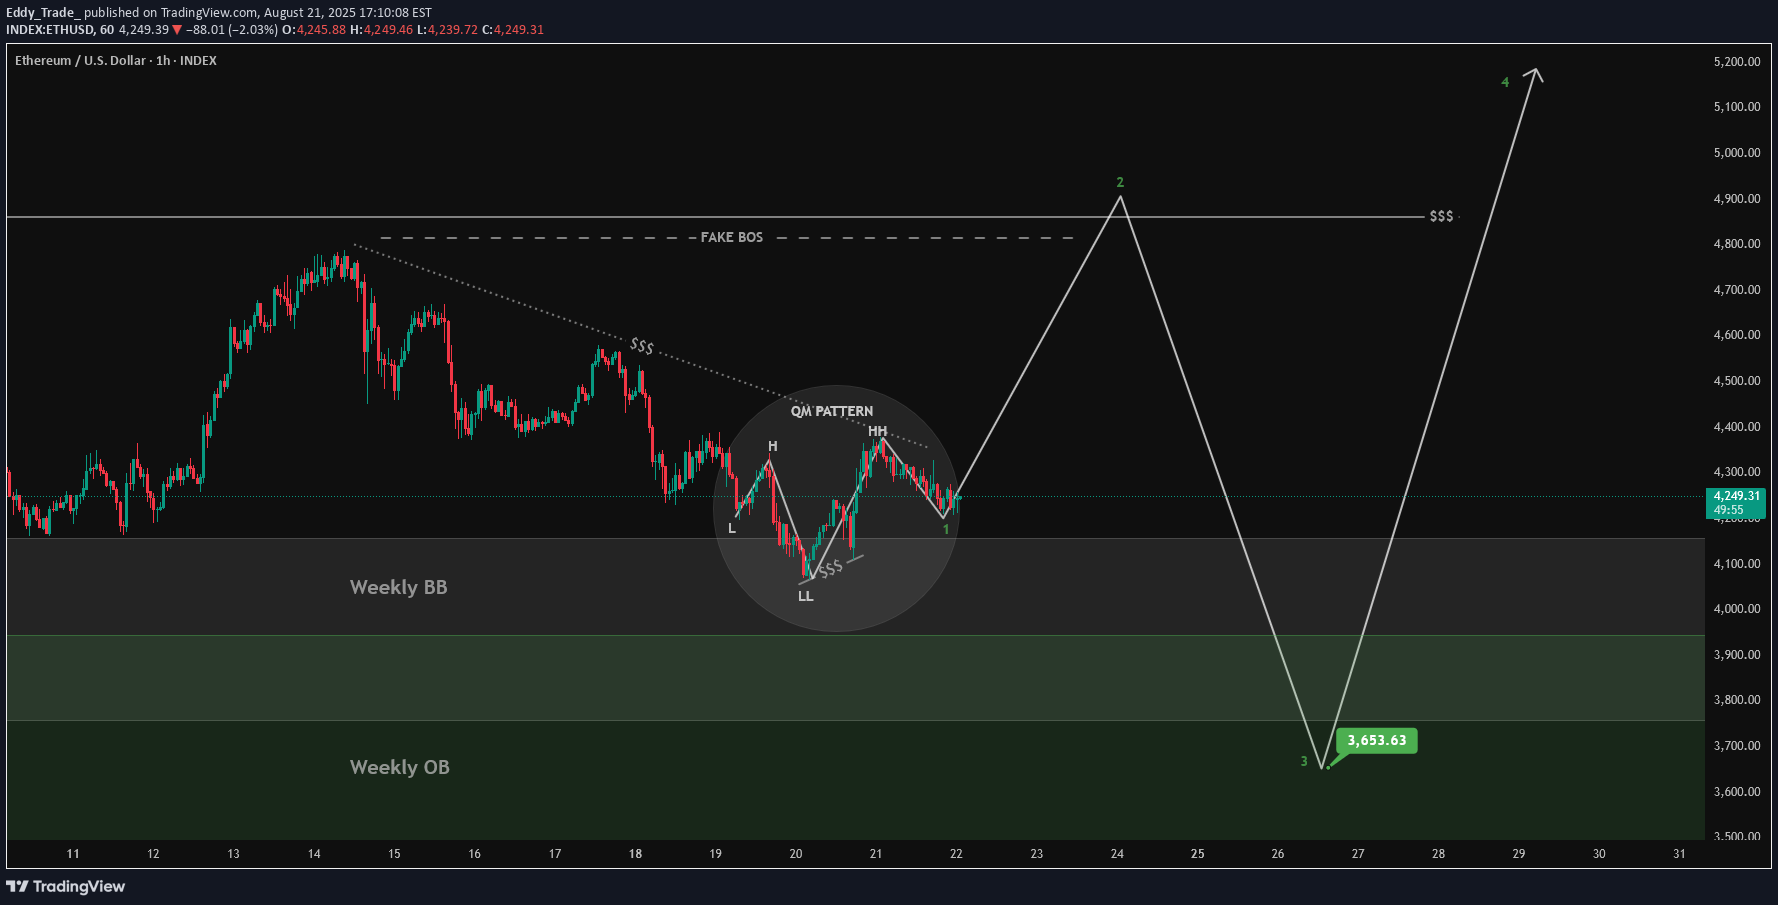
#ETH #ETHUSDT #ETHEREUM #Analysis #Update #Eddy According to the formed pattern, namely QM in the RTM style on the weekly block breaker, I expect an upward movement and a ceiling hunt and an ATH of Ethereum, and also in the ICT and liquidity styles, I expect a Fake BOS and a drop to the weekly block order to liquidate long positions and then continue the upward trend according to the analysis I did on the chart and the Path I drew. I expect the Ethereum currency to act accordingly. So I expect an upward movement, a drop and a re-rise according to this analysis and explanation. The important upper timeframe area for volatility has been identified and named. These settings are based on a combination of different styles, including volume style with ict style and a combination of RTM and liquidity style. Based on your strategy and style, get the necessary confirmations to enter the trade in these volatility settings. Don't forget about risk and capital management. The entry point, take profit point and stop loss point along with their values are indicated on the chart. The responsibility for the transaction is yours and I am not responsible for any failure to comply with your risk management and capital. 🗒 Note: If, according to the analysis, the progress after the main rise begins, I expect the price of Ethereum to reach the targets of the latest analysis provided on Ethereum, which will be attached. ⚠️ Warning: Predicting market movements is a mistake and this analysis may be violated, so do not rush into your decisions and proceed to trade after obtaining the necessary confirmations. Market makers will always surprise us and predicting movements and future movements is a complex and difficult task. Check out my previous analysis on Ethereum via the link below :
Eddy_Trade_

#BTC #BTCUSD #BTCUSDT #BITCOIN #Analysis #Eddy I have identified the important supply and demand zones of the higher timeframe for you. This analysis is based on a combination of different styles, including the volume style with the ict style. Based on your strategy and style, get the necessary confirmations for this analysis to enter the trade. Don't forget about risk and capital management. The responsibility for the transaction is yours and I have no responsibility for your failure to comply with your risk and capital management. 💬 Note: This is just a possibility And this analysis, like many other analyses, may be violated. Given the specific circumstances of Bitcoin, it is not possible to say with certainty that this will happen, and this is just a view based on the ICT style and strategy with other analytical styles, including the liquidity style. (( The fall of Bitcoin may not change the trend of altcoins and money will move out of Bitcoin and into altcoins, and we will see altcoins grow. )) Be successful and profitable.According to the analysis provided, it is falling.Bitcoin has dropped 8.40% spot from the indicated area exactly as the analysis provided 10 days ago ✔️ I hope you enjoyed the above analysis ❤️
Eddy_Trade_

#VIRTUAL #VIRTUALUSD #VIRTUALUSDT #Analysis #Eddy A reversal structure has formed on the weekly and daily time frames, and the necessary confirmations have been given on the weekly time frame. Considering the structure formed on the above time frame, as well as the behavior of this currency in the past chart, it is expected that this currency will perform a good pump. I have identified the important supply and demand zones of the higher timeframe for you. This analysis is based on a combination of different styles, including the volume style with the ict style. Based on your strategy and style, get the necessary confirmations for this analysis to enter the trade. Don't forget about risk and capital management. The responsibility for the transaction is yours and I have no responsibility for your failure to comply with your risk and capital management. 💬 Note: The red order block cannot stop the growth of the price of this currency and by 4.20 cents this currency will be pumped more than 200%. Be successful and profitable.
Eddy_Trade_

#SANDBOX #SAND #SANDUSD #SANDUSDT #Analysis #Eddy A reversal structure has formed on the weekly and daily time frames, and the necessary confirmations have been given on the weekly time frame. Considering the structure formed on the above time frame, as well as the behavior of this currency in the past chart, it is expected that this currency will perform a good pump. I have identified the important supply and demand zones of the higher timeframe for you. This analysis is based on a combination of different styles, including the volume style with the ict style. Based on your strategy and style, get the necessary confirmations for this analysis to enter the trade. Don't forget about risk and capital management. The responsibility for the transaction is yours and I have no responsibility for your failure to comply with your risk and capital management. 💬 Note: The red order block cannot stop the growth of the price of this currency and by 1.20 dollar this currency will be pumped more than 300%. Be successful and profitable.
Eddy_Trade_

#NOTCOIN #NOT #NOTUSD #NOTUSDT #Analysis #Eddy A reversal structure has formed on the weekly and daily time frames, and the necessary confirmations have been given on the weekly time frame. Considering the structure formed on the above time frame, as well as the behavior of this currency in the past chart, it is expected that this currency will perform a good pump. I have identified the important supply and demand zones of the higher timeframe for you. This analysis is based on a combination of different styles, including the volume style with the ict style. Based on your strategy and style, get the necessary confirmations for this analysis to enter the trade. Don't forget about risk and capital management. The responsibility for the transaction is yours and I have no responsibility for your failure to comply with your risk and capital management. 💬 Note: The red order block cannot stop the growth of the price of this currency and by 0.01 cents this currency will be pumped more than 400%. Be successful and profitable.
Eddy_Trade_

#YGG #YGGUSD #YGGUSDT #Analysis #Eddy A reversal structure has formed on the weekly and daily time frames, and the necessary confirmations have been given on the weekly time frame. Considering the structure formed on the above time frame, as well as the behavior of this currency in the past chart, it is expected that this currency will perform a good pump. I have identified the important supply and demand zones of the higher timeframe for you. This analysis is based on a combination of different styles, including the volume style with the ict style. Based on your strategy and style, get the necessary confirmations for this analysis to enter the trade. Don't forget about risk and capital management. The responsibility for the transaction is yours and I have no responsibility for your failure to comply with your risk and capital management. 💬 Note: The red order block cannot stop the growth of the price of this currency and by 1 dollar this currency will be pumped more than 400%. Be successful and profitable.
Eddy_Trade_

#GALA #GALAUSD #GALAUSDT #Analysis #Eddy A reversal structure has formed on the weekly and daily time frames, and the necessary confirmations have been given on the weekly time frame. Considering the structure formed on the above time frame, as well as the behavior of this currency in the past chart, it is expected that this currency will perform a good pump. I have identified the important supply and demand zones of the higher timeframe for you. This analysis is based on a combination of different styles, including the volume style with the ict style. Based on your strategy and style, get the necessary confirmations for this analysis to enter the trade. Don't forget about risk and capital management. The responsibility for the transaction is yours and I have no responsibility for your failure to comply with your risk and capital management. 💬 Note: The red order block cannot stop the growth of the price of this currency and by 10 cents this currency will be pumped more than 400%. Be successful and profitable.
Eddy_Trade_

#PENGU #PENGUUSDT #PENGUINS #LONG #AMD #PO3 #Setup #Analysis #Eddy PENGUUSDT.P Scalping Long Setup This Setup & Analysis is based on a combination of different styles, including the volume style with the ict style. (( AMD SETUP )) "PO3" Based on your strategy and style, get the necessary confirmations for this scalping setup to enter the trade. Don't forget risk and capital management. The entry point are indicated on the chart along with their amounts. The responsibility for the transaction is yours and I have no responsibility for not observing your risk and capital management. Note: The price can go much higher than the specified target and have a very good pump. Be successful and profitable.
Disclaimer
Any content and materials included in Sahmeto's website and official communication channels are a compilation of personal opinions and analyses and are not binding. They do not constitute any recommendation for buying, selling, entering or exiting the stock market and cryptocurrency market. Also, all news and analyses included in the website and channels are merely republished information from official and unofficial domestic and foreign sources, and it is obvious that users of the said content are responsible for following up and ensuring the authenticity and accuracy of the materials. Therefore, while disclaiming responsibility, it is declared that the responsibility for any decision-making, action, and potential profit and loss in the capital market and cryptocurrency market lies with the trader.