
EA_GOLD_MAN_COPY_TRADE
@t_EA_GOLD_MAN_COPY_TRADE

What symbols does the trader recommend buying?
Purchase History
پیام های تریدر
Filter
EA_GOLD_MAN_COPY_TRADE
XAUUSD BUY CONTINUATION SETUP – M15 BREAKOUT & PULLBACK
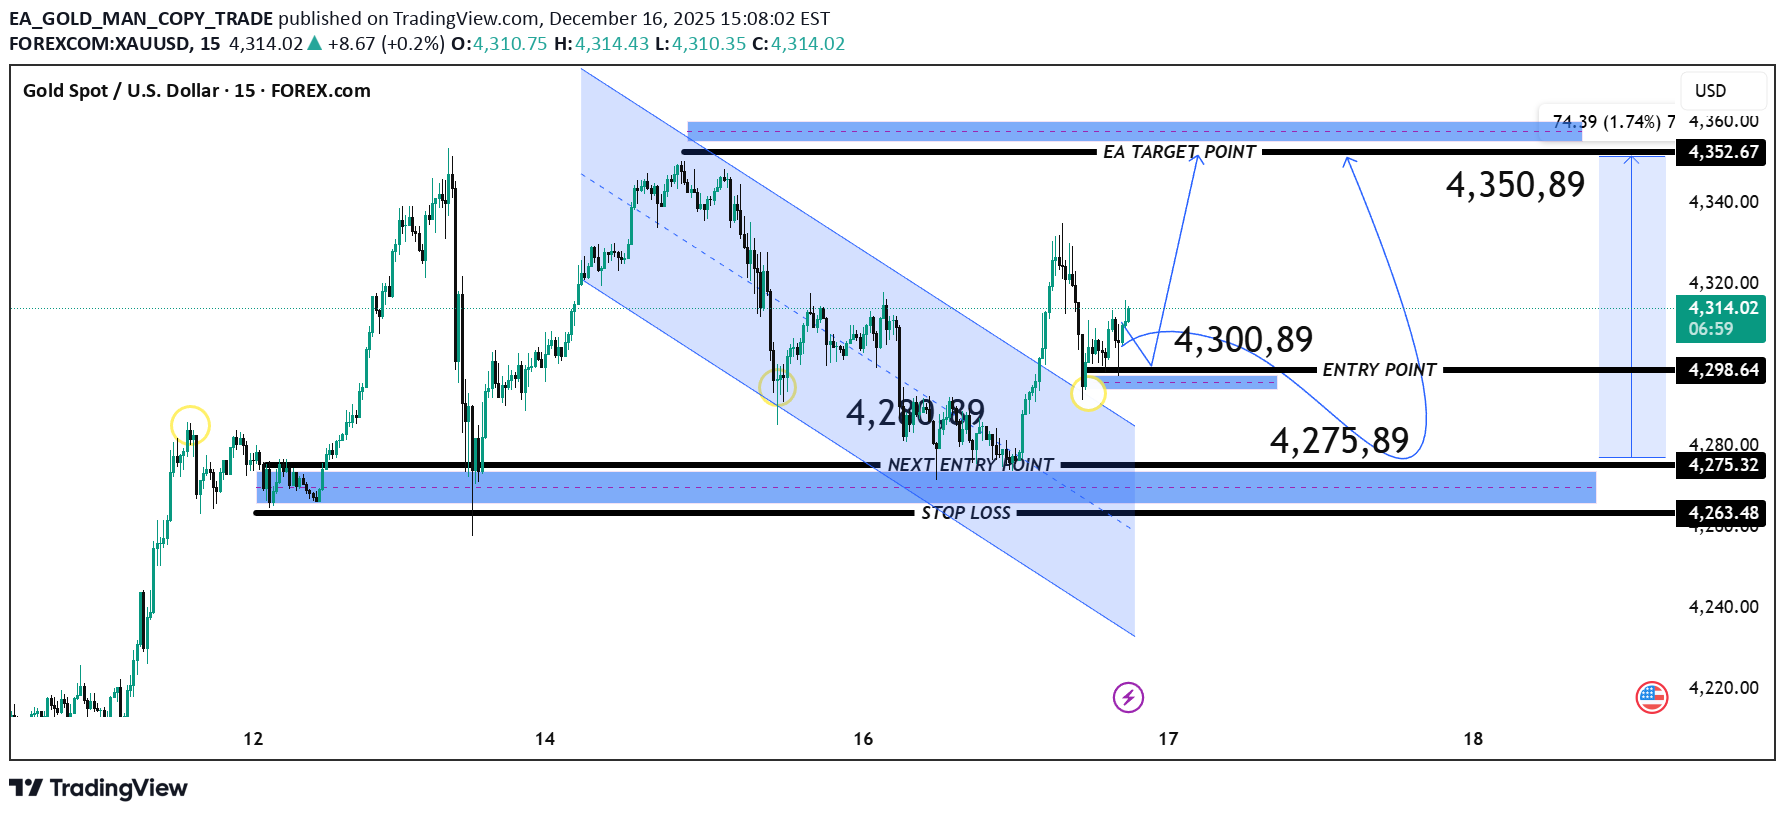
Key Levels (from chart) Primary Buy / Entry Zone: 4,298 – 4,301 Alternative (Next) Buy Zone: 4,275 – 4,280 Stop Loss: Below 4,263 Target / Resistance Zone: 4,350 – 4,360 Main target marked: 4,352 – 4,360 Trade Logic Breakout from the falling channel confirms trend reversal. Pullback respected former channel support → now acting as support. Strong reaction zones (yellow circles) indicate institutional demand. Risk–reward remains favorable toward the 4,35x liquidity area. Scenarios ✅ Bullish continuation: Hold above 4,298, price pushes toward 4,350+. ⚠️ Deeper retracement: Dip into 4,275–4,280 can be used for re-entry. ❌ Invalidation: Clean break and close below 4,263 weakens bullish setup. Conclusion SXF1! CGB1! CGF1! CRA1! SXM1! BSF1! FTX1! FBA1! As long as price stays above 4,275, Gold favors buy-the-dip strategies targeting the 4,35x resistance zone. Momentum currently supports upside continuation.
EA_GOLD_MAN_COPY_TRADE
XAU/USD M15 – Bearish Breakdown & Sell Setup Analysis
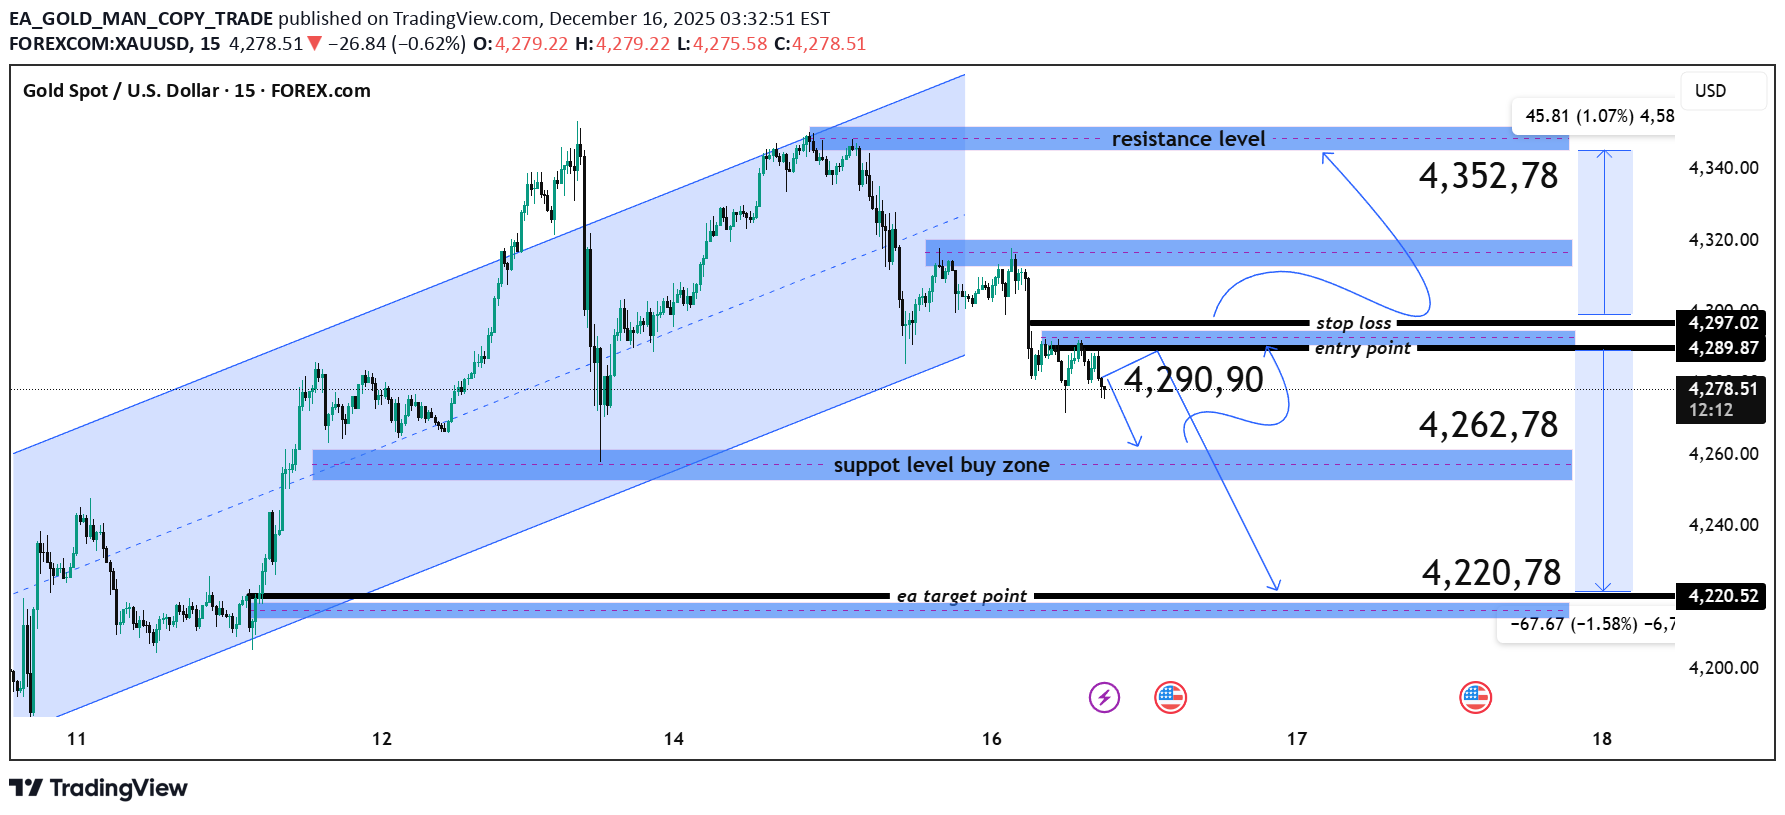
Key Levels Resistance: 4,340 – 4,352.78 Minor Resistance / Supply: 4,315 – 4,320 Entry Zone (Sell): ~4,290.90 Immediate Support: 4,262.78 Major Support / Target: 4,220.78 Trade Bias Bearish below 4,315–4,320 Prefer sell on pullback toward the entry zone. Trade Setup (Based on the chart) Sell Entry: ~4,290.90 Stop Loss: Above 4,297 – 4,300 (above intraday structure) Take Profit 1: 4,262.78 Take Profit 2 (EA target): 4,220.78 Confirmation to Watch Rejection candles (pin bar / bearish engulfing) near 4,290–4,320 Failure to reclaim the broken channel Increasing bearish momentum on lower highs Invalidation Sustained move above 4,320, especially a break toward 4,352, would weaken the bearish setup and open room for a corrective upside move.
EA_GOLD_MAN_COPY_TRADE
XAU/USD Bullish Continuation Setup (M15)
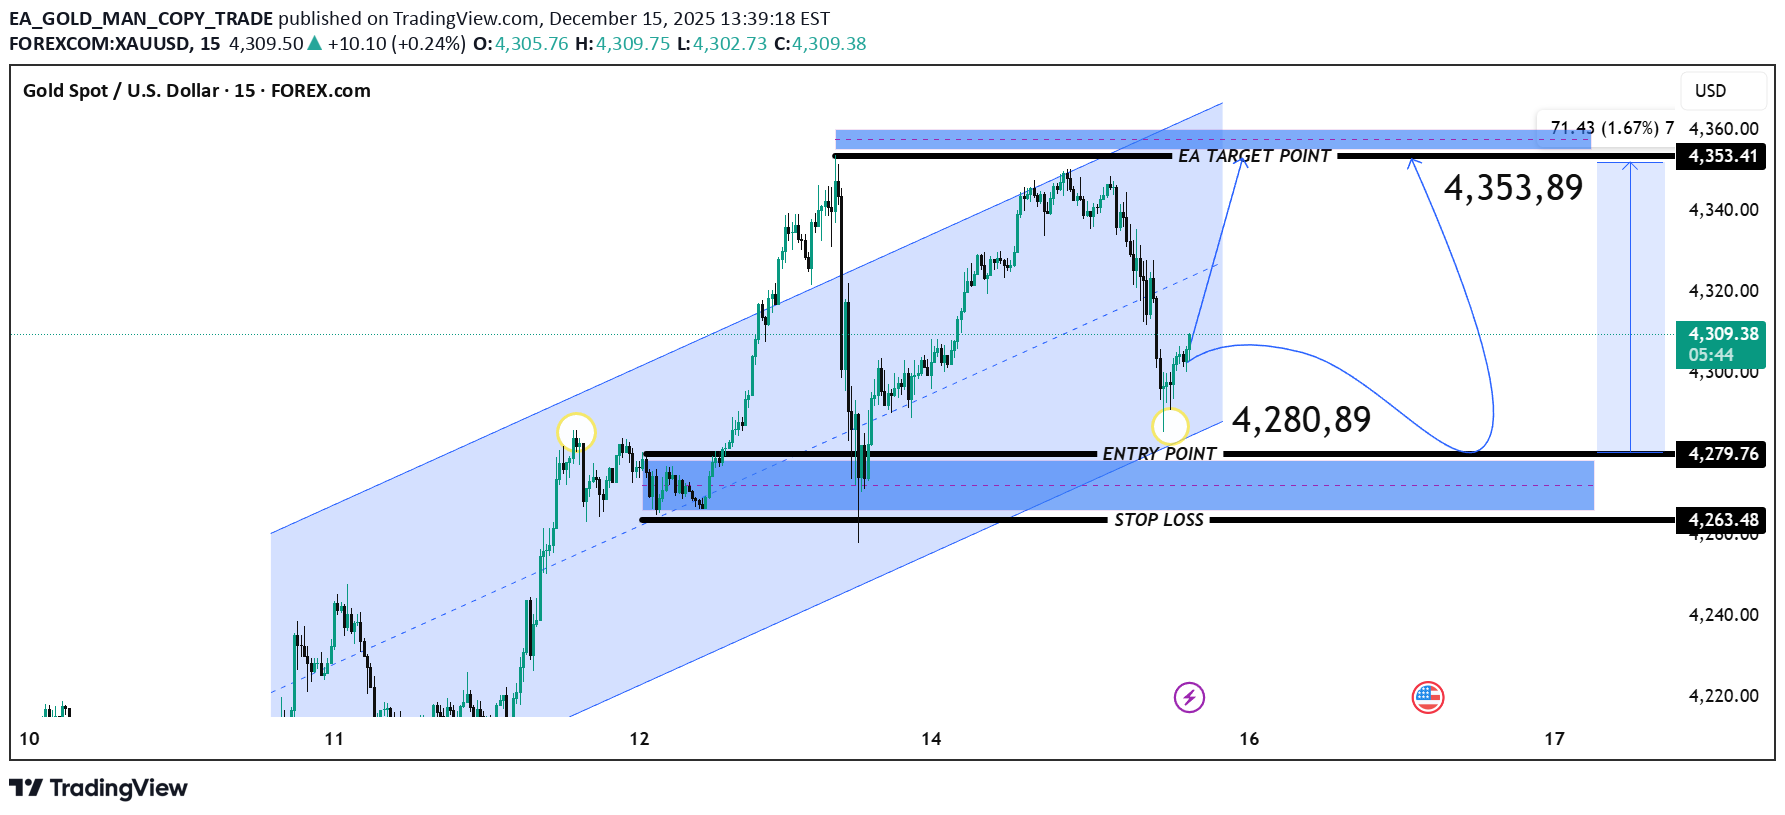
Key Support (Entry Zone): 4,279 – 4,281 Confluence of prior resistance turned support Mid-channel support Bullish demand zone highlighted on the chart Stop Loss: 4,263 Below demand zone and channel support Invalidation of bullish structure if broken Upside Target: 4,353 – 4,360 Previous high / supply zone Upper boundary of the bullish channel Price Expectation: CAU1! XAUUSD GC1! MCS1! CUS1! CEU1! MGC1! CIN1! UCN1! UIN1! CAU1! A dip into the 4,280 area followed by bullish continuation toward 4,353+ if support holds. Risk–Reward: Favorable (approx. 1:3+), suitable for intraday continuation trades. Bias: 📈 Bullish above 4,263 Invalidation: Clear M15 close below 4,263
EA_GOLD_MAN_COPY_TRADE
XAUUSD15M Resistance Rejection Sell Setup
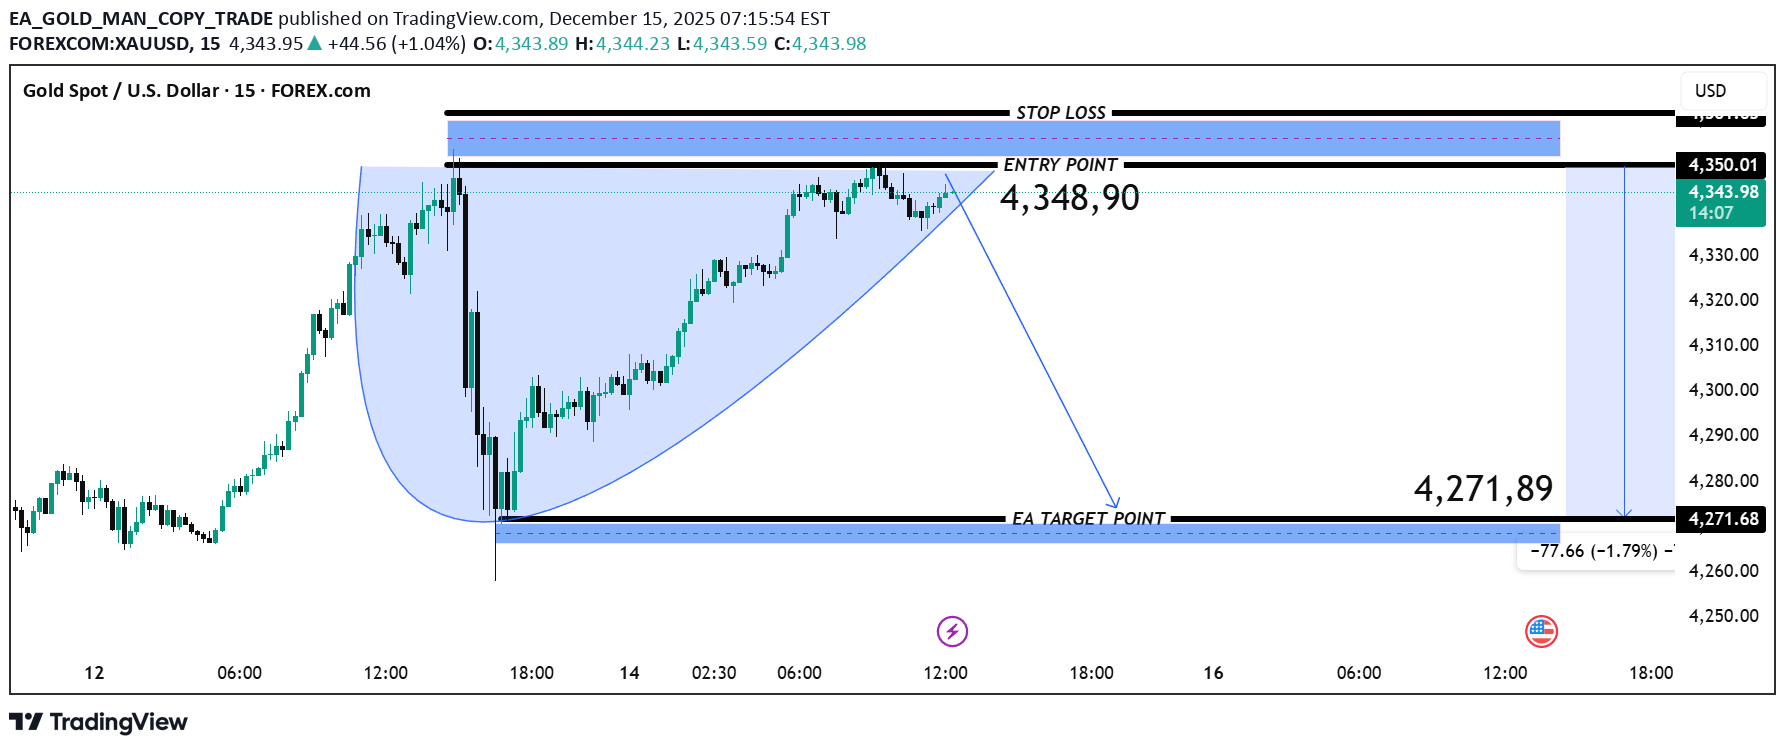
XAUUSD) – 15-Min Chart Analysis Current action is pressing into a major supply / resistance zone around 4,348 – 4,350, where previous selling pressure appeared. Momentum is weakening near the highs → signs of exhaustion at resistance. Trade Idea Shown (EA Setup) Entry Point: ~4,348.90 Bias: SELL (counter-trend from resistance) Stop Loss: Above the supply zone (around 4,360+ area) Target (EA Target Point): 4,271.89 Technical Reasoning 1. Strong Resistance Zone Price rejected multiple times near 4,350. Liquidity likely resting above highs → potential stop-hunt then reversal. 2. Rising Wedge / Ending Structure Higher lows but slowing upside momentum. Typical bearish continuation or corrective pullback pattern. 3. Measured Move Projection Breakdown from the structure projects a move toward the previous demand zone near 4,270. Risk–Reward Approximate downside: −77 points (−1.79%) Favorable RR if rejection confirms with bearish candles Confirmation to Watch Bearish engulfing / strong rejection wick at 4,348–4,350 Break and close below short-term support inside the structure Increasing bearish volume on rejection Invalidation Clean 15-min close above resistance and acceptance above the zone → setup fails, continuation upside likely. Summary This is a sell-from-resistance corrective trade, not a trend reversal. Best executed after confirmation, not blindly at resistance. Target aligns well with prior demand and structure support. UIN1! MCS1! CAU1! UCN1! CIN1! CUS1! CEU1! MGC1!
EA_GOLD_MAN_COPY_TRADE
سیگنال خرید طلا (XAU/USD): صعود ادامهدار با ریسک به ریوارد عالی!
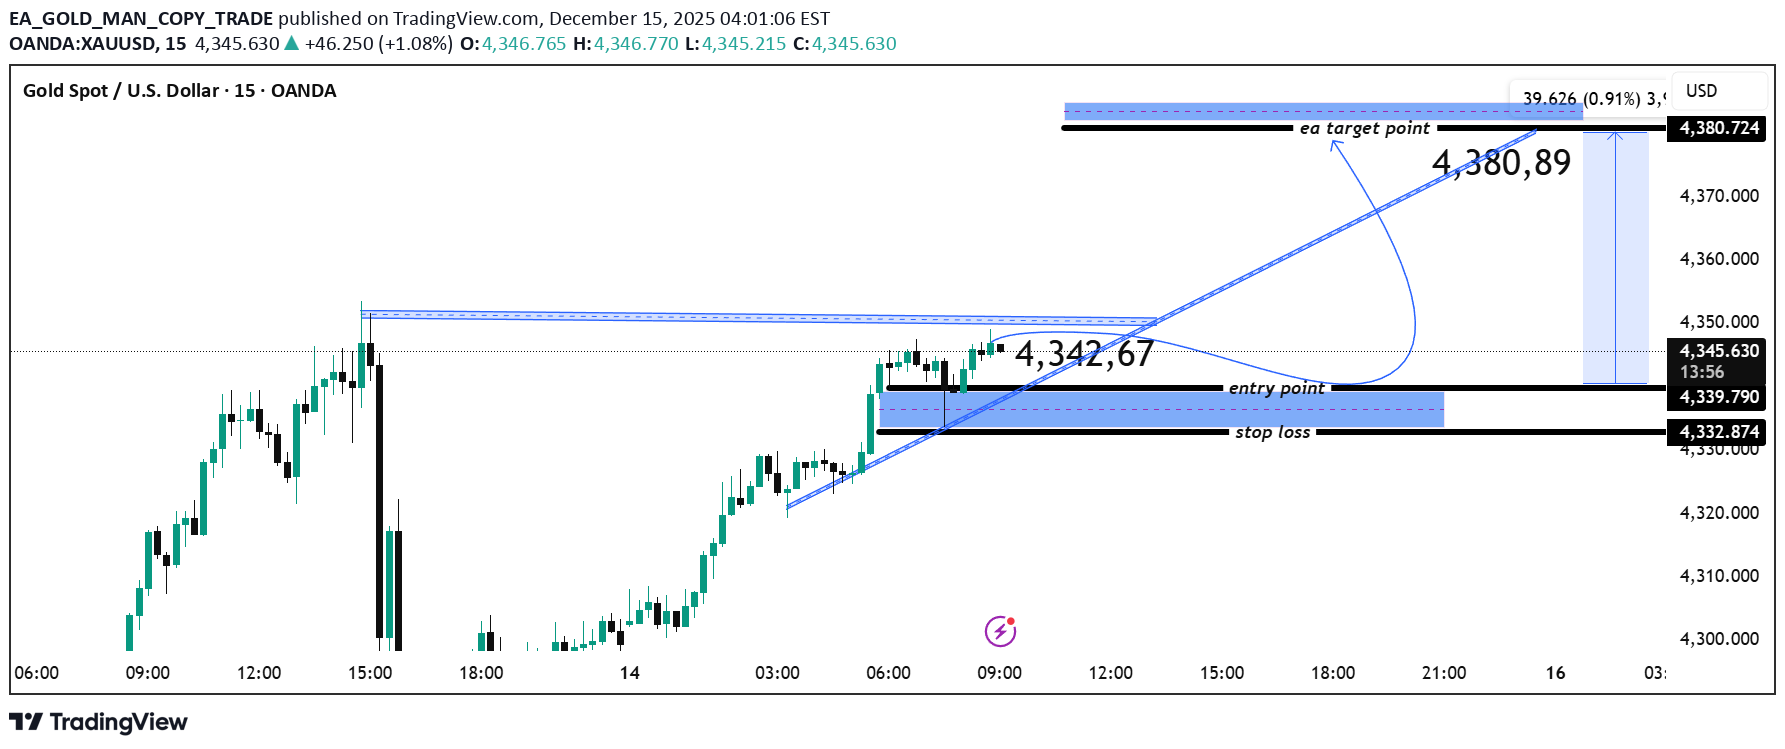
Key levels (from chart) Entry zone: ~4,339.8 – 4,342.7 Stop loss: ~4,332.9 (below demand / structure low) Target (TP): ~4,380.7 (previous supply / projected move) Technical confluence Rising trendline support holding price. Entry aligned with a bullish pullback into demand. Target aligns with prior resistance / liquidity zone. Risk–reward is favorable (≈ 1:4+). Bias & plan Bullish continuation while price holds above the entry support zone. Best confirmation: bullish M15 close or momentum expansion from the entry area. Invalidation: clean break and close below 4,332.9. If you want this converted into a clear trade signal (BUY / SL / TP) or translated into a specific language (e.g., Russian, Arabic, Turkish, etc.), tell me which format and language you prefer.
EA_GOLD_MAN_COPY_TRADE
BTC/USD Bullish Channel – Buy Setup Toward 94,640
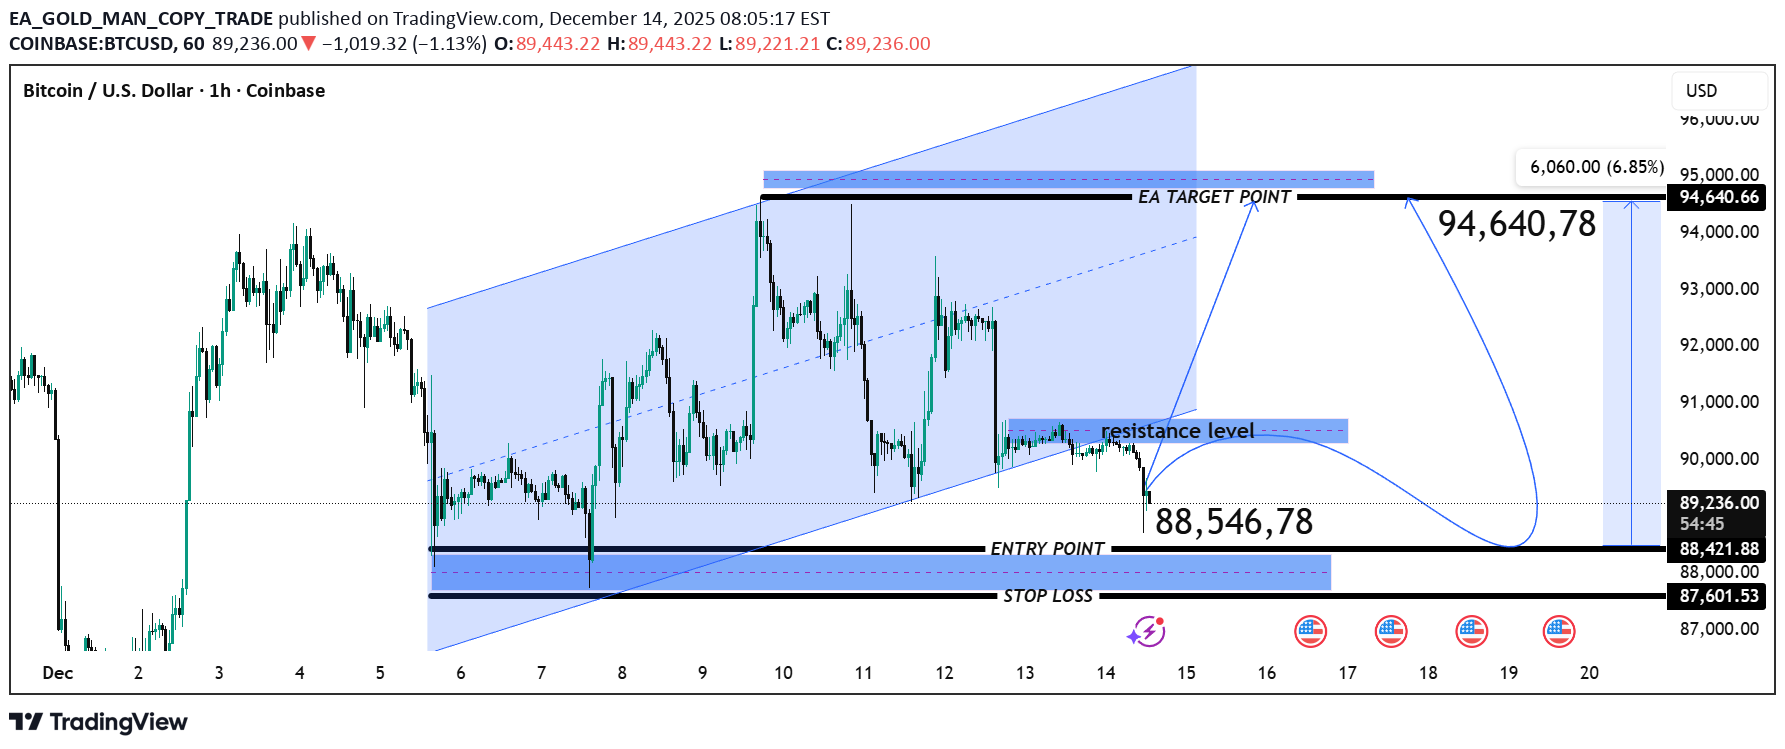
BTC/USD – Technical Analysis (1H, Coinbase) Market Structure Price is moving inside a rising channel, but recent candles show rejection from mid–upper channel. Short-term momentum has weakened after failing to break the highlighted resistance zone ~90,000–90,500. Key Levels Resistance: 90,000 – 90,500 (intraday supply / rejection area) Major Target / Upper Resistance: 94,640 Support (Entry Zone): 88,546 – 88,420 Critical Stop Zone: 87,600 Scenario 1 – Bullish Continuation (Primary) A hold above 88,500 and bullish reaction from support can trigger upside continuation. Break and close above 90,500 opens the path toward: 92,500 94,640 (EA Target Point) Scenario 2 – Bearish Pullback (Short-term Risk) Failure to hold 88,500 may push price toward: 87,600 (key invalidation / stop-loss area) A clean break below this level would invalidate the bullish channel structure. Trade Idea (Based on Chart) Buy Zone: 88,500 ± Stop Loss: 87,600 Targets: TP1: 90,500 TP2: 92,500 TP3: 94,640 Bias FW201! FW401! FACP1! FDNP1! FPCO1! GC1! MGC1! Bullish overall, but short-term corrective pressure remains until resistance is broken with volume.
EA_GOLD_MAN_COPY_TRADE
ریزش قریبالوقوع بیت کوین: از ۹۲ هزار به ۸۴ هزار با این استراتژی ورود دقیق!
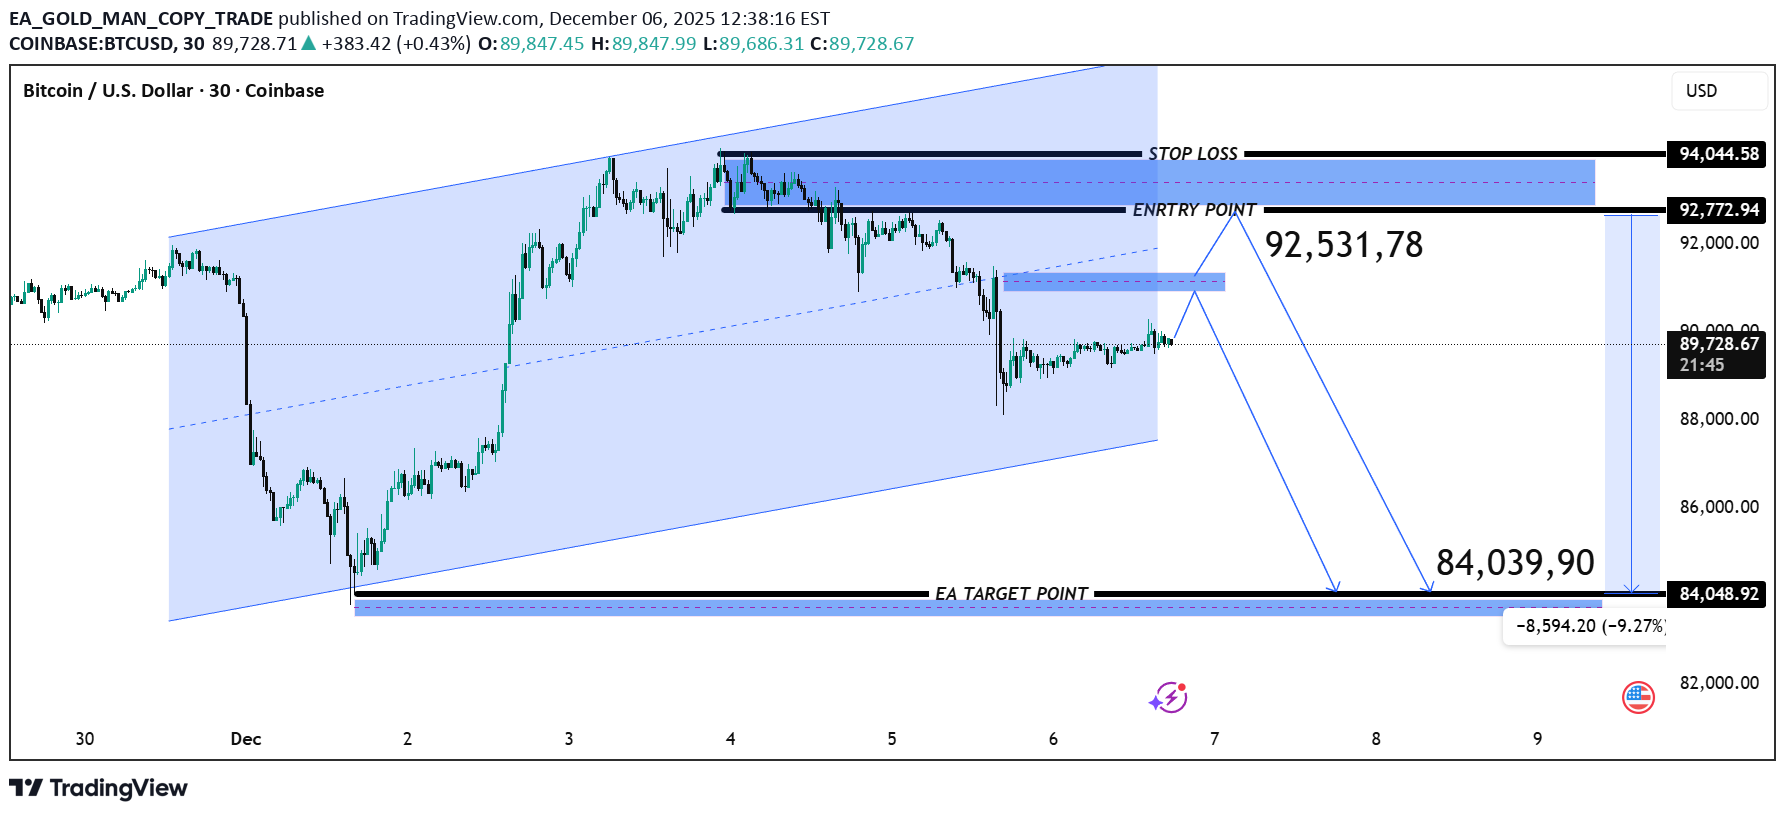
Entry Point: 92,531 – 92,772 USD This area aligns with: Previous swing highs A retest of broken structure A strong supply imbalance This makes it a high-probability short entry zone. ⛔ Stop-Loss Zone SL: 94,044 USD This is above the supply zone and above the local channel resistance — a safe invalidation level. 🎯 Bearish Targets Your projected downside target aligns with the channel bottom + demand zone: EA Target Point: 84,039 – 84,048 USD This target is reasonable because: It is the lower boundary of the ascending channel It matches a previously strong accumulation zone It matches a measured move from the supply zone rejection A sell from 92,5k → target 84k offers a strong risk-to-reward ratio. 📌 Summary GC1! BTCUSD BTCUSDT BTCUSD BTCUSDT.P ETHUSD ETHUSDT BTCUSD BTCUSDT.P BTC.D USDT.D XRPUSD Bias: Bearish correction Expect price to retrace upward first into the 92.5k–92.7k zone Then a strong rejection may push BTC toward 84k The structure aligns with supply/demand, channel analysis, and liquidity sweeps
EA_GOLD_MAN_COPY_TRADE
منطقه خرید بیت کوین فعال شد: هدف بعدی رسیدن به ۱۲۶ هزار دلار!
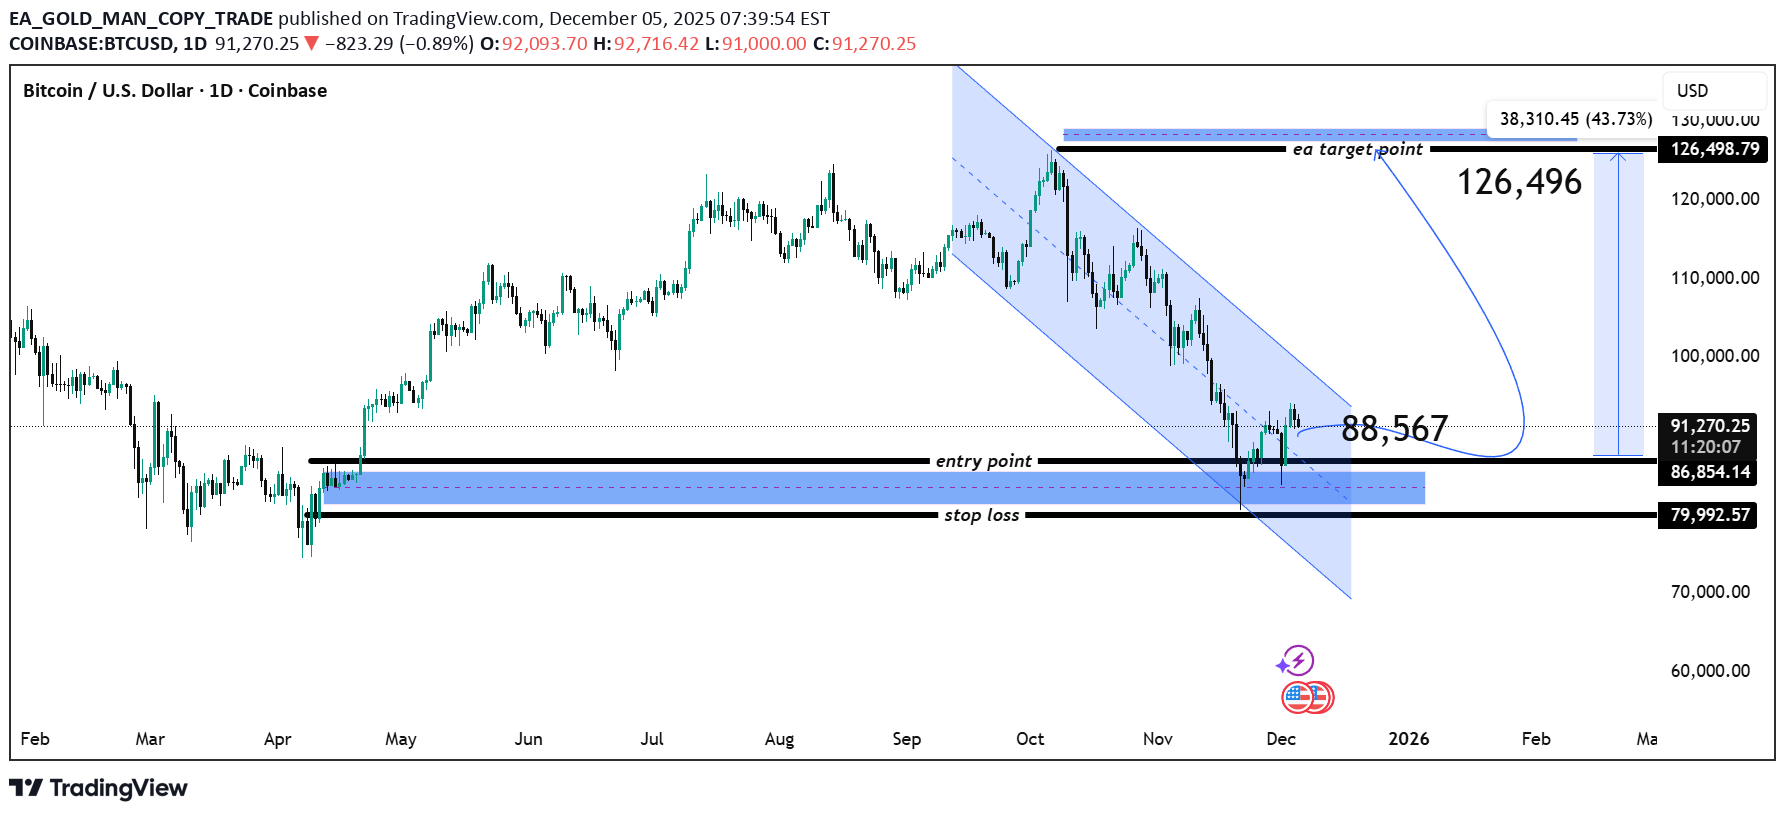
Support Zone (Demand Zone) 86,854 – 79,992 USD This is the blue support region on your chart. Inside this zone: Entry Point: ~ 86,854 USD Stop Loss: ~ 79,992 USD BTC recently retested this zone and bounced, showing buyers are active here. Resistance Levels 88,567 USD Current local resistance. 126,496 USD Major target zone shown at the top of the chart. Labeled as ea target point. 3. Trend Outlook BTC is trying to break the bearish channel to the upside. If price holds above 86,854, a bullish reversal becomes likely. A clean breakout above 88,567 strengthens bullish momentum. 4. Upside Target 126,496 USD (main projected target) That is a ~43% upside move from the entry level. 5. Downside Risk Break below 79,992 USD would invalidate the bullish scenario. This is your defined stop-loss level. 6. Price Action Summary BTC is bouncing from a major support zone. Price is challenging channel resistance. If BTC confirms a breakout, a move toward 100k → 120k → 126k becomes realistic.
EA_GOLD_MAN_COPY_TRADE
بیت کوین در آستانه انفجار صعودی؛ قیمت به ۹۳۱۰۰ دلار میرسد؟ (تحلیل تکنیکال)
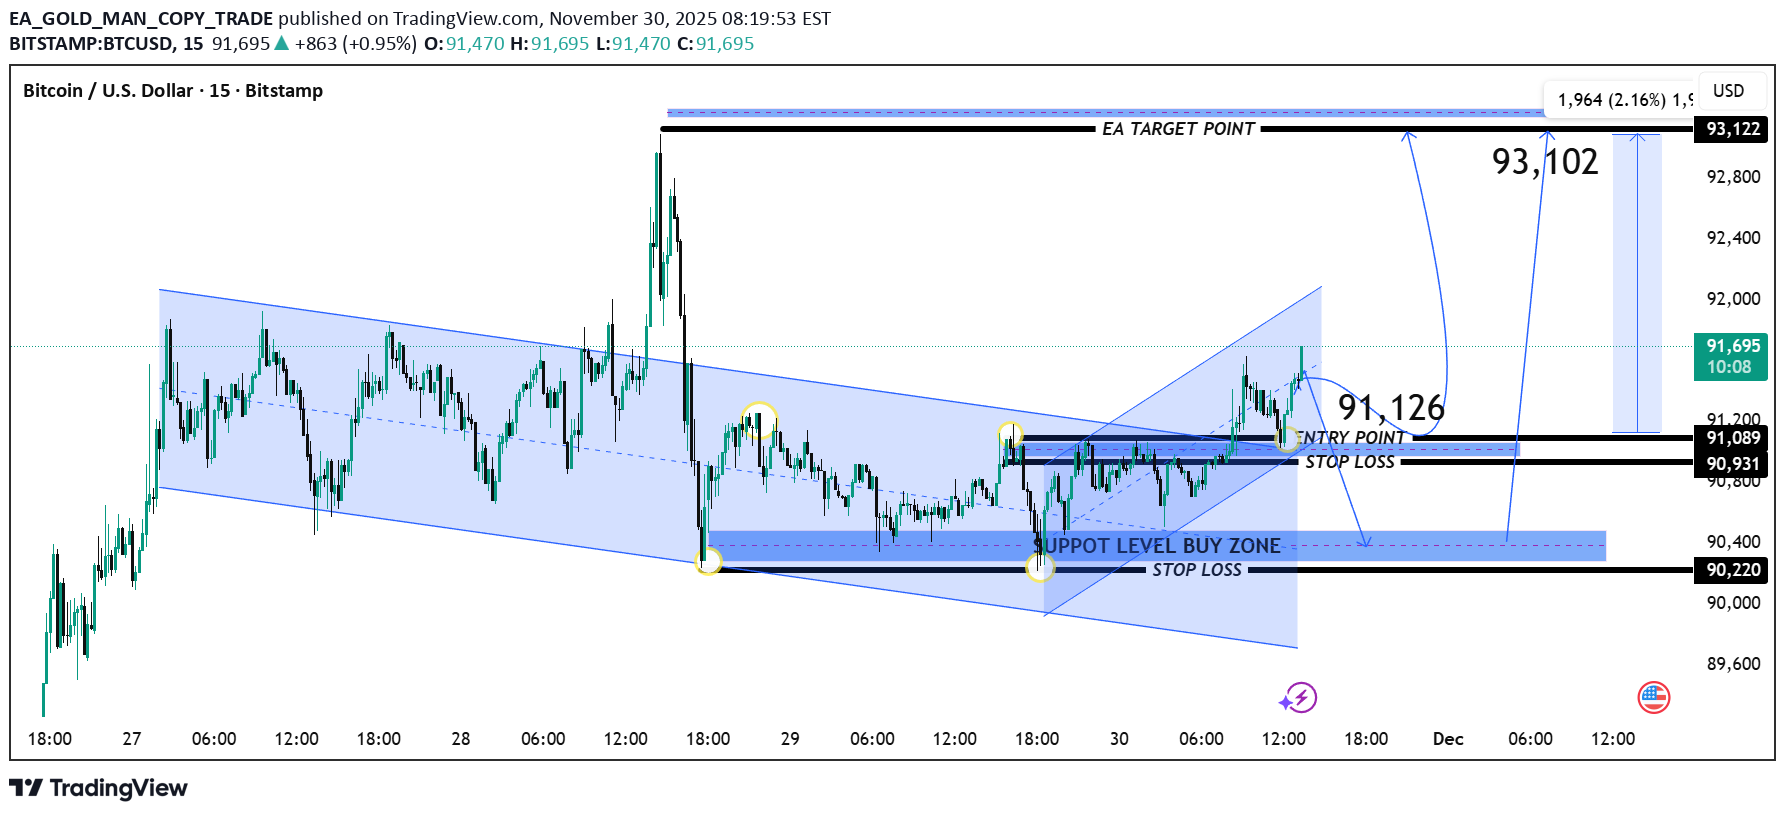
Entry Point 91,126 This is the suggested buy re-entry point after the breakout. ✔ Immediate Support Zone 91,089 – 90,931 This zone is highlighted as a bullish retest area. Good demand structure — strong chances of buyers stepping in. ✔ Major Support Level (Buy Zone) 90,220 This is the deeper correction level. If price reaches here, it becomes a high-value buy zone. ✔ Stop Loss Below 90,931 Conservative SL: 90,931 Deeper SL for larger swings: 90,220 🎯 Target Levels TP1: 93,102 Short-term bullish target based on the measured move. TP2 (EA TARGET POINT): 93,122 Full extension target from the breakout projection. 📈 Trend Outlook Bullish Scenario (Most Likely Based on Chart Structure) Price retests 91,126 / 91,089–90,931 & holds. Buyers push toward 93,102 → 93,122. Structure supports continuation breakout after pullback. Bearish Scenario If BTC breaks below 90,931, correction extends toward 90,220. Loss of 90,220 would invalidate bullish setup. 📌 Summary DirectionStatus TrendTurning Bullish (after channel breakout) BITCOIN Best Buy Zone91,126 → 90,931 BTC Deep Buy Zone90,220 Targets93,102 → 93,122 Stop LossBelow 90,931 (or deeper 90,220) BTCUSDT BTCUSD BTCUSD BTCUSD BTCUSDT.P BTCUSD BTCUSD BTCUSD BTCUSD
EA_GOLD_MAN_COPY_TRADE
احتمال سقوط اتریوم تا ۲۴۹۰ دلار: تحلیل روند نزولی و نقاط کلیدی معامله
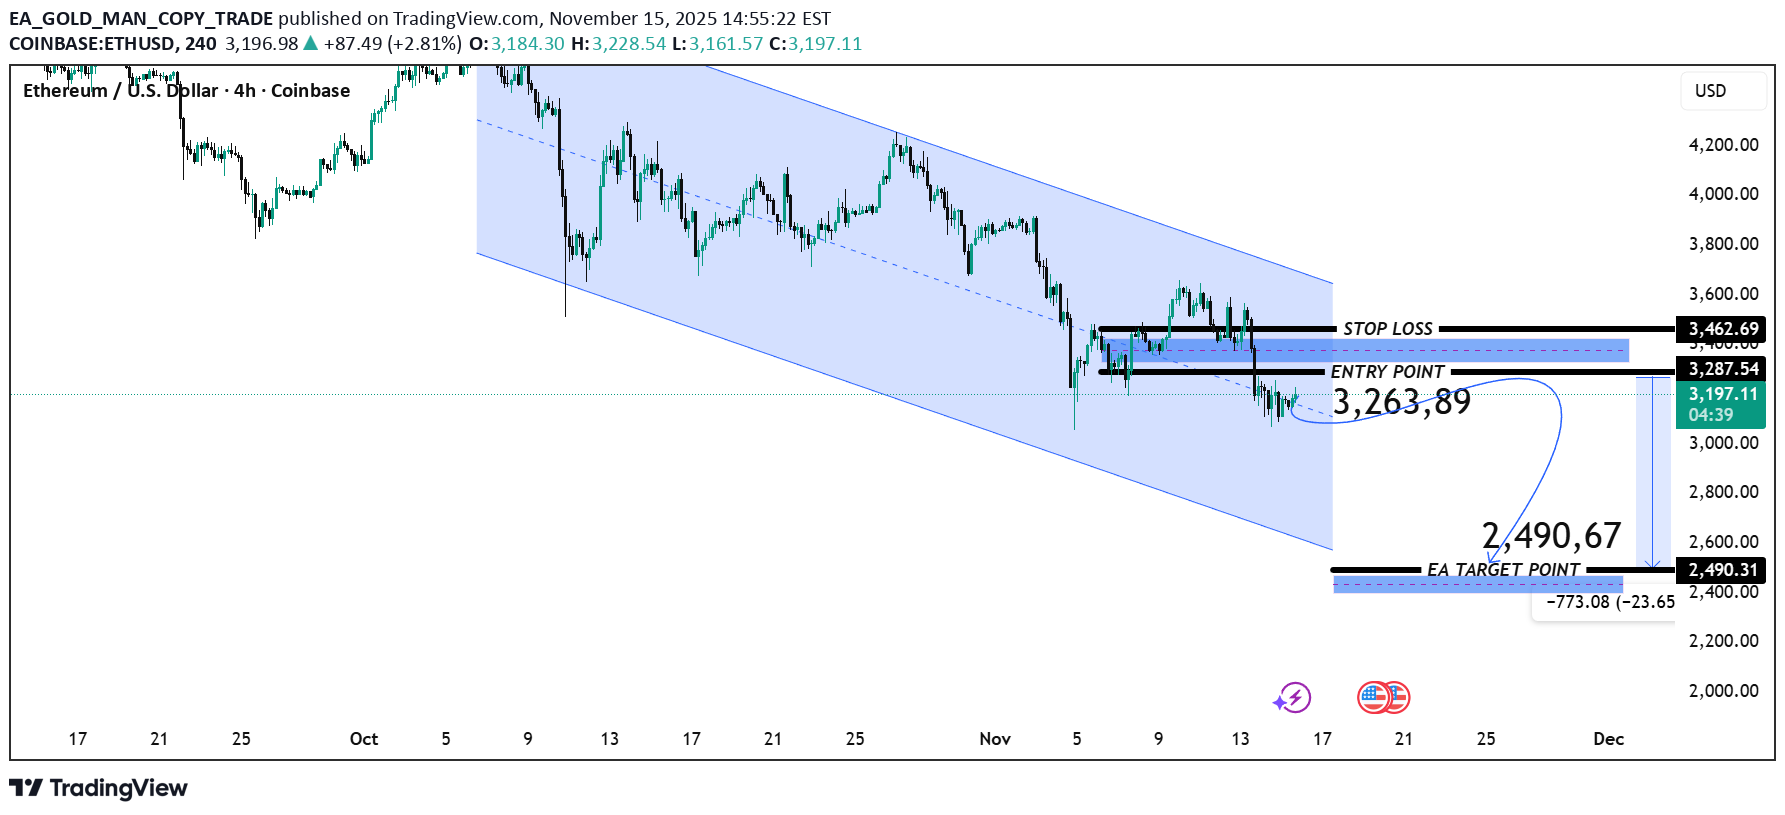
Trend Structure The chart shows ETH/USD moving inside a descending channel, indicating a broader bearish trend. Price has recently rejected the upper boundary of the channel and remains under selling pressure. Key Levels Entry Point: $3,263.89 Marked as a sell-entry zone where price previously broke down and retested. Stop Loss: $3,462.69 Positioned above the upper liquidity zone and channel resistance. Target Point (Take Profit): $2,490.67 Located near the lower boundary of the descending channel and previous demand zone. Market Behavior ETH is currently trading near $3,193, just under the entry zone. Price action suggests a bearish continuation with lower highs forming. The retest of the broken structure confirms seller strength. Trade Outlook Bias: Bearish Rationale: Price is respecting the descending channel. A failed breakout attempt from resistance shows buyers are weak. Clear liquidity zones above and below support a short position setup. Expected Move If price stays below $3,263, ETH is likely to continue downward toward the $2,490 target. BTCUSD BTCUSDT BTCUSDT.P ETHUSD BTCUSD BTC.D ETHUSDT BTCUSD BTCUSD ETHUSD LTCUSD BCHUSD
Disclaimer
Any content and materials included in Sahmeto's website and official communication channels are a compilation of personal opinions and analyses and are not binding. They do not constitute any recommendation for buying, selling, entering or exiting the stock market and cryptocurrency market. Also, all news and analyses included in the website and channels are merely republished information from official and unofficial domestic and foreign sources, and it is obvious that users of the said content are responsible for following up and ensuring the authenticity and accuracy of the materials. Therefore, while disclaiming responsibility, it is declared that the responsibility for any decision-making, action, and potential profit and loss in the capital market and cryptocurrency market lies with the trader.