Technical analysis by EA_GOLD_MAN_COPY_TRADE about Symbol ETH: Sell recommendation (11/15/2025)

EA_GOLD_MAN_COPY_TRADE
احتمال سقوط اتریوم تا ۲۴۹۰ دلار: تحلیل روند نزولی و نقاط کلیدی معامله
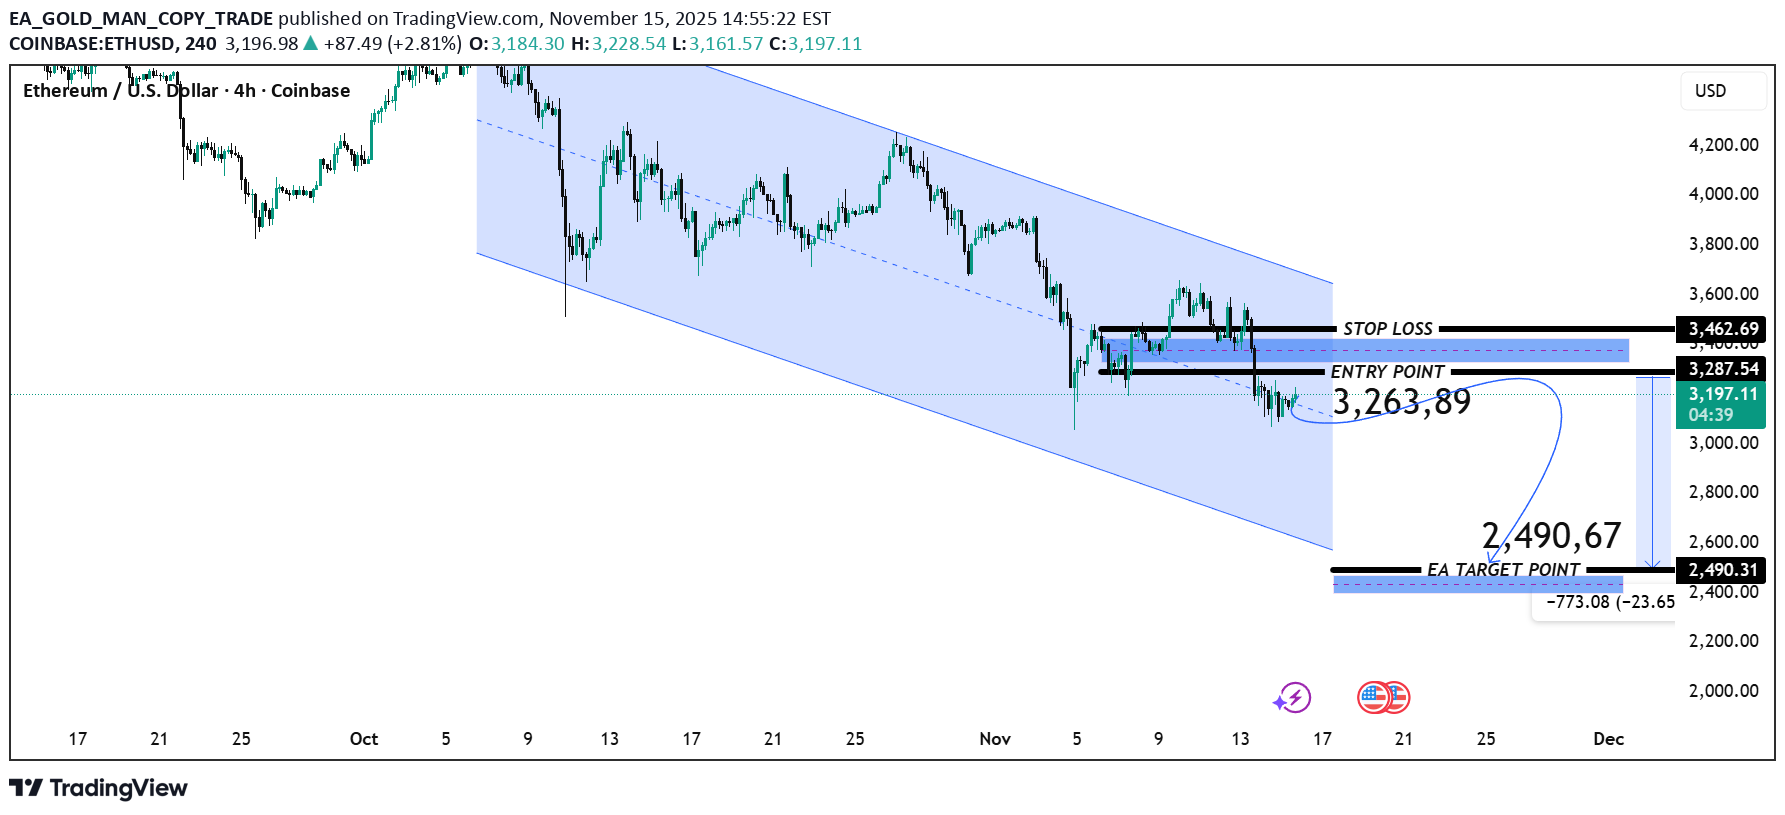
Trend Structure The chart shows ETH/USD moving inside a descending channel, indicating a broader bearish trend. Price has recently rejected the upper boundary of the channel and remains under selling pressure. Key Levels Entry Point: $3,263.89 Marked as a sell-entry zone where price previously broke down and retested. Stop Loss: $3,462.69 Positioned above the upper liquidity zone and channel resistance. Target Point (Take Profit): $2,490.67 Located near the lower boundary of the descending channel and previous demand zone. Market Behavior ETH is currently trading near $3,193, just under the entry zone. Price action suggests a bearish continuation with lower highs forming. The retest of the broken structure confirms seller strength. Trade Outlook Bias: Bearish Rationale: Price is respecting the descending channel. A failed breakout attempt from resistance shows buyers are weak. Clear liquidity zones above and below support a short position setup. Expected Move If price stays below $3,263, ETH is likely to continue downward toward the $2,490 target. BTCUSD BTCUSDT BTCUSDT.P ETHUSD BTCUSD BTC.D ETHUSDT BTCUSD BTCUSD ETHUSD LTCUSD BCHUSD