
DollarsMagnet
@t_DollarsMagnet

What symbols does the trader recommend buying?
Purchase History
پیام های تریدر
Filter
DollarsMagnet
XAUUSD at Major Resistance! | Bearish Pullback Levels Explained.
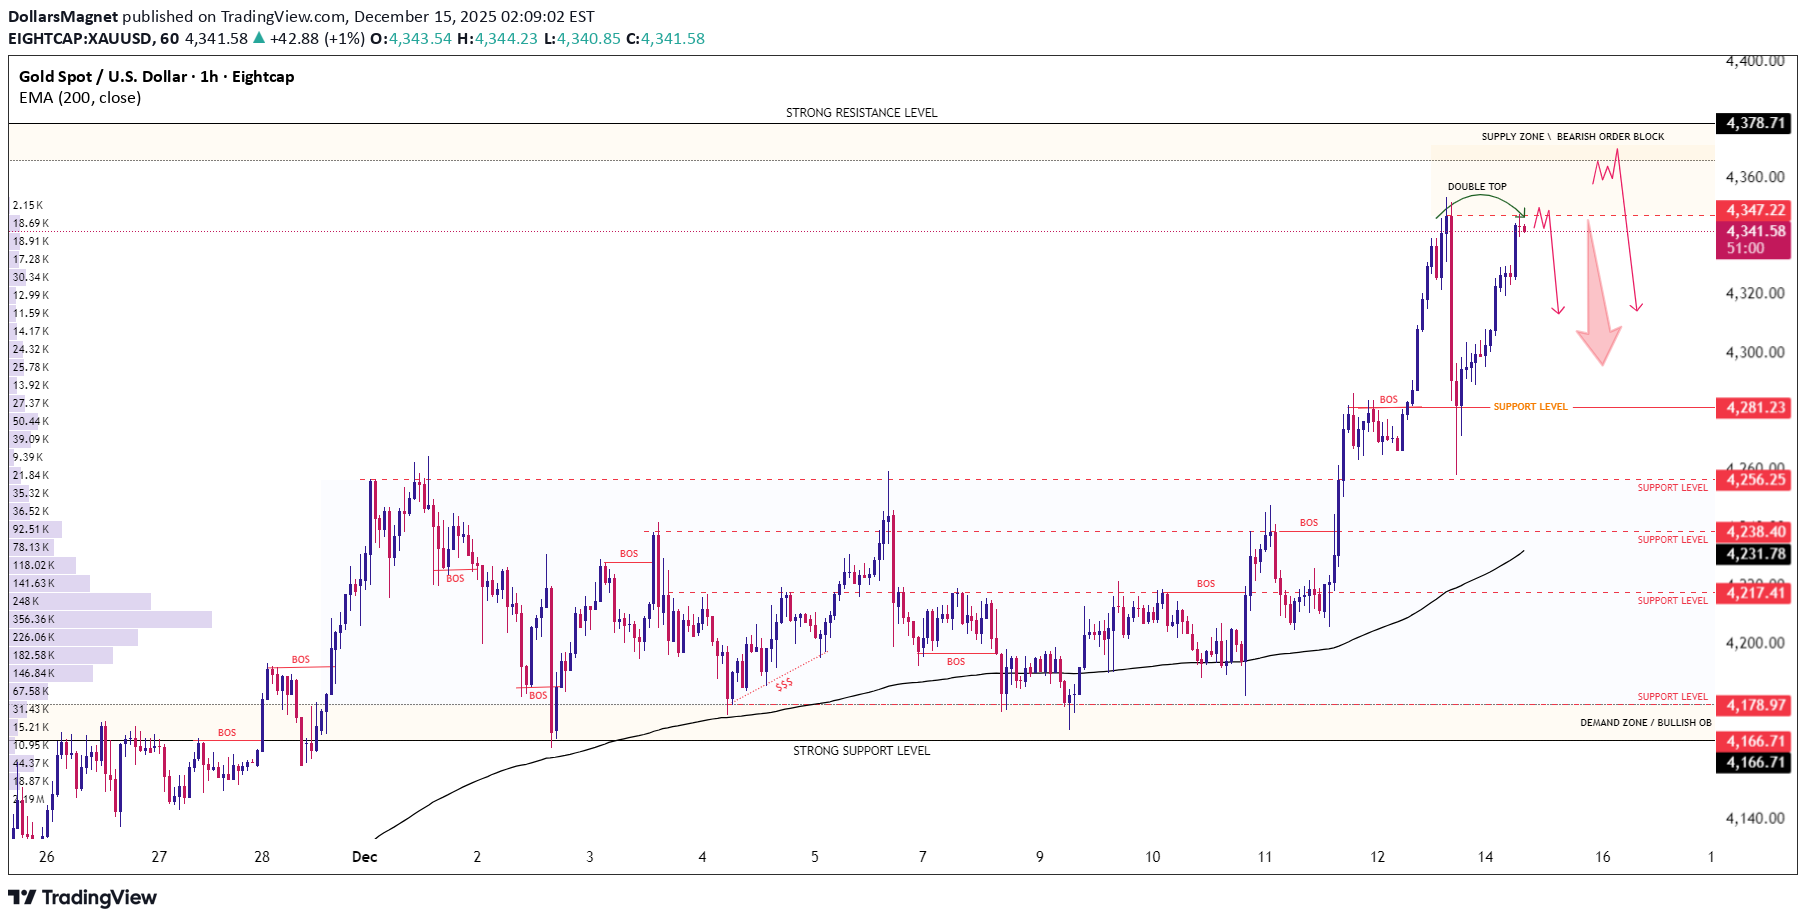
XAUUSD (Gold) – Professional Market Forecast & Key Levels XAUUSD Gold is currently trading near a strong resistance/supply zone, where price has formed a potential double top on the H1 timeframe. This structure, combined with repeated rejections from the upper zone, suggests weak bullish continuation and increasing downside risk unless price breaks and holds above resistance with strong momentum. 📊 Market Direction Outlook Primary Bias: Bearish pullback / corrective move Alternate Scenario: Bullish continuation only if price breaks and sustains above major resistance Price is extended after an impulsive rally and reacting inside a bearish order block (supply zone). Failure to break higher increases the probability of a retracement toward lower support levels. 🔑 Key Resistance Levels - 4,360 – 4,378 → Strong resistance / Supply zone - 4,347 → Intraday resistance (double-top area) A clean breakout and hold above 4,378 would invalidate the short-term bearish view. 🛡️ Key Support Levels & Downside Targets - 4,281 → First support (BOS level) - 4,256 → Minor support - 4,238 – 4,230 → EMA 200 + structure support - 4,217 → Strong intraday support - 4,178 → Major support - 4,166 → Demand zone / bullish order block These levels are potential reaction zones where price may pause or reverse. 🎯 Trading Plan Insight - Shorts are favored below resistance, especially on rejection signals. - Partial profits should be secured at each support level. - Bulls should wait for confirmed breakout + retest before entering longs. 🧠 Pro Trader Tips - Trade levels, not emotions - Always wait for confirmation at supply & demand zones - Protect capital with strict risk management - Let the market come to your level – patience pays If this analysis adds value to your trading: 👍 Like 💬 Comment your bias 🔔 Follow for consistent market structure insights
DollarsMagnet
بیت کوین منفجر شد: خروج قدرتمند از کانال نزولی و اهداف جدید صعودی!
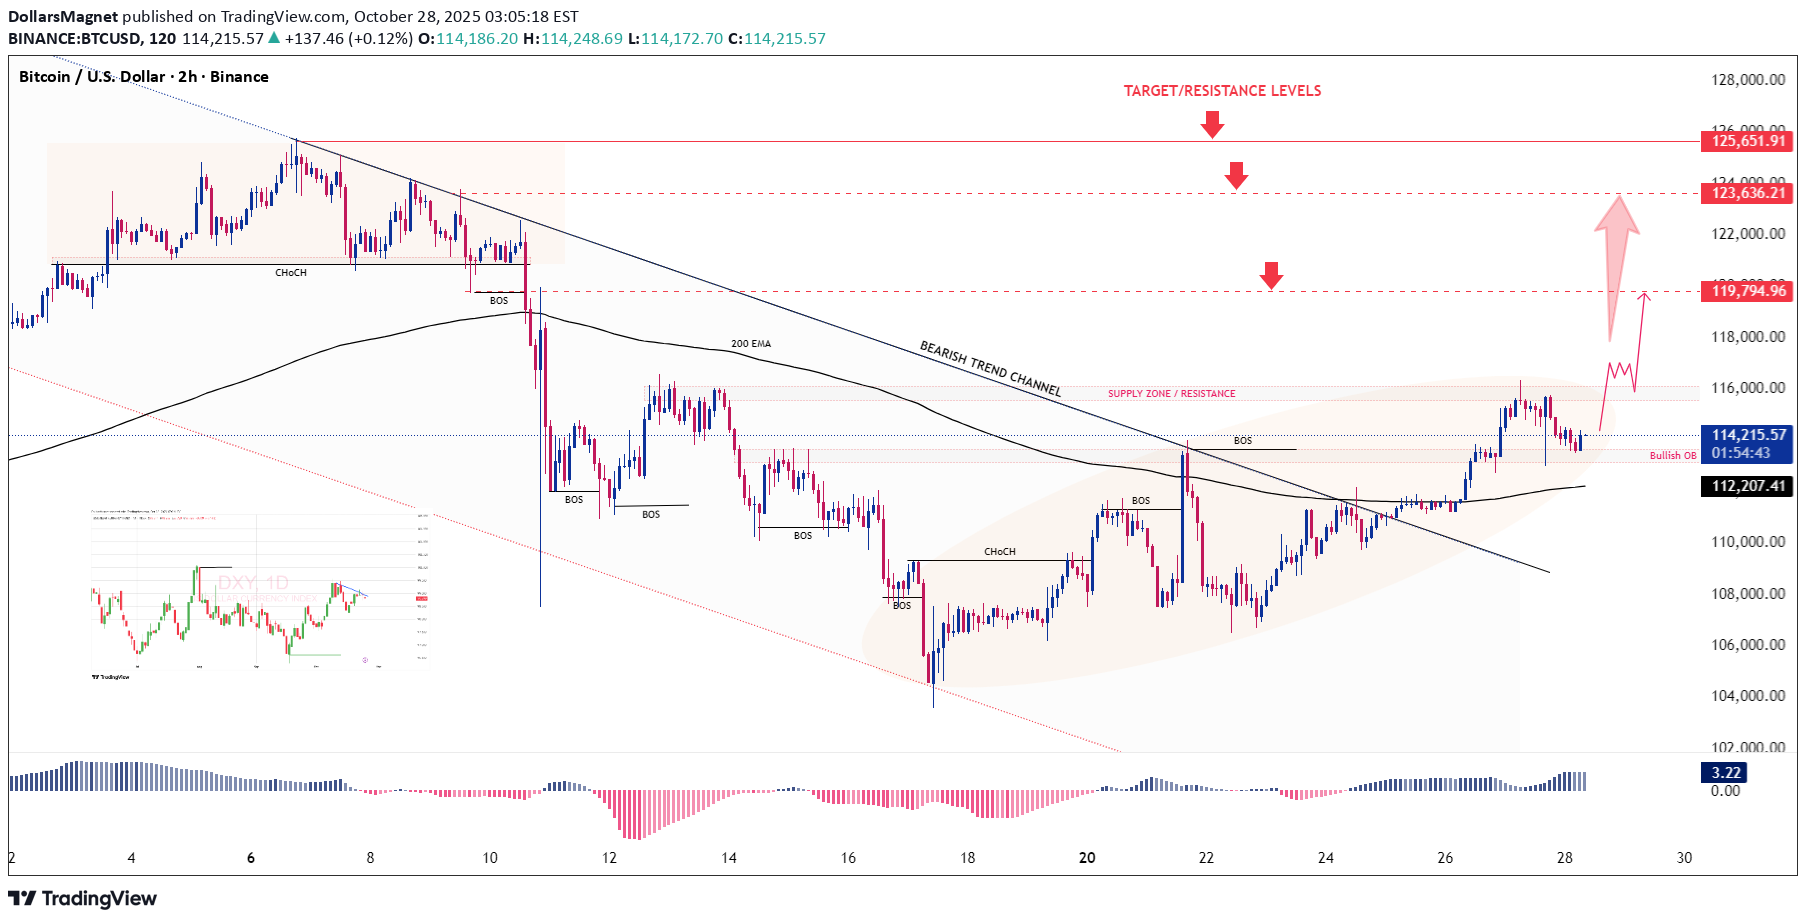
🚀 Bitcoin Technical Outlook (2H Chart – October 28, 2025): BTCUSD has successfully broken out of its long-term bearish trend channel, showing strong bullish momentum and reclaiming key structure levels above the 200 EMA. After a clean retest of the breakout zone, the market is preparing for a potential continuation toward higher resistance targets. 📊 Key Technical Highlights 🔹 Pattern Structure: Breakout from Bearish Trend Channel followed by retest confirmation 🔹 BOS & ChoCH: Multiple Breaks of Structure and Change of Character confirm momentum reversal from bearish to bullish 🔹 Support Zone: Bullish Order Block (OB) near $113,500 – $114,000 holding well 🔹 Resistance/Supply Zone: $115,800 – $116,500 near 200 EMA tested — next move likely to challenge upper resistance zones 🔹 Momentum: Bullish momentum building, confirmed by MACD histogram shift to positive 🎯 Bullish Scenario If Bitcoin continues to hold above $114,000, buyers could target the following resistance levels: Target 1: $119,795 (first major resistance) Target 2: $123,636 (key supply zone) Target 3: $125,652 (major target / resistance zone from previous highs) A clear close above $116,500 will strengthen bullish momentum and validate the upside continuation setup. ⚠️ Bearish Scenario If BTC fails to sustain above the Bullish Order Block ($113,500), a pullback toward $112,200 – $111,500 could occur before another attempt higher. Losing $111,500 would invalidate the bullish structure short-term. 🧭 Technical Summary Bitcoin has transitioned from a bearish structure into a bullish reversal phase, confirmed by a breakout retest and BOS signals. The market bias remains bullish while trading above $114K, with upside potential toward the $120K–$125K range in the coming sessions. 💬 If you enjoyed this analysis — Like, Comment & Follow for more premium insights, technical breakdowns, and weekly forecasts! Stay patient, trade with confirmation, and always manage your risk. #Bitcoin #BTCUSD #CryptoAnalysis #TechnicalAnalysis #PriceAction #Breakout #OrderBlock #BullishReversal #TradingView #CryptoSignalsTRADE UPDATE: BTC/USD – Trade Activated ✅ 🚀 BTC/USD Buy Trade Activated around $114,000 zone after confirming bullish structure and breakout retest.
DollarsMagnet
ریزش طلا: پایان کفش دوقلو و شروع حرکت نزولی در مثلث متقارن!
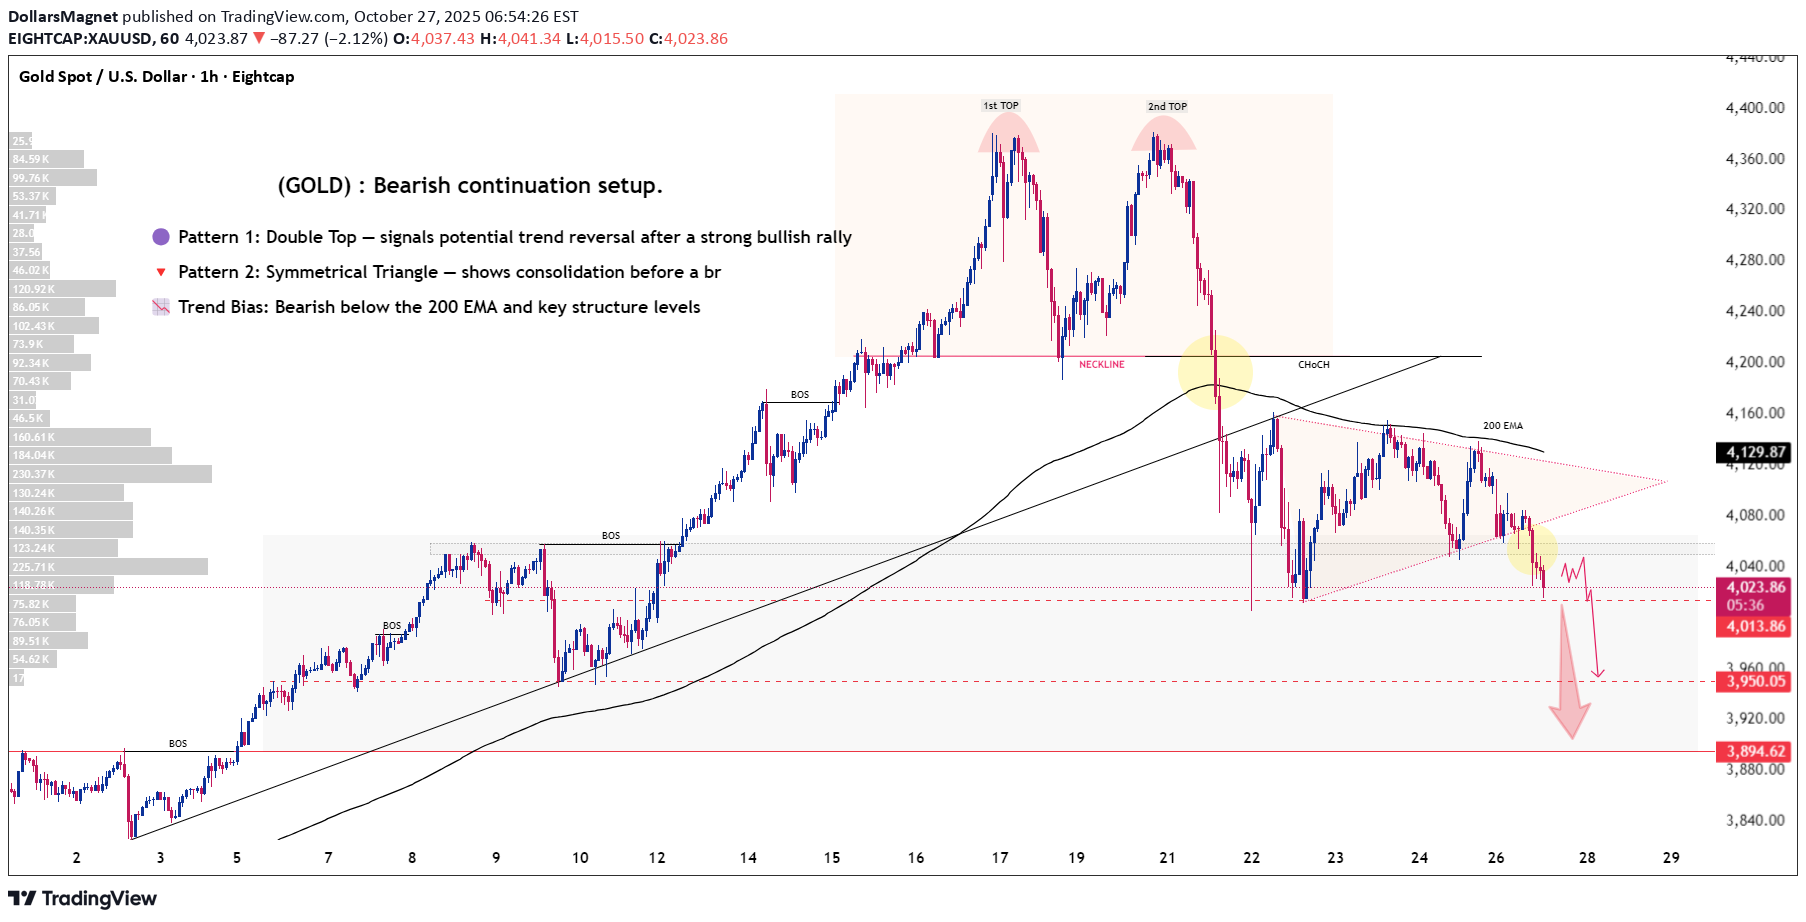
📉 GOLD (XAU/USD) – “Double Top Breakdown & Symmetrical Triangle Setup” Technical Outlook (1H Chart – October 27, 2025): Gold has developed a clear Double Top pattern near the $4,320 resistance zone, followed by a Symmetrical Triangle consolidation that has now broken to the downside — confirming a bearish continuation setup. 🧠 Key Technical Insights 🟣 Pattern 1: Double Top — signals potential trend reversal after a strong bullish rally 🔻 Pattern 2: Symmetrical Triangle — shows consolidation before a breakout; price has broken below its lower boundary 📉 Trend Bias: Bearish below the 200 EMA and key structure levels ⚙️ Structure Notes: Clear Breaks of Structure (BOS) and Change of Character (ChoCH) indicate a confirmed shift from bullish to bearish momentum 💡 Volume Profile: Thin liquidity between $4,000–$3,950, suggesting room for downside extension 📊 Forecast & Trade Plan Entry Zone: $4,030 – $4,040 (on minor pullback/retest) Target 1 : $3,950 Target 2 : $3,895 Stop-Loss: Above $4,085 (above 200 EMA + recent swing high) Gold is currently trading around $4,026, sitting below both the neckline and the broken triangle support. Sustained price action below $4,013 will likely open the path toward $3,950 – $3,895 as bears gain momentum. 🧭 Pro Insight: With major USD events this week — including the FOMC Statement and U.S. GDP release — expect high volatility. Patience and confirmation on retests will be key for safe entries. 💬 If you found this analysis helpful — LIKE, COMMENT, and FOLLOW me for more professional trading insights, forecasts, and daily market updates! Let’s grow together and trade smart. 💪📉 TRADE UPDATE: XAU/USD – Sell Trade Activated ✅ 🔥 Gold (XAU/USD) Sell Trade Activated after a confirmed bearish pattern breakout from the symmetrical triangle formation. The market has respected the structure perfectly and is now moving lower as expected. 🧠 Reasons for Entry: - Pattern Confirmation: Clear breakout from Symmetrical Triangle supporting bearish continuation. - Double Top Reversal: Higher-timeframe pattern confirms long-term weakness below the neckline. - 200 EMA Rejection: Price failed to reclaim above the 200 EMA, maintaining bearish pressure. - Momentum Shift: Break of key support zone and consecutive bearish candles confirm seller dominance.
DollarsMagnet
Breakout + Momentum = XAU/USD on Fire! Heading to $3,440?
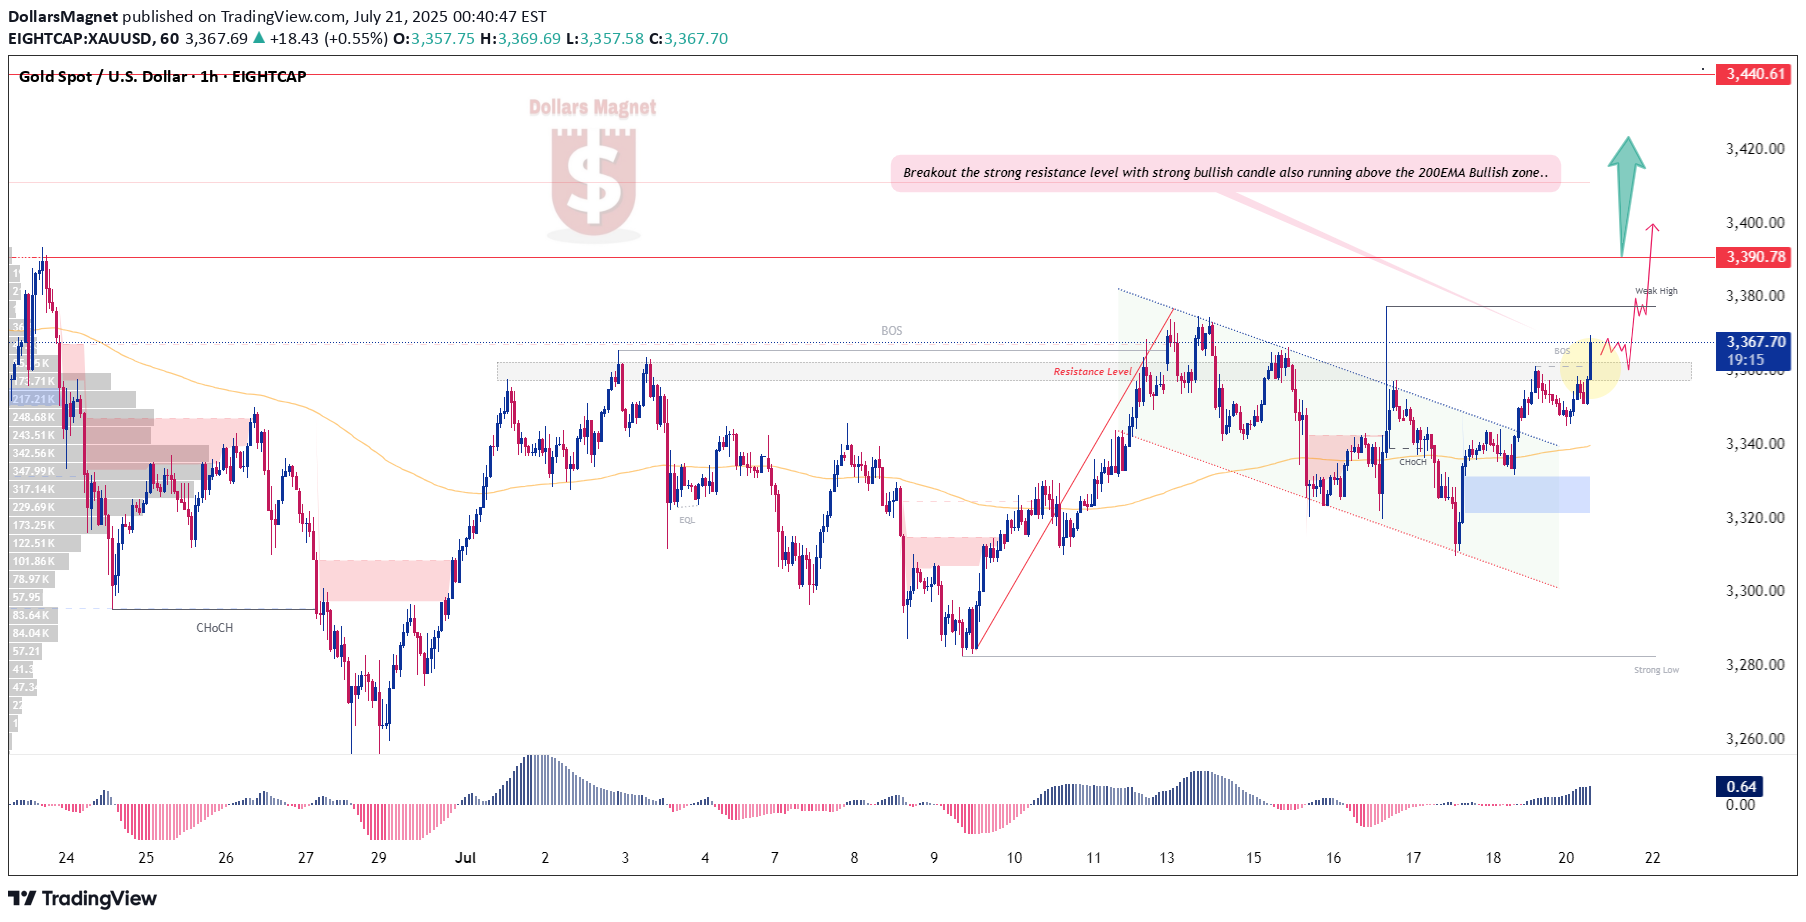
📈 XAU/USD – Bullish Flag Breakout Confirmed XAUUSD Gold has formed a classic Bullish Flag & Pole pattern, and the breakout has already played out. After a successful retest of the flag structure, price has continued its upward move, breaking through a strong resistance level with a powerful bullish candle. Currently, XAU/USD is trading above the 200 EMA, confirming its position in a bullish zone and supporting further upside momentum. 🔼 Technical Targets / Resistance Levels: First Target: $3,390 Second Target: $3,440 As long as price holds above the breakout and the 200EMA, bulls remain in control. 🚨 This is not financial advice. Always use proper risk management. 💬 Like, comment, and follow to support our growing community – your engagement makes a huge impact! 📊 #XAUUSD #GoldAnalysis #BullishBreakout #TradingView #ForexCommunityThe market retested the demand zone at 3362, where our buy trade was activated. From there, price launched with strong bullish momentum, flying past resistance and hitting our first target at 3402. 📍 Entry: 3362 🎯 Target 1 Hit: 3402 ✅ Profit: +400 pips secured! 🔥 Congrats to everyone who took this setup — clean bounce, strong follow-through. Let’s keep the momentum going!
DollarsMagnet
From Strength to Struggle – Is BTC Losing Momentum? (Read More)
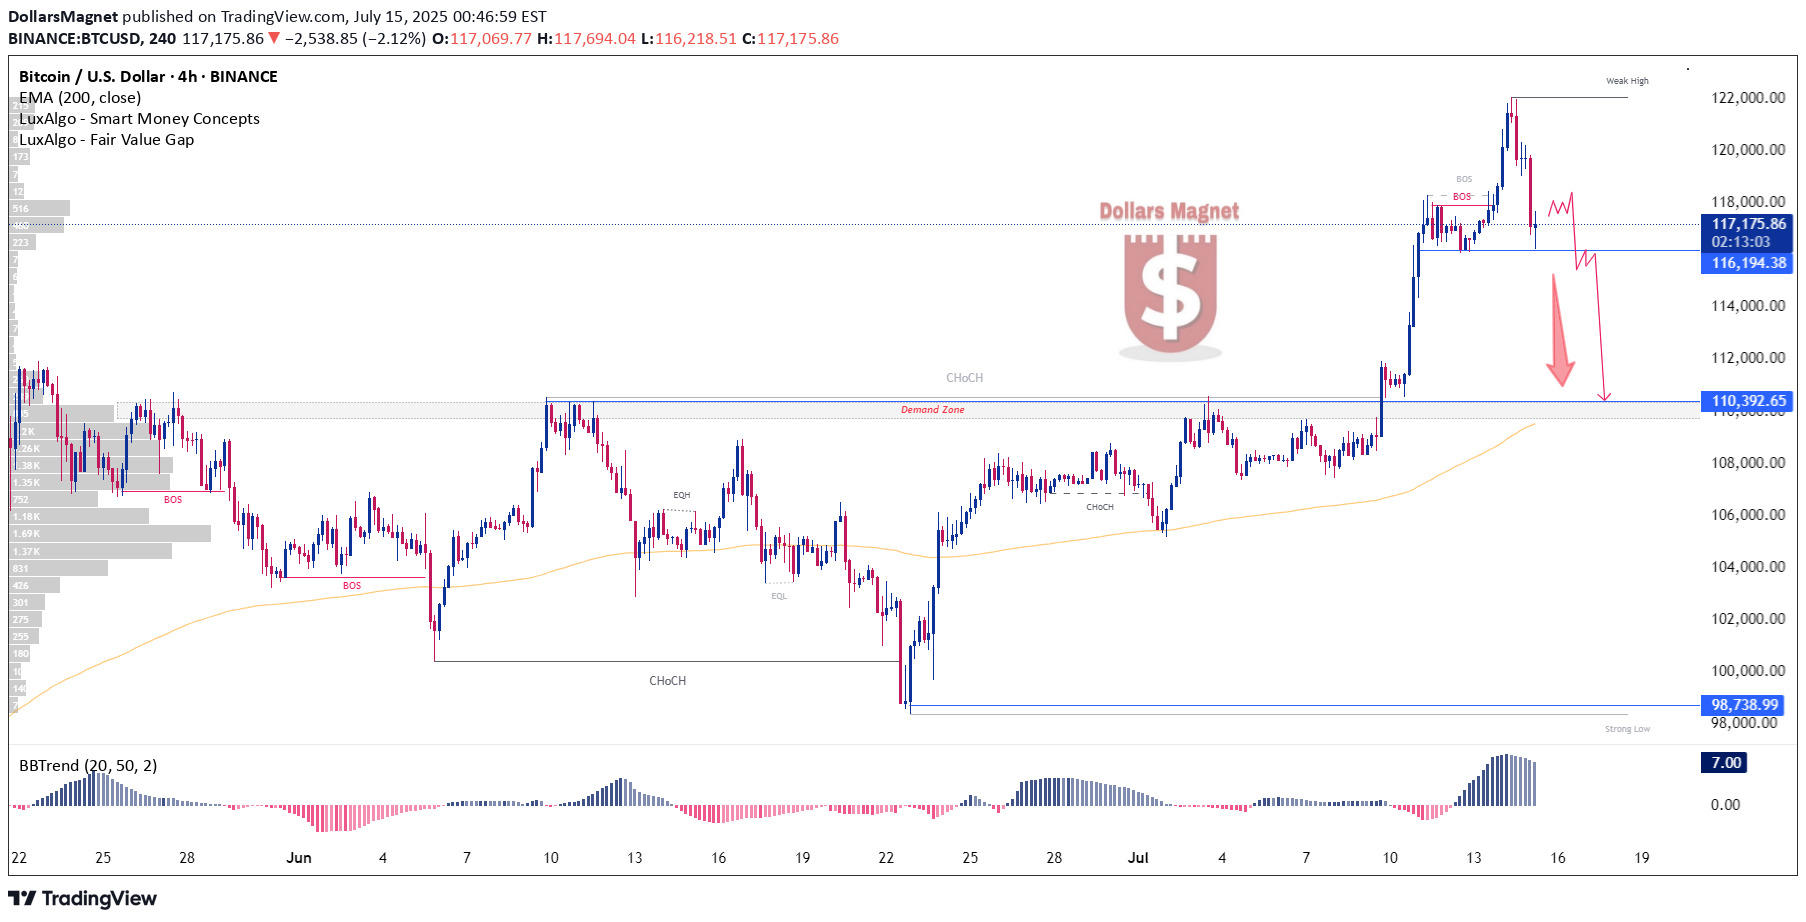
📉 BTC/USD Analysis – 4H Chart Breakdown Bitcoin is currently showing signs of a potential reversal after forming a weak high near the $122,000 mark. Price has dropped back below the recent break of structure (BOS) and is hovering around the $117,000 zone. A rejection at this level could trigger a deeper retracement toward the key support zone around $116,194, and possibly further to the demand zone near $110,392. The chart also shows a clear change of character (CHoCH) and a strong BOS, indicating that the bullish momentum may be losing steam in the short term. If price breaks below $116K, it could confirm bearish intent toward the lower imbalance zones. 💡 Watching how price reacts at $116K is critical. A break below may open the path toward $110K and even $98K (strong low) if bearish pressure intensifies. 🚨 Not financial advice. Trade wisely with proper risk management. 💬 Like, comment & follow for more high-quality Smart Money-based analysis! 📊 #Bitcoin #BTCUSD #SmartMoneyConcepts #CryptoAnalysis #TradingView
DollarsMagnet
XAU/USD Bullish Momentum Builds – Key Levels Ahead. (Read more)
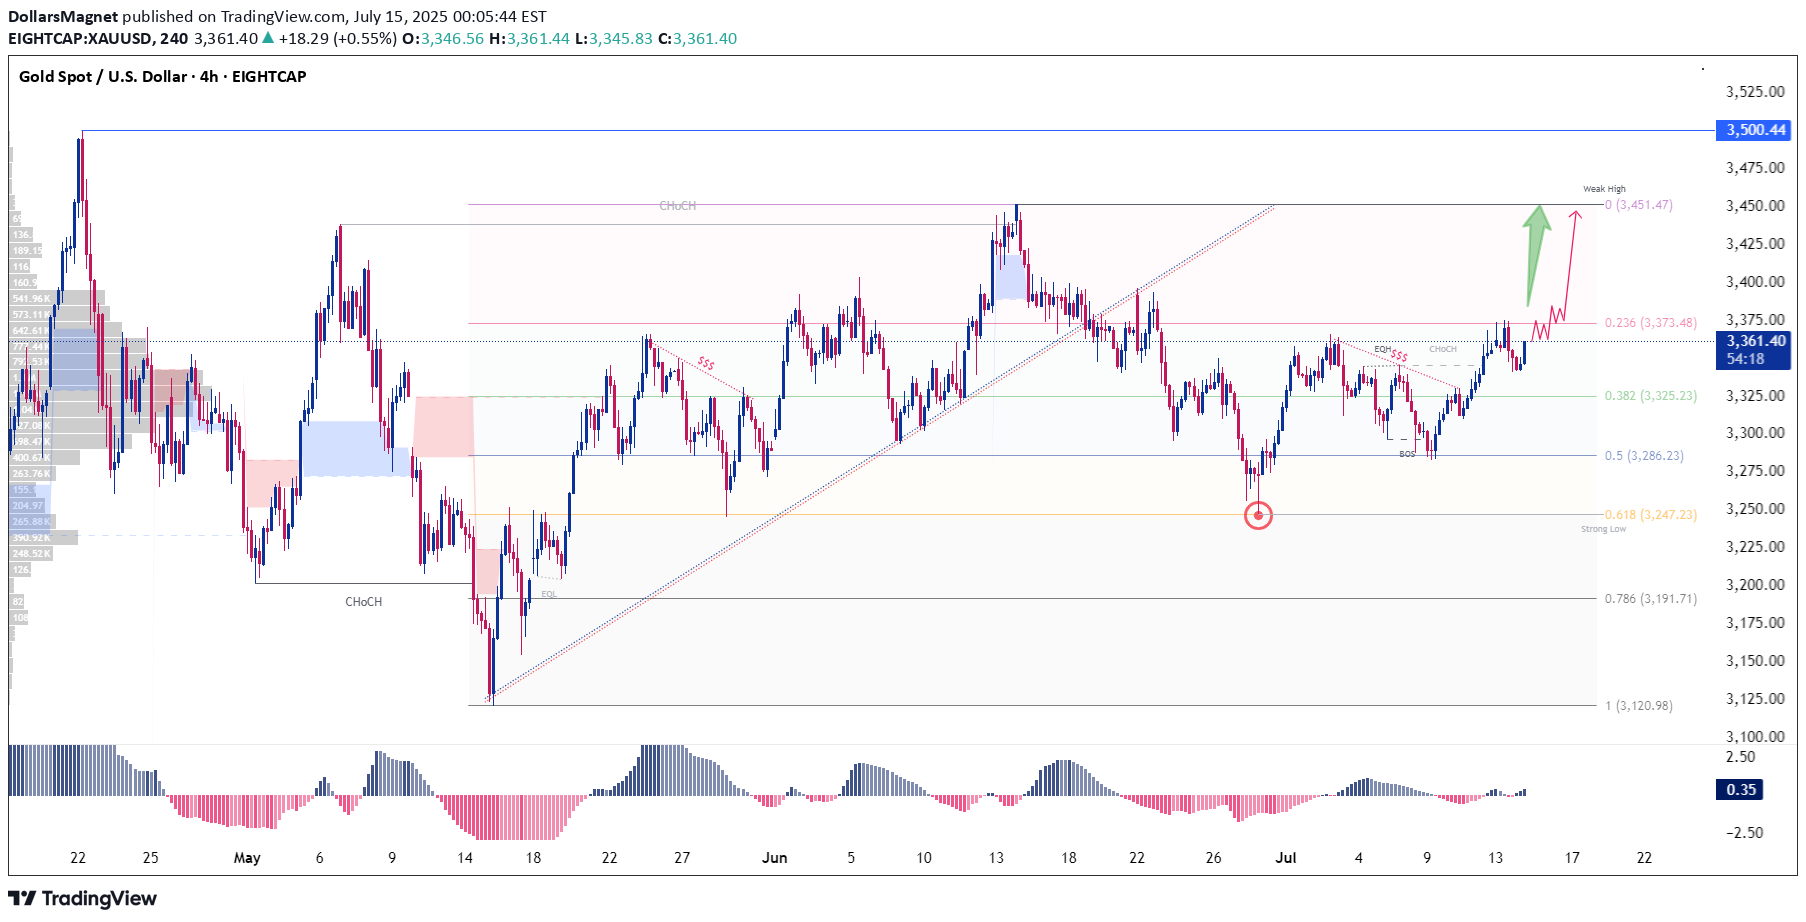
📈 XAU/USD Market Forecast – Gold Analysis Gold remains in a strong uptrend across most timeframes. After retracing to the 61.8% Fibonacci level, it reversed and resumed its bullish momentum. Now, it's approaching a breakout above the 23.6% level, supported by rising volume — a strong sign of continued bullish strength. Key technical targets are set at 3452 and 3500. 🚨 This is not financial advice. Always do your own research. 💬 Like, comment, and follow for more precise market insights. Your support helps this community grow!Gold (XAU/USD) initially consolidated just below key resistance levels, showing signs of buildup. Yesterday, it broke above resistance and surged to 3401, triggering our buy trades from 3361. 📈 Entry: 3361 🎯 Current Price: 3401 🚀 Gain: +400 pips and running! 🔥 Big congratulations to everyone riding this breakout with us. Excellent precision and patience paying off!
DollarsMagnet
BTCUSD – Demand Zone Broken, Bearish Continuation in Focus...
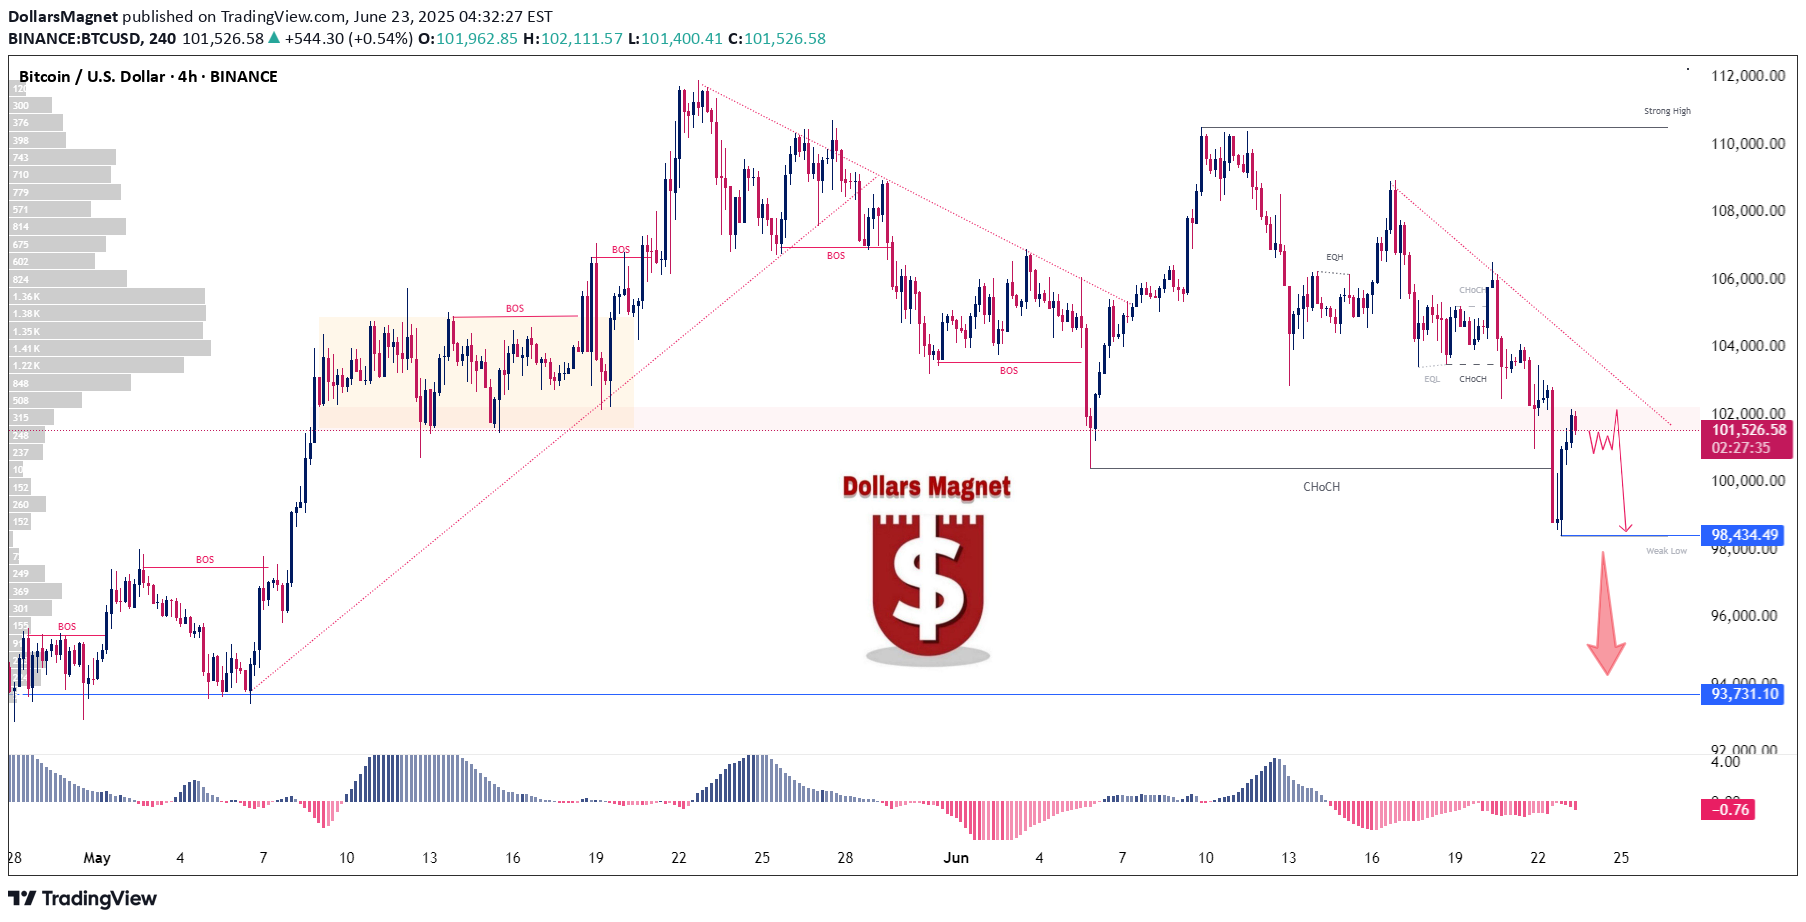
BTCUSD Bitcoin (BTCUSD) is currently trading in a clear downtrend and has recently broken below a major demand zone with a strong bearish candle — confirming continued selling pressure.🔄 After a brief retracement, the market is showing signs of renewed bearish momentum, supported by a noticeable increase in selling volume.This setup points to a potential continuation to the downside.🎯 Technical Target Levels:- $98,400- $93,700These levels represent key areas where price could find short-term support if momentum continues.🙌 Join the Community:If this analysis helped, don’t forget to like, comment, and follow for more real-time market insights.Your support helps grow a strong, informed trading community.
DollarsMagnet
BTCUSD Technical Outlook – Eyeing a Major Breakout.
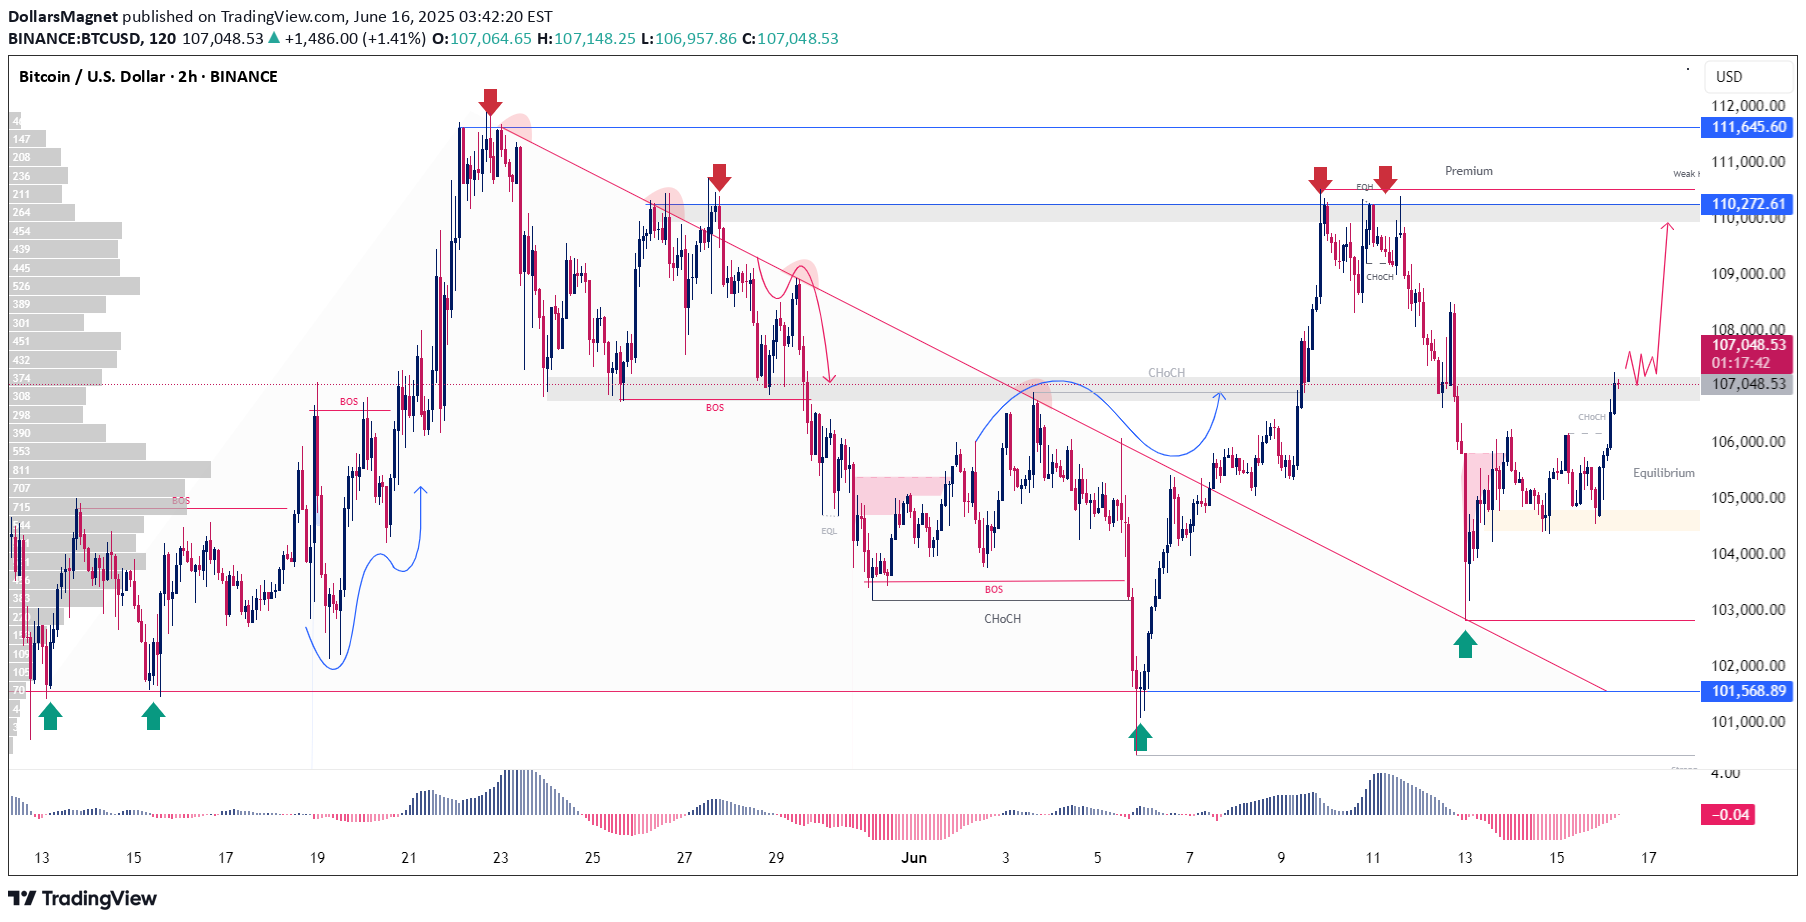
BTCUSD has successfully broken out of its descending trendline, signaling a shift in market structure from bearish to bullish. After the breakout, the market completed a healthy retracement and is now pushing upward again. Price has reached a key resistance zone around 107,000, which is acting as a major decision point.If BTC can break and hold above this resistance, we could see a strong bullish continuation. Buying volume is increasing, showing strong interest from bulls. On the downside, there’s a strong support level at 101,500, which is holding the current structure firmly.Our technical target levels on a confirmed breakout are 110,200 and 111,500. Keep an eye on price action and volume around the resistance zone for confirmation.Like, comment, and follow for more real-time analysis and trade updates. Let’s grow the DollarsMagnet community and navigate the markets together with smart, strategic insights.
DollarsMagnet
Gold Market Analysis – Potential Bearish Reversal Underway.
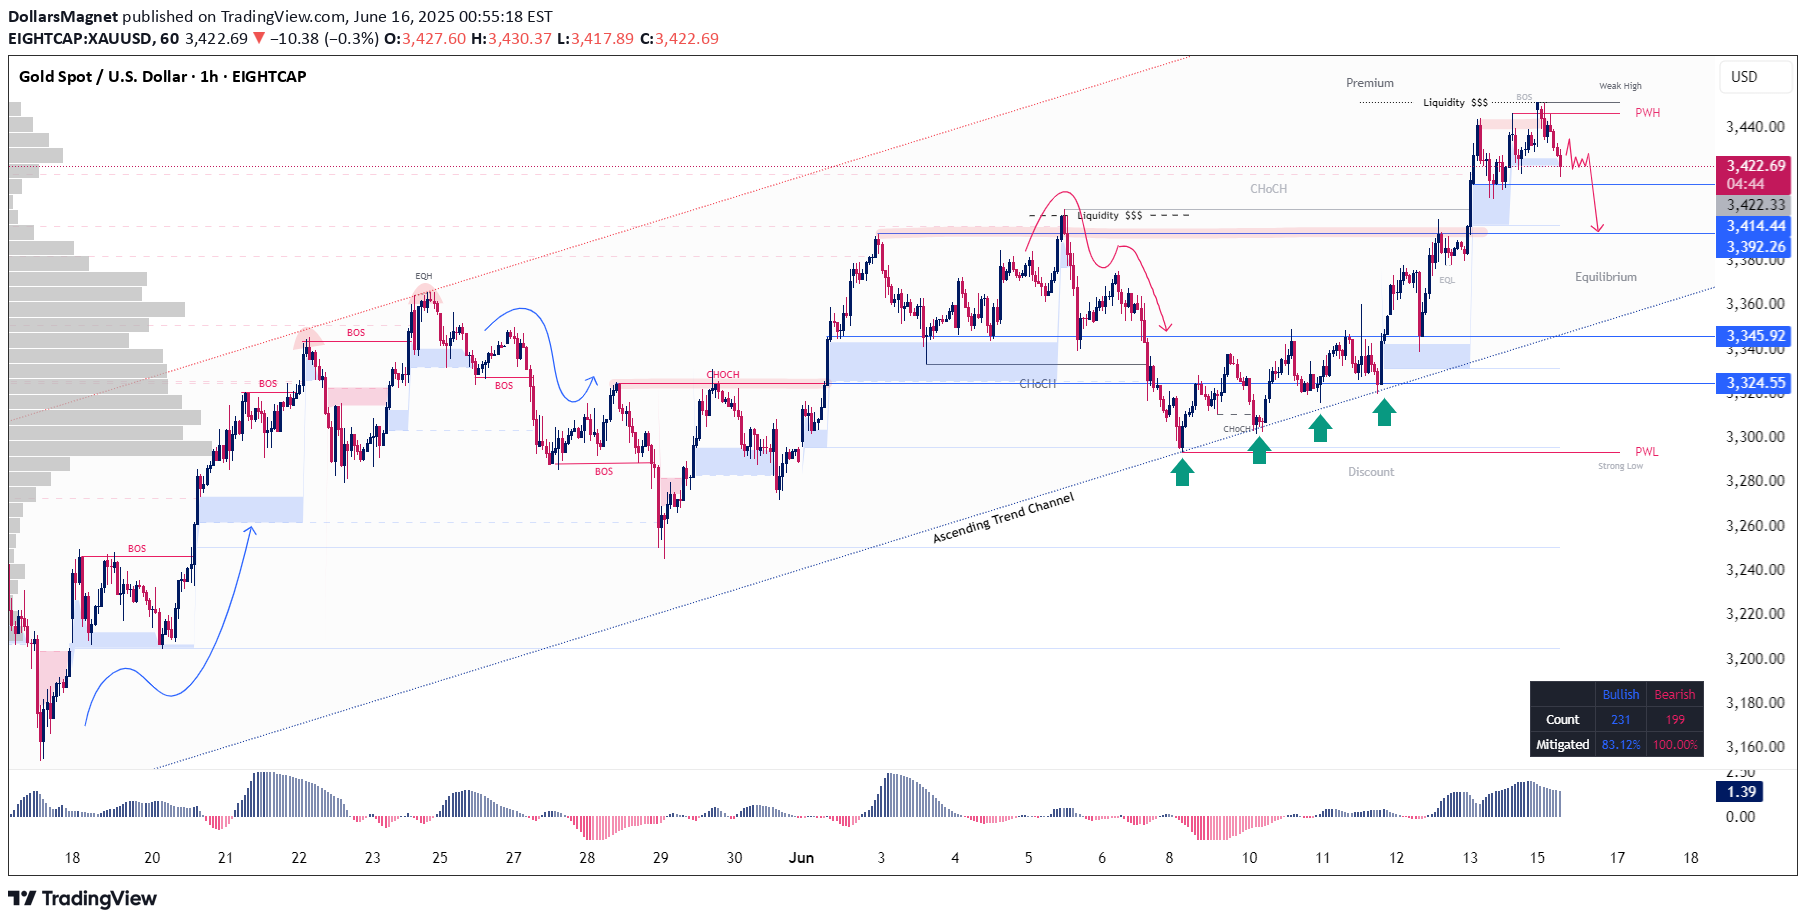
XAUUSD Gold has been trending in an upward direction, respecting an ascending channel for some time. Recently, the price action tested the top of this channel and formed a strong resistance level. That resistance was broken briefly, which appeared to be a liquidity trap—drawing in breakout buyers before reversing. This kind of false breakout often signals a shift in market sentiment. Since then, the price has started to decline, and importantly, it has now broken down through the channel’s support level.This breakdown suggests that the bullish momentum may be weakening and that a bearish trend could be starting. Based on technical levels, the next potential support zones to watch are at 3414, 3392, 3345, and 3324. These levels could act as short-term price targets or areas where the market may pause or reverse again.If you found this analysis helpful, don’t forget to like, comment, and follow. Your support helps us grow our community and keep sharing high-quality market insights. For more detailed analysis and real-time trade ideas, follow me here at DollarsMagnet—where we focus on smart, strategic trading.Gold Trade Update – First Target HitOur bearish setup on gold has been activated perfectly. Since our entry, the market has followed the expected move and started falling. It has now touched our first target, delivering a solid 100+ pips in profit.Momentum remains bearish, and we’re now watching the next support levels at 3392, 3345, and 3324. Trade is running well—manage your positions accordingly and trail stops if needed.Like, comment, and follow for more updates and trade ideas. Let’s keep growing the DollarsMagnet trading community!
DollarsMagnet
XAUUSD Bullish Reversal Structure – Inverse Head and Shoulders..

Hello Traders and Investors!Here is a detailed analysis of XAUUSD that may help guide your trading decisions and support the community with structured, actionable insights.Gold (XAUUSD) has shown repeated bullish reversal signals at the bottom of its recent downtrend. Initially, an Inverse Head and Shoulders pattern formed and reached its technical target successfully. After that, price action developed a Falling Wedge pattern, another bullish signal, followed once again by the formation of a second Inverse Head and Shoulders at the base of the move.On the lower timeframes, XAUUSD has now broken above the descending trendline, confirming bullish momentum. A retracement has occurred back into the neckline area of the recent Inverse Head and Shoulders, which aligns with multiple key confluences:Demand Zone and Order Block: Around 3290- 200 EMA Support: Price is holding above the 200 EMA, now acting as dynamic support- Neckline Retest: Retest of the broken neckline adds further confirmationTechnical Resistance / Target Levels:- Target 1: 3324- Target 2: 3363- Target 3: 3409- Target 4: 3438These levels correspond to previous structural resistance zones and Fibonacci extensions.Community Note:-- If this breakdown helps clarify your view on gold, feel free to share your thoughts or charts in the comments. Let’s continue to build a strong and informed trading community.-- Follow for regular market updates, pattern breakdowns, and clean technical setups.#XAUUSD #Gold #InverseHeadAndShoulders #FallingWedge #TechnicalAnalysis #ForexCommunity #PriceAction #TradingView
Disclaimer
Any content and materials included in Sahmeto's website and official communication channels are a compilation of personal opinions and analyses and are not binding. They do not constitute any recommendation for buying, selling, entering or exiting the stock market and cryptocurrency market. Also, all news and analyses included in the website and channels are merely republished information from official and unofficial domestic and foreign sources, and it is obvious that users of the said content are responsible for following up and ensuring the authenticity and accuracy of the materials. Therefore, while disclaiming responsibility, it is declared that the responsibility for any decision-making, action, and potential profit and loss in the capital market and cryptocurrency market lies with the trader.