Technical analysis by DollarsMagnet about Symbol PAXG: Sell recommendation (10/27/2025)

DollarsMagnet
ریزش طلا: پایان کفش دوقلو و شروع حرکت نزولی در مثلث متقارن!
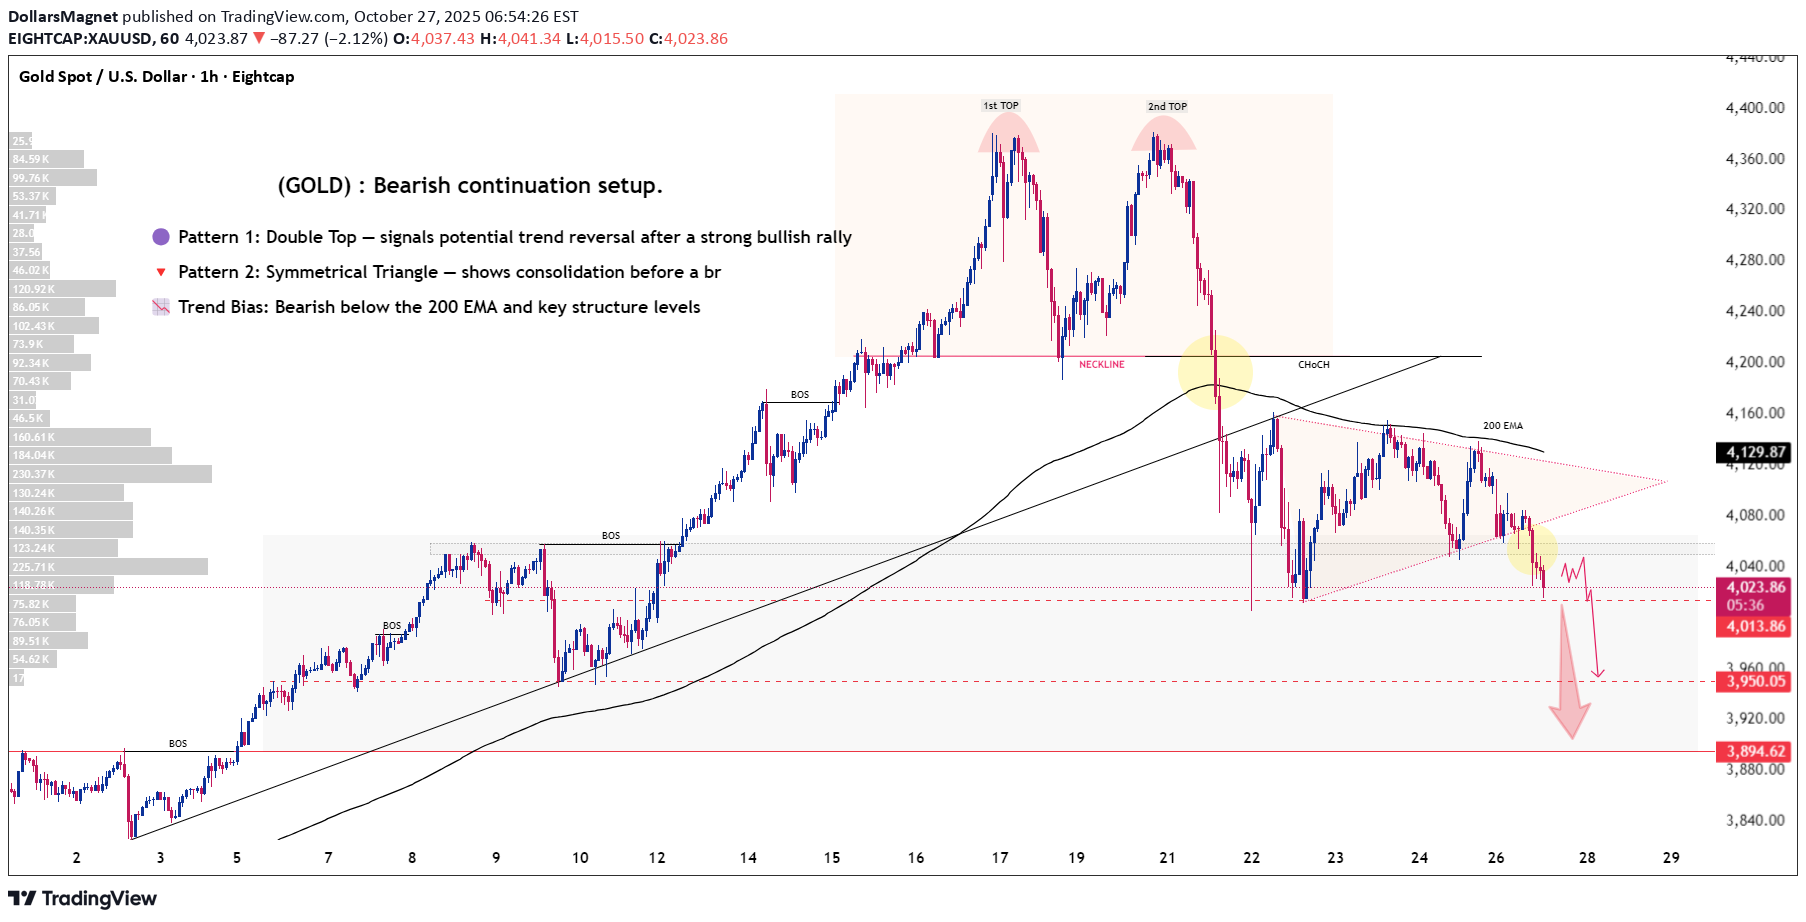
📉 GOLD (XAU/USD) – “Double Top Breakdown & Symmetrical Triangle Setup” Technical Outlook (1H Chart – October 27, 2025): Gold has developed a clear Double Top pattern near the $4,320 resistance zone, followed by a Symmetrical Triangle consolidation that has now broken to the downside — confirming a bearish continuation setup. 🧠 Key Technical Insights 🟣 Pattern 1: Double Top — signals potential trend reversal after a strong bullish rally 🔻 Pattern 2: Symmetrical Triangle — shows consolidation before a breakout; price has broken below its lower boundary 📉 Trend Bias: Bearish below the 200 EMA and key structure levels ⚙️ Structure Notes: Clear Breaks of Structure (BOS) and Change of Character (ChoCH) indicate a confirmed shift from bullish to bearish momentum 💡 Volume Profile: Thin liquidity between $4,000–$3,950, suggesting room for downside extension 📊 Forecast & Trade Plan Entry Zone: $4,030 – $4,040 (on minor pullback/retest) Target 1 : $3,950 Target 2 : $3,895 Stop-Loss: Above $4,085 (above 200 EMA + recent swing high) Gold is currently trading around $4,026, sitting below both the neckline and the broken triangle support. Sustained price action below $4,013 will likely open the path toward $3,950 – $3,895 as bears gain momentum. 🧭 Pro Insight: With major USD events this week — including the FOMC Statement and U.S. GDP release — expect high volatility. Patience and confirmation on retests will be key for safe entries. 💬 If you found this analysis helpful — LIKE, COMMENT, and FOLLOW me for more professional trading insights, forecasts, and daily market updates! Let’s grow together and trade smart. 💪📉 TRADE UPDATE: XAU/USD – Sell Trade Activated ✅ 🔥 Gold (XAU/USD) Sell Trade Activated after a confirmed bearish pattern breakout from the symmetrical triangle formation. The market has respected the structure perfectly and is now moving lower as expected. 🧠 Reasons for Entry: - Pattern Confirmation: Clear breakout from Symmetrical Triangle supporting bearish continuation. - Double Top Reversal: Higher-timeframe pattern confirms long-term weakness below the neckline. - 200 EMA Rejection: Price failed to reclaim above the 200 EMA, maintaining bearish pressure. - Momentum Shift: Break of key support zone and consecutive bearish candles confirm seller dominance.