
David_1_8
@t_David_1_8

What symbols does the trader recommend buying?
Purchase History
پیام های تریدر
Filter
Gold Analysis, Break-down of GOLD Chart
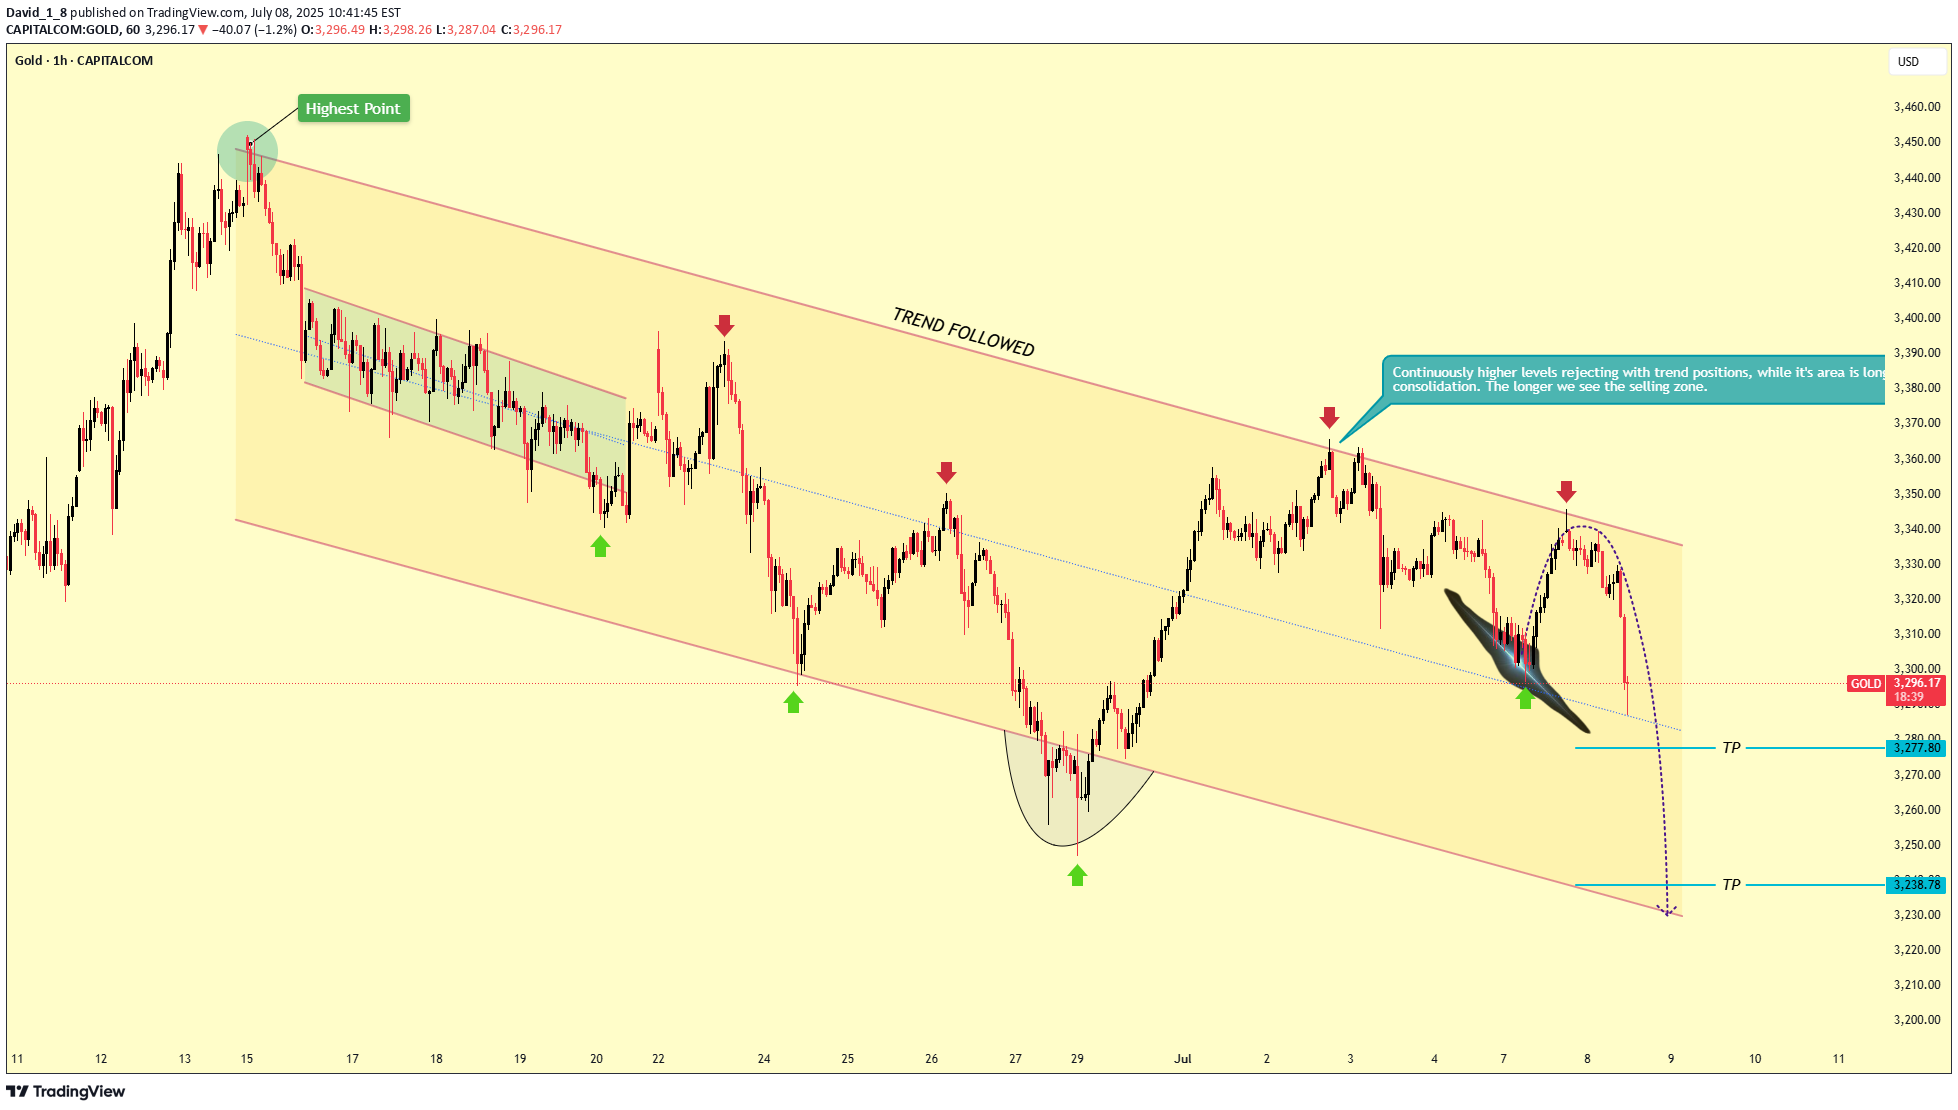
The technical analysis of Gold on the 1-hour timeframe. Here's a breakdown of the **patterns** and **tools** used in the analysis:---### 📊 **Chart Patterns Used:**1. **Descending Channel (Trend Channel):** * The primary structure in the chart is a **descending channel** (marked with parallel red trendlines). * The price is oscillating within the channel, respecting both support and resistance. * The label "TREND FOLLOWED" confirms that the analysis is based on this downward trend.2. **Wedge/Flag Pattern:** * There's a small **bearish wedge or flag** (highlighted in black) before the latest price drop. * This is a **continuation pattern** signaling a bearish move after a consolidation period.3. **Rounded Bottom (Reversal Formation):** * Around June 27-29, a **rounded bottom** or cup-shaped pattern appears, indicating a temporary reversal before resuming the downtrend.---### 🧰 **Tools and Annotations Used:**1. **Trendlines:** * Two major trendlines forming the descending channel. * Internal trendlines within the channel for minor trends and consolidation zones.2. **Arrows:** * **Red Arrows**: Indicate points of resistance or trend rejection (sell signals). * **Green Arrows**: Indicate support or bounce points (buy signals).3. **Text Boxes and Labels:** * Labels like "Highest Point" and commentary bubbles (e.g., “Continuously higher levels rejecting…”) give context to the trend and potential trade zones.4. **TP (Take Profit) Levels:** * Marked with horizontal blue lines showing two TP zones: * Around **3277.80** * Around **3248.78**5. **Path Projection:** * A **dotted pink curve** showing the expected future price movement downwards to TP zones.6. **Channel Tool:** * Likely the **parallel channel tool** from charting platforms like TradingView to draw the trend-following descending channel.---### 📈 Summary:* **Main Pattern:** Descending channel with continuation formations (bear flag, wedge).* **Tools Used:** Trendlines, channel tool, arrows, text annotations, TP levels, pattern drawing.* **Outlook:** Bearish – price is projected to continue falling to TP levels unless key resistance is broken.Would you like help with trade entry/exit strategy based on this analysis?Selling area 3300.00 to 3310.00Target's 3285.00, & 3260.00, & 3340.00Stop loss 3327.00Use proper risk management.
GOLD price increases fed Powel speech.

The Gold Spot/U.S. Dollar exchange rate on the OANDA platform, with various technical analysis tools and indicators applied.🧭Chart Details:👩💻- The chart is set to a 1-hour time frame.- It shows the price movement of Gold Spot/U.S. Dollar over time.- The chart features a mix of green and red bars, indicating price movements.💹Technical Analysis Tools and Indicators:- Trend Lines: Two trend lines are drawn on the chart, one connecting the highs and another connecting the lows. These lines help identify the overall trend and potential support or resistance levels.- CHOCH (Change of Character): The chart highlights several CHOCH points, which are significant changes in the market structure. These points are marked with labels and arrows, indicating potential turning points in the price action.- BOS (Break of Structure): A BOS is identified on the chart, marked with a label. This indicates a significant break in the market structure, potentially signaling a change in the trend.- Target: A target price level is indicated on the chart, represented by a blue rectangle. This suggests a potential price objective based on the analysis.Analysis and Interpretation:- The chart appears to be analyzing the Gold Spot/U.S. Dollar exchange rate using various technical analysis tools and indicators.- The trend lines and CHOCH points suggest that the market has undergone significant changes in structure, potentially indicating a shift in the trend.- The BOS and target price level provide additional insights into the potential direction and magnitude of the price movement.Trade setup; with David↗ Bullish Entry 3310 to 3300Target 3340.00Target 3380.00Target 3400.00 Stop Loss; 3280.00Use proper risk management. Overall, the image presents a detailed technical analysis of the Gold Spot/U.S. Dollar exchange rate, highlighting key features and potential trading opportunities.Like🚀 to support us.Use proper risk management.
Pull back of gold, take position.

Gold analysis chart on the 1-hour time frame chart facing high bullish pressure, after the break-out of the descending trend line. 3200 is the strong level with high potential pull back. The confirm entry level 3225.00 indicates the first layer of price pull back, and the lower trend line indicates the continuing of the bullish trend. Overall the point of interest (POI) is the point of target. It may consolidate 3245 to 3260 area because of the buy side liquidity.Clear trade setup for educational purpose.Bullish entry 3225.00Target 3250.00Target 3300.00Target 3330.00Stop loss: 3190.00Use proper risk/reward ratio.That’s all, what you think about “GOLD” reversal write in comment below.Kindly like 🚀 to support us.Use properly.
GOLD reversal to backon sell position.

GOLD analysis update on the 1-hour time frame chart ascending trend line. The order block creat a strong resistance for potential selling zone. Following the trend line gold have been reach $3045.00.It seems to be like it will reach soon, but the dynamics support and lower support zone will create a pressure for buying.Trade setup;Sell entry 31705.00Target 3130.00Target 3090.00Target 3050.00Stop loss: 3208.00Reward ratio 4:29Use proper risk management.That’s all what you think about it, write in comment below.Follow properly.
SOLUSDT aggressive bullish reversal area.

Hello Trader’s SOLUSDT analysis update on the 4-hour time frame chart, which is based on the trend analysis and reversal from the fear value gab, if it will take retest otherwise it’s on continuously aggressive bullish.At the support area have consolidation zone. The support area 143.60 having strong zone because of consolidation, the fear value gab 162.30 is expected reversal area for bullish, overall view on the bullish also we hold much for more bullish position because of expected the break-out of resistance202.00.Trade setup:Bullish entry layer’s 175.00, 162.50.Target 190.00Target 200.00 OpenStop loss; 159.50Use proper risk/reward management.This is all about “SOLUSDT”, what are you expecting, write in comment below.Kindly like🚀 to support.Just for educational purpose.
Bitcoin price agreement with chaina, reversal.

Hello Trader’s!“XAUUSD” analysis update on the 4-hour time frame chart, the analysis is based on supply and demand zone, the Bitcoin is prices increase after the China agreement. Technically the resistance work as the potential selling pressure. On that top may consolidate between trend line and resistance, after the break-out of the trend line ($$), the selling trade is more conformed to selling pressure. Trade setup with David:Selling Entry; 103.500Target; 97,000Target; 93,700Target; 84,900Stop loss; 106,500It’s just for educational and practice.That’s all about in my mind, what you think about “Bitcoin”, write in comment below.
XAUUSD pair analysis forecast.

Gold analysis update by David.The analysis of gold market on the 30-mints frame is based on the some tools, which is trend line and liquidity areas. Overall the gold have been falling again after growing from 3202.00 to 3433.00. After the reaching 3433.00 gold is continuously falling with Higher low and lower low position’s. The line denoted with ($$) have a main role, that is work as resistance. The possibility of sell layer’s are 3330.00, 3360.00. The green arrow is highlighting the trade direction. The sell side liquidity (SSL) is last zone of sell. Trade setup:Sell entry; 3330.00 to 3360.00Target’s; 3292, 3260, 3205.Stop loss; 3376.00It’s just for educational and practice.That’s all about in my mind, What you think about “GOLD”, write in comment below. Kindly ☺️Like to support.Use proper risk/reward management.
Gold price decrease, with short range.

Hello’ Trader’sXAU/USD analysis chart on the 15-mints time frame chart, I identify it by using descending trend line and Order block is entry point.Continuously beak of structure in a trend. Trade setup:Sell Entry 3314.00Target’s 3290.00, 3260.00, 3225.00.Stop loss: 3335.00Use proper risk/reward management.Write in comments below, if you have any question about “GOLD”.Trade carefully, it's just for practice.
XAUUSD price revesal area.

XAUUSD analysis chart on the 15-mints time frame. Analysis based on trend line and support area, its making like triangle pattern, the next moving average area is decreasing at the end market will break support . If the market break support area then get reversed from 3308.00. My next point of interest is 3410.00 and 3450.00.3380 is the area of consolidation may resist the market to increase easily.Trade setup:Bullish Entry point: 3315.00, 3310.00Target's 3380.00 3410.00, 3450.00.Stop loss 3290.00What you think about "GOLD", write in comment section.Use Proper risk/reward management.
SOLUSD Cryptocurrency price increases.

The Solana (SOL) cryptocurrency against the US Dollar (USD) on the Coin-base exchange. The chart is displayed on a 1-hour timeframe.To analyze this chart, several tools are used:1. Trend Lines: A downward trend line is drawn connecting the highs of the price action, indicating a bearish trend. The price has recently broken above this trend line, suggesting a potential reversal.2. Support and Resistance Levels: Two horizontal blue zones are marked on the chart, labeled "S.A" ( likely "Supply Area" or a similar term) and "OB" ( possibly "Order Block"). These zones represent areas of potential support and resistance. The price has bounced off the lower zone ("S.A") and is now moving towards the upper zone ("OB").3. Order Block (OB): The "OB" zone is likely an area where significant buying or selling activity has occurred in the past, making it a potential level of interest for traders.4. Supply Area (S.A): The "S.A" zone is an area where the price has previously found support, and it may continue to act as a support level.5. POI (Point of Interest): A zone labeled "POI" is marked above the current price, indicating a potential target or area of interest for traders.The chart analysis suggests that the price has broken above the downward trend line and is expected to continue rising, potentially reaching the "POI" zone. The green arrow on the chart indicates the anticipated direction of the price movement.Overall, the analysis tools used in this chart include trend lines, support and resistance levels, order blocks, and points of interest. These tools help traders identify potential trading opportunities and make informed decisions.What you think about "SOLUSD", write your comment below.
Disclaimer
Any content and materials included in Sahmeto's website and official communication channels are a compilation of personal opinions and analyses and are not binding. They do not constitute any recommendation for buying, selling, entering or exiting the stock market and cryptocurrency market. Also, all news and analyses included in the website and channels are merely republished information from official and unofficial domestic and foreign sources, and it is obvious that users of the said content are responsible for following up and ensuring the authenticity and accuracy of the materials. Therefore, while disclaiming responsibility, it is declared that the responsibility for any decision-making, action, and potential profit and loss in the capital market and cryptocurrency market lies with the trader.