Technical analysis by David_1_8 about Symbol PAXG on 7/8/2025

David_1_8
Gold Analysis, Break-down of GOLD Chart
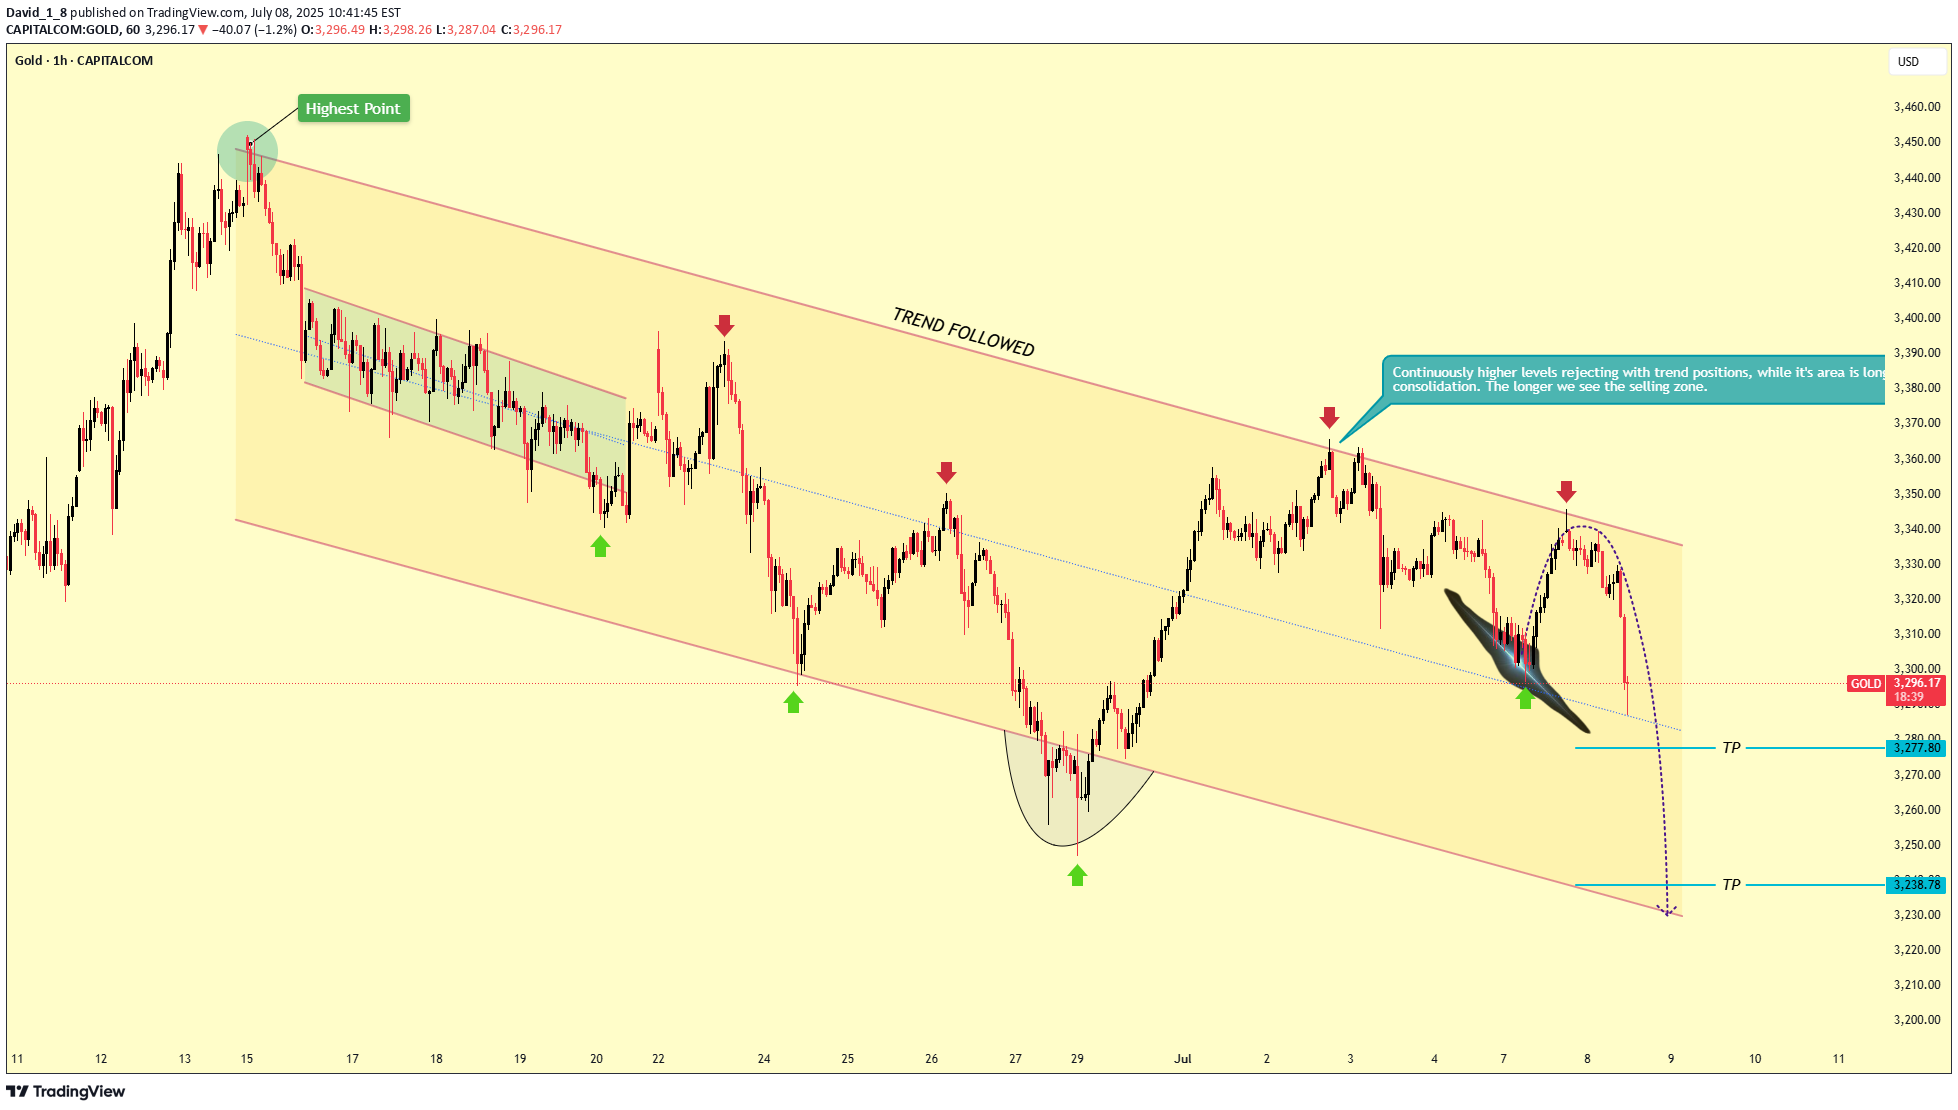
The technical analysis of Gold on the 1-hour timeframe. Here's a breakdown of the **patterns** and **tools** used in the analysis:---### 📊 **Chart Patterns Used:**1. **Descending Channel (Trend Channel):** * The primary structure in the chart is a **descending channel** (marked with parallel red trendlines). * The price is oscillating within the channel, respecting both support and resistance. * The label "TREND FOLLOWED" confirms that the analysis is based on this downward trend.2. **Wedge/Flag Pattern:** * There's a small **bearish wedge or flag** (highlighted in black) before the latest price drop. * This is a **continuation pattern** signaling a bearish move after a consolidation period.3. **Rounded Bottom (Reversal Formation):** * Around June 27-29, a **rounded bottom** or cup-shaped pattern appears, indicating a temporary reversal before resuming the downtrend.---### 🧰 **Tools and Annotations Used:**1. **Trendlines:** * Two major trendlines forming the descending channel. * Internal trendlines within the channel for minor trends and consolidation zones.2. **Arrows:** * **Red Arrows**: Indicate points of resistance or trend rejection (sell signals). * **Green Arrows**: Indicate support or bounce points (buy signals).3. **Text Boxes and Labels:** * Labels like "Highest Point" and commentary bubbles (e.g., “Continuously higher levels rejecting…”) give context to the trend and potential trade zones.4. **TP (Take Profit) Levels:** * Marked with horizontal blue lines showing two TP zones: * Around **3277.80** * Around **3248.78**5. **Path Projection:** * A **dotted pink curve** showing the expected future price movement downwards to TP zones.6. **Channel Tool:** * Likely the **parallel channel tool** from charting platforms like TradingView to draw the trend-following descending channel.---### 📈 Summary:* **Main Pattern:** Descending channel with continuation formations (bear flag, wedge).* **Tools Used:** Trendlines, channel tool, arrows, text annotations, TP levels, pattern drawing.* **Outlook:** Bearish – price is projected to continue falling to TP levels unless key resistance is broken.Would you like help with trade entry/exit strategy based on this analysis?Selling area 3300.00 to 3310.00Target's 3285.00, & 3260.00, & 3340.00Stop loss 3327.00Use proper risk management.