
CustomQuantLabs
@t_CustomQuantLabs

What symbols does the trader recommend buying?
Purchase History
پیام های تریدر
Filter
Bitcoin vs. Tech: The "Catch-Up" Play
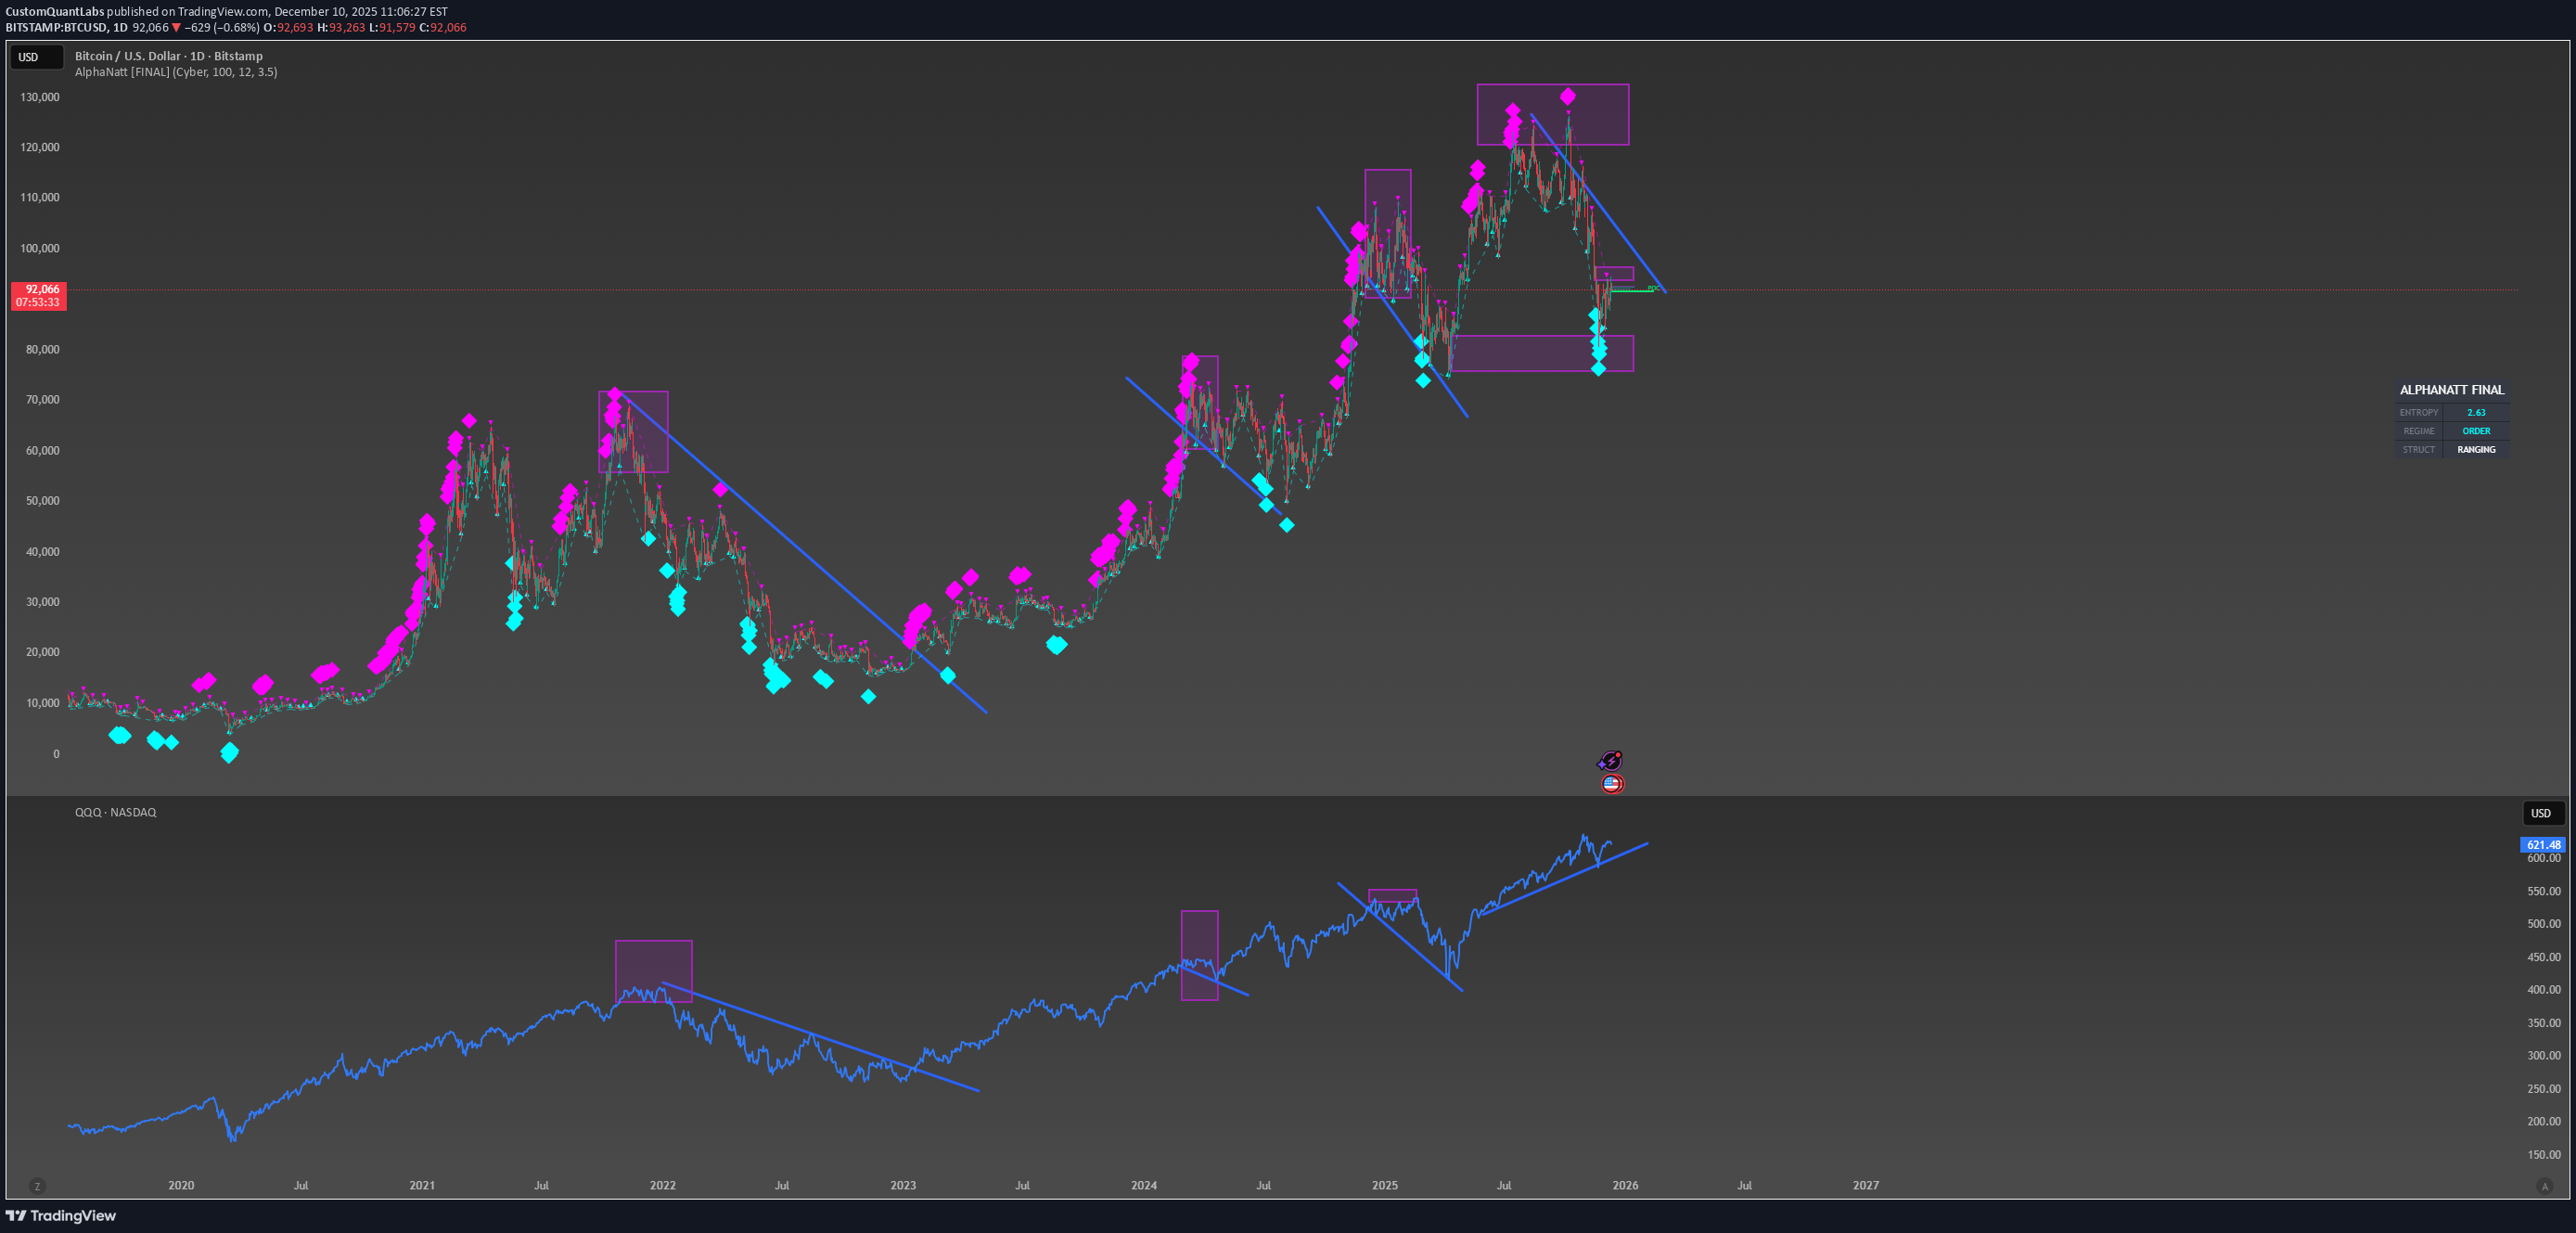
The market is whispering a secret: Tech (QQQ) is leaving Bitcoin behind. While the Nasdaq has already smashed through resistance and is sprinting higher, Bitcoin is stuck napping in a descending channel. But in trading, divergence is just opportunity in disguise. The Setup: The Pattern: Bitcoin is painting a textbook Bull Flag—a pause that refreshes. The Signal: Look at the Cyan Diamonds appearing right now on the BTC chart. Historically, these specific algo prints mark the exact moment "smart money" starts accumulating before the next leg up. The macro bull trend is still very much alive despite the short-term noise. The Trade: Bitcoin is coiled like a spring. If the correlation holds, BTC is due to "catch up" to the QQQ breakout. Watch for a break above the upper blue trendline. If that snaps, the nap is over, and the race is back on. Current Status: Loading the next impulse move up.
سولانا در دام سقوط: آیا کف جدید در راه است؟ (تحلیل ساختار نزولی)
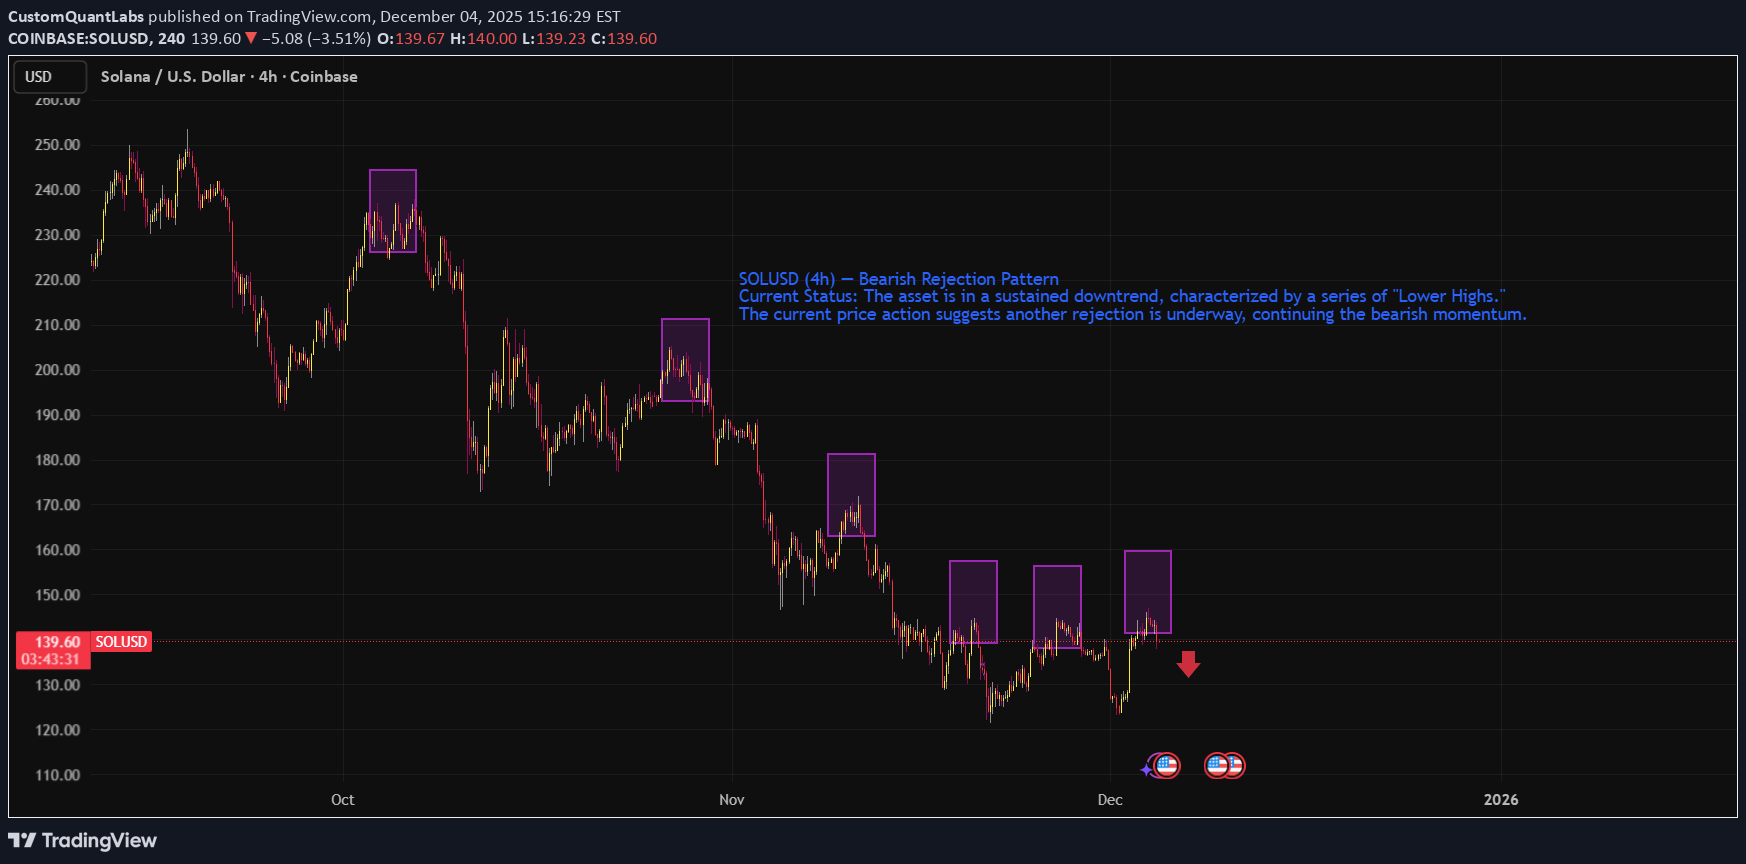
SOL/USD is in a sustained downtrend, characterized by a series of "Lower Highs." The current price action suggests another rejection is underway, continuing the bearish momentum. 1. Price Action: The "Lower High" Structure The chart visually highlights (via purple boxes) a classic bearish market structure. Since the high near $240, SOL has failed to reclaim previous peaks. The Pattern: Each rally attempt (purple box) runs out of momentum at a lower price point than the previous one ($240 -> $210 -> $180 -> $160 -> $140). Current State: The price recently rallied into the $150-$160 zone (the right-most purple boxes) and is currently reacting negatively, dropping to $139.83. The current setup suggests a short opportunity as the price rejects off the most recent lower high.
بیت کوین در آستانه سقوط؟ چرا باید منتظر «قله پایینتر» بمانیم!
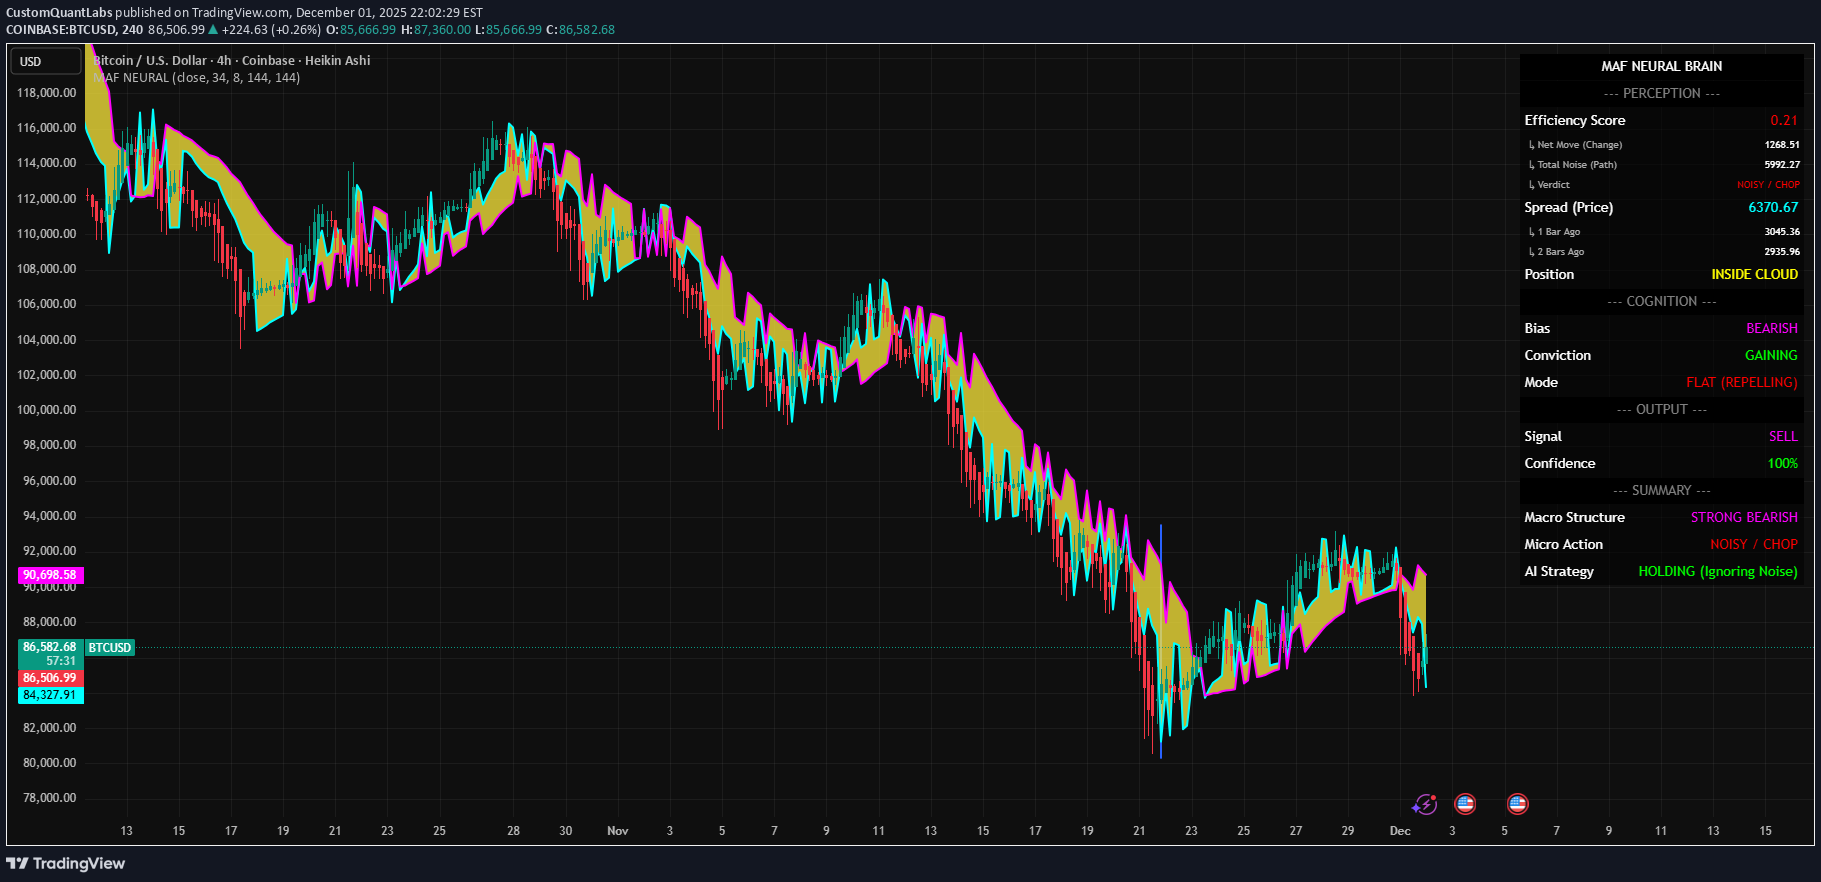
1. The Context (Neural Proxy) Trend: BEARISH (Magenta Cloud). Strength: STRONG (Wide separation between lines). Status: HOLDING (Ignoring the noise inside the cloud). 2. The Structure (Structure Brain) Last Event: MSS (Bearish). The market recently broke a key support level, confirming the downtrend. Current Phase: CORRECTION. Price is pulling back up towards the cloud. Key Level: The dashboard will show you the exact price of the recent Lower High. This is your line in the sand. 3. The Trade Plan (Action) Bias: SHORT. Action: "SELL RALLY < [Key Level]". Translation: Do not short yet. Wait for the rally to stall below the Key Level, then enter on the rejection. Summary: The AI is telling you to be patient. The trend is down, but we are in a pullback. Wait for the lower high to form, then strike.
سولانا در آستانه انفجار قیمتی؟ تحلیل کمی نشان میدهد: زمان خرید فرا رسیده است؟
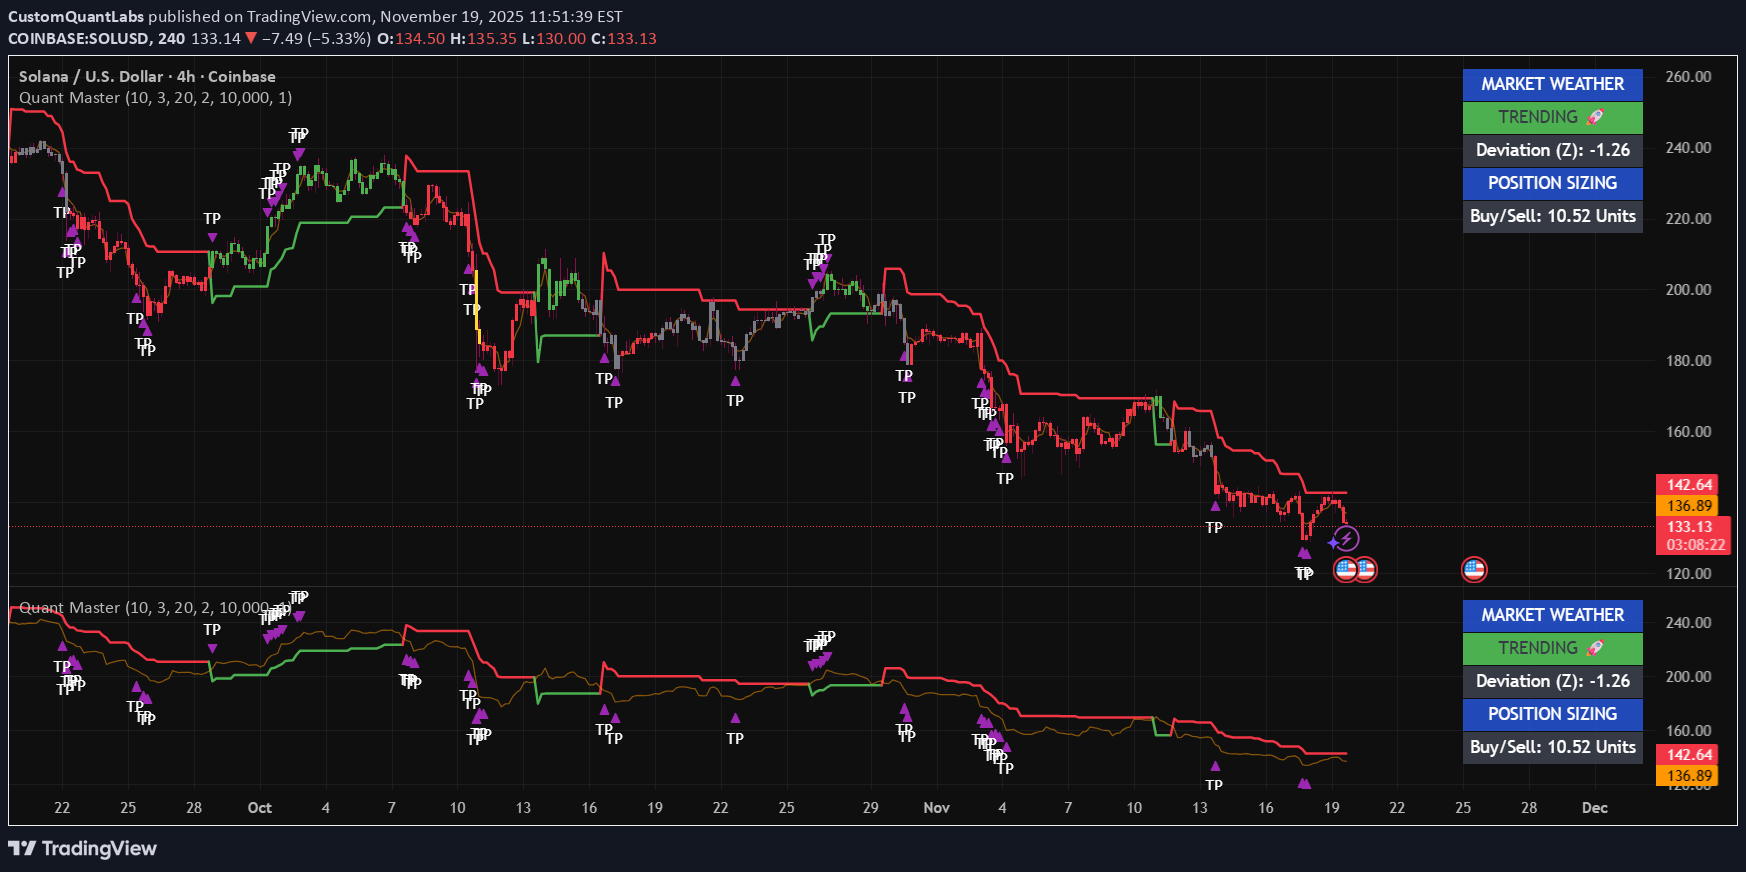
Solana has been in a relentless downtrend, but my Quant Master system is finally flashing signs of seller exhaustion. What the Algo sees: The Trend is still Bearish: The candles are Red. Price is below the Supertrend and below the institutional VWAP anchor. The trend is down, do not fight the current. The "TP" Signal (Bottom Right): Notice the small Purple Triangle that just printed at the lows ($130 region). This signals that Price has deviated significantly from the mean. Historically (look at the chart left), these TP signals mark local bottoms where shorts should cover. The Data: Z-Score: -1.3 (Approaching the -2.0 "Bounce Zone"). Market Weather: Trending (Green Label) but deep in bearish territory. My Game Plan: The "TP" tells me to stop shorting, but the "Red Candles" tell me it is too early to buy. I am waiting for the Z-Score to hit -2.0 OR for a confirmed Blue Candle close above $142 to confirm the reversal. Until then, patience pays.
تحلیل بیت کوین با ساختار دقیق: استراتژی من برای خواندن روند نزولی BTC در حال حاضر
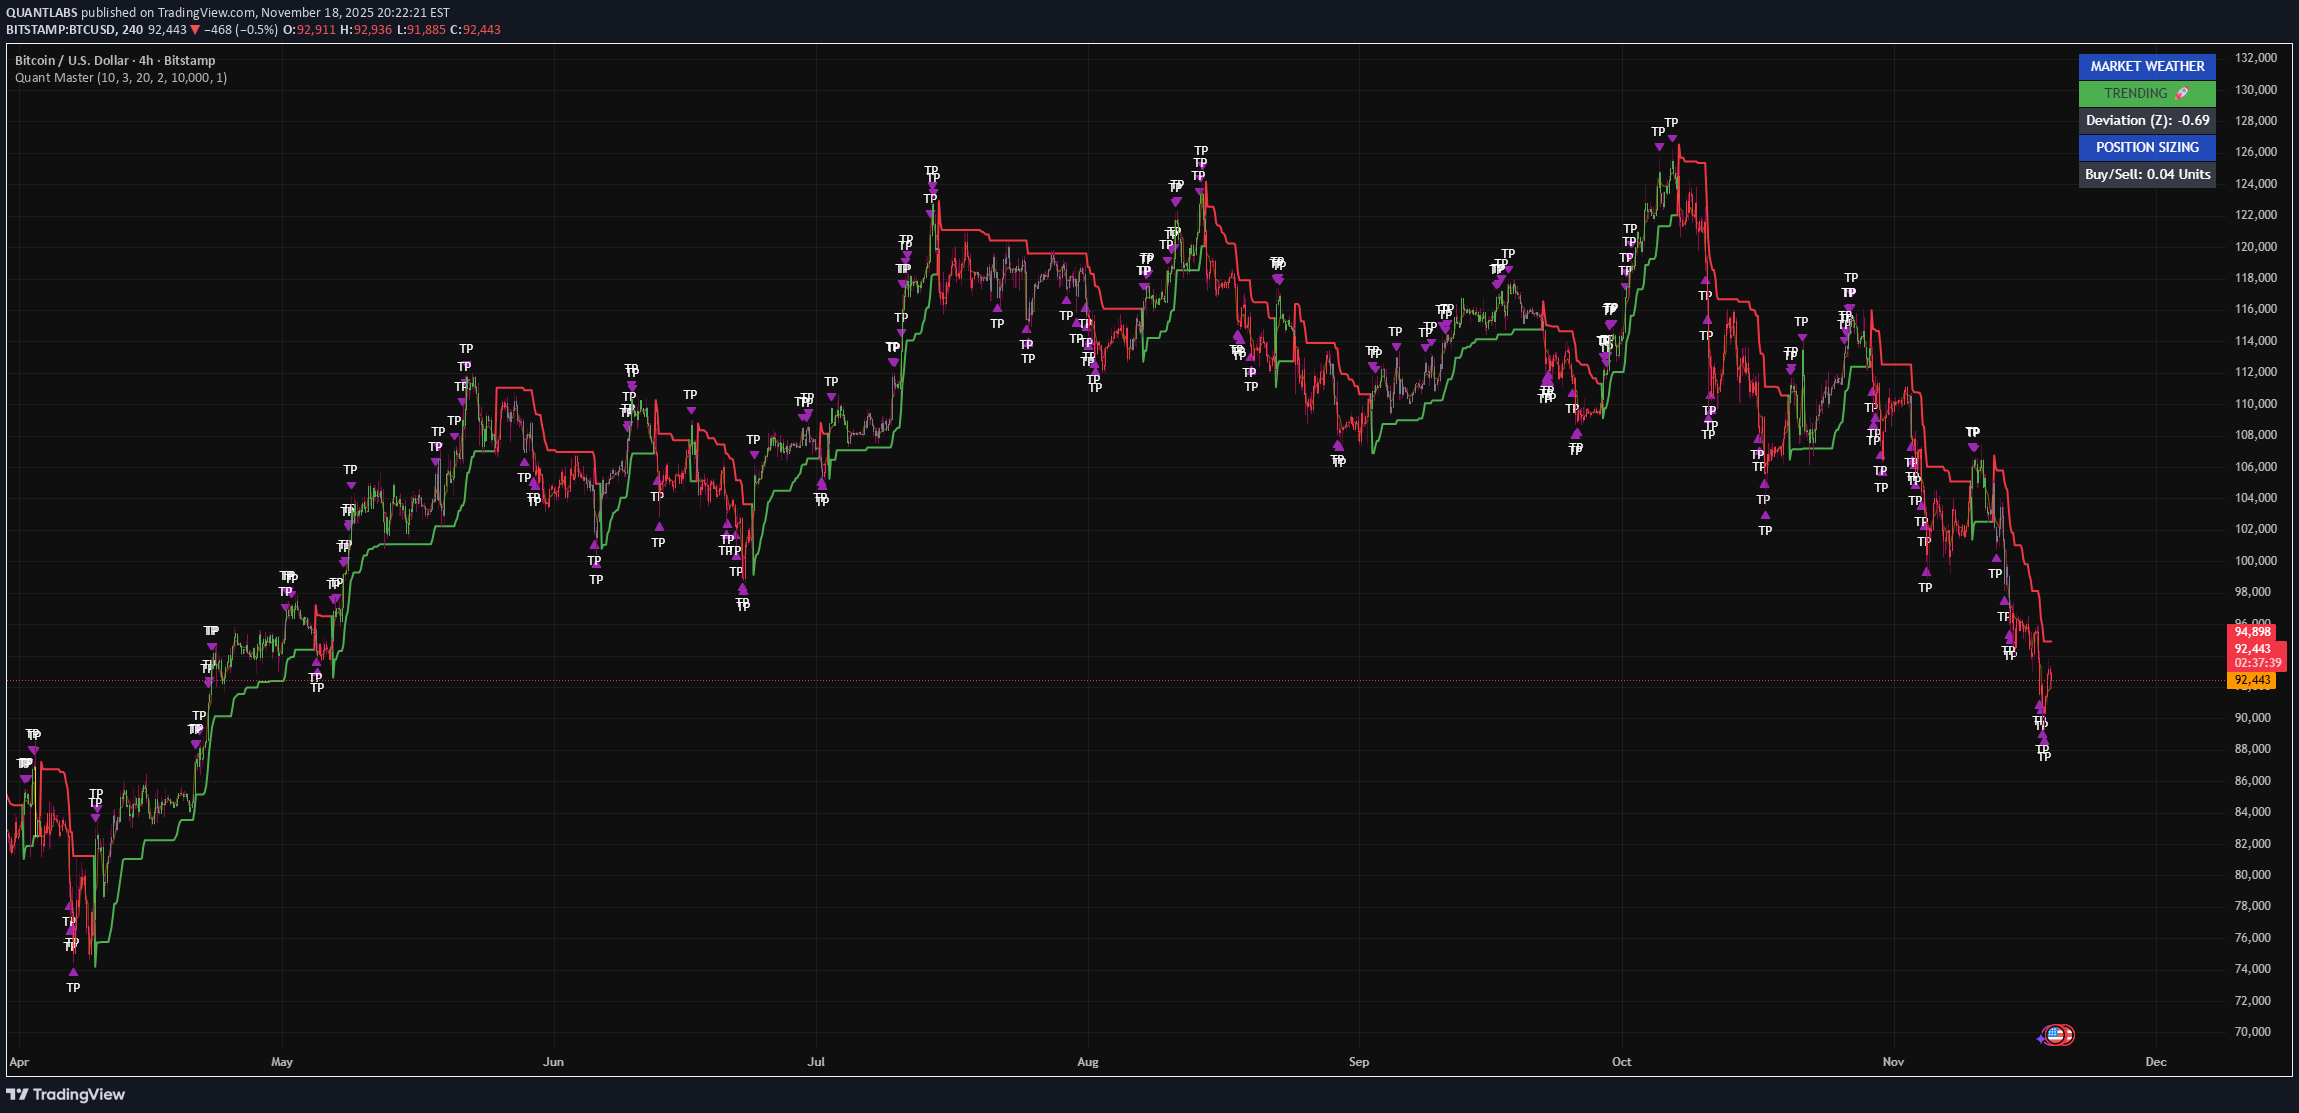
I’m tracking BTC/USD on the 4-hour using my Quant Master Trend System — the model I built to strip out randomness and show the true directional pressure underneath the chart. Right now the ribbon is firmly red, and every bounce has been rejected before it could claw back into the green momentum base. That base has flipped into resistance, which is exactly what I look for in a mature downtrend. Market Weather is still TRENDING, and whenever I see a red ribbon with TRENDING conditions, it tells me the same thing every time: The trend is strong, pullbacks aren’t dips — they’re continuation setups, and bulls don’t have control yet. My deviation reading sits around Z ≈ -0.8, which means price is stretched but not in full capitulation territory. This is still controlled downside, not panic. Look at the structure: every green-to-red flip this year has produced multi-leg down cycles. TP clusters show distribution before each leg, and I’m seeing that same signature forming right now. This entire move is a clean, mature downtrend. My indicator is reading it with absolute clarity.
Disclaimer
Any content and materials included in Sahmeto's website and official communication channels are a compilation of personal opinions and analyses and are not binding. They do not constitute any recommendation for buying, selling, entering or exiting the stock market and cryptocurrency market. Also, all news and analyses included in the website and channels are merely republished information from official and unofficial domestic and foreign sources, and it is obvious that users of the said content are responsible for following up and ensuring the authenticity and accuracy of the materials. Therefore, while disclaiming responsibility, it is declared that the responsibility for any decision-making, action, and potential profit and loss in the capital market and cryptocurrency market lies with the trader.