Technical analysis by CustomQuantLabs about Symbol SOL: Sell recommendation (12/4/2025)

سولانا در دام سقوط: آیا کف جدید در راه است؟ (تحلیل ساختار نزولی)
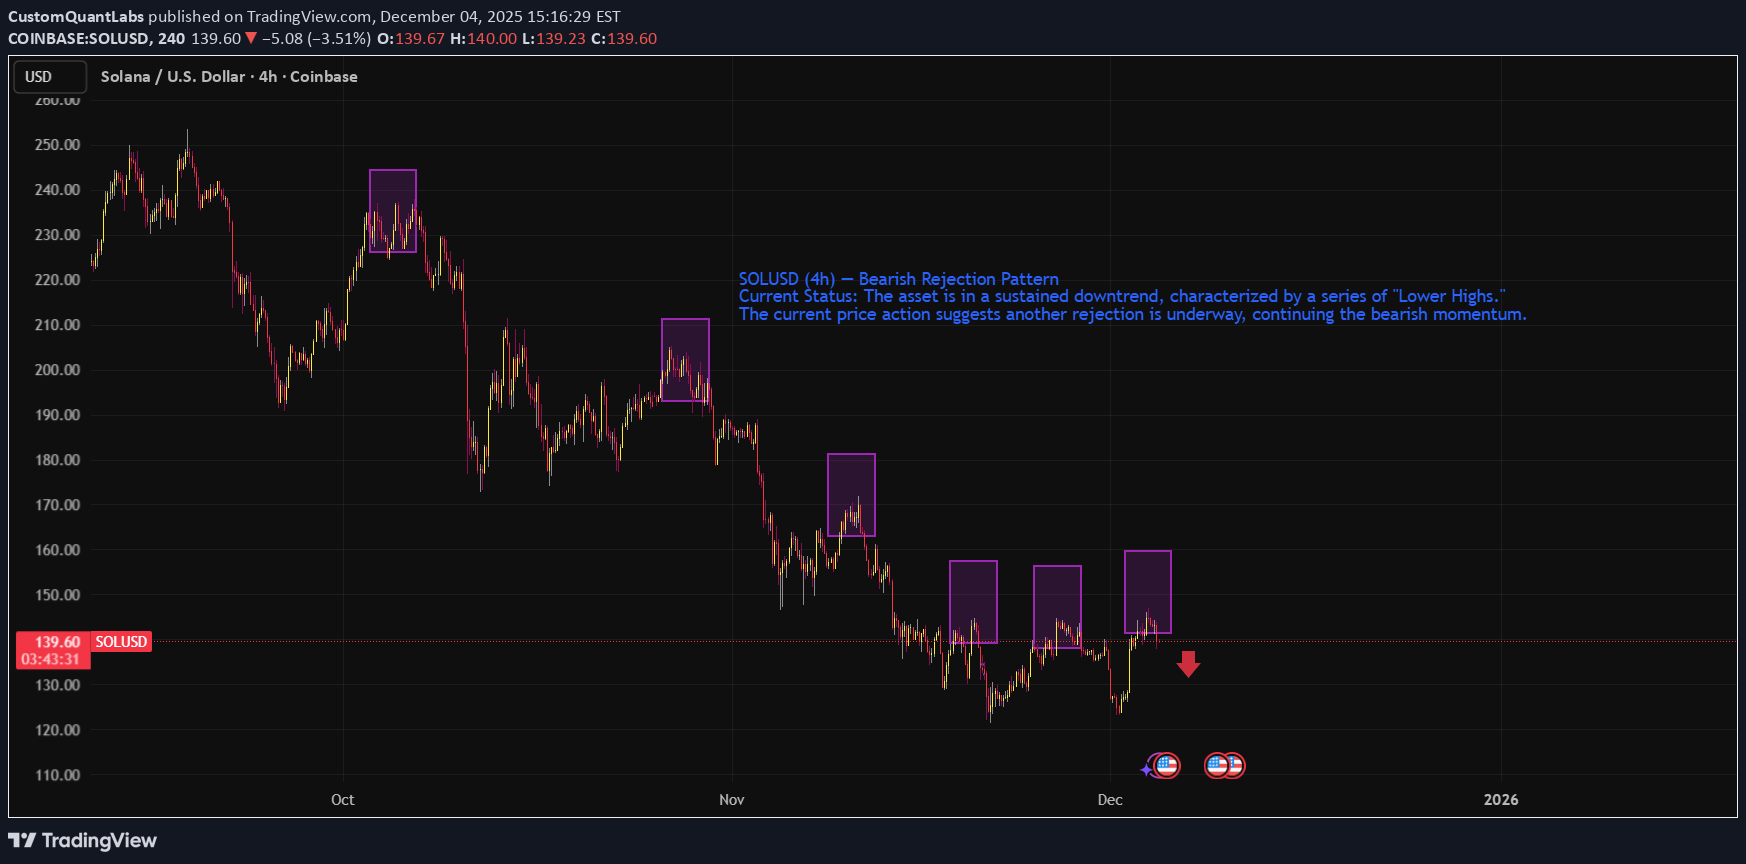
SOL/USD is in a sustained downtrend, characterized by a series of "Lower Highs." The current price action suggests another rejection is underway, continuing the bearish momentum. 1. Price Action: The "Lower High" Structure The chart visually highlights (via purple boxes) a classic bearish market structure. Since the high near $240, SOL has failed to reclaim previous peaks. The Pattern: Each rally attempt (purple box) runs out of momentum at a lower price point than the previous one ($240 -> $210 -> $180 -> $160 -> $140). Current State: The price recently rallied into the $150-$160 zone (the right-most purple boxes) and is currently reacting negatively, dropping to $139.83. The current setup suggests a short opportunity as the price rejects off the most recent lower high.