
Cryptobillionairesss
@t_Cryptobillionairesss

What symbols does the trader recommend buying?
Purchase History
پیام های تریدر
Filter
Cryptobillionairesss
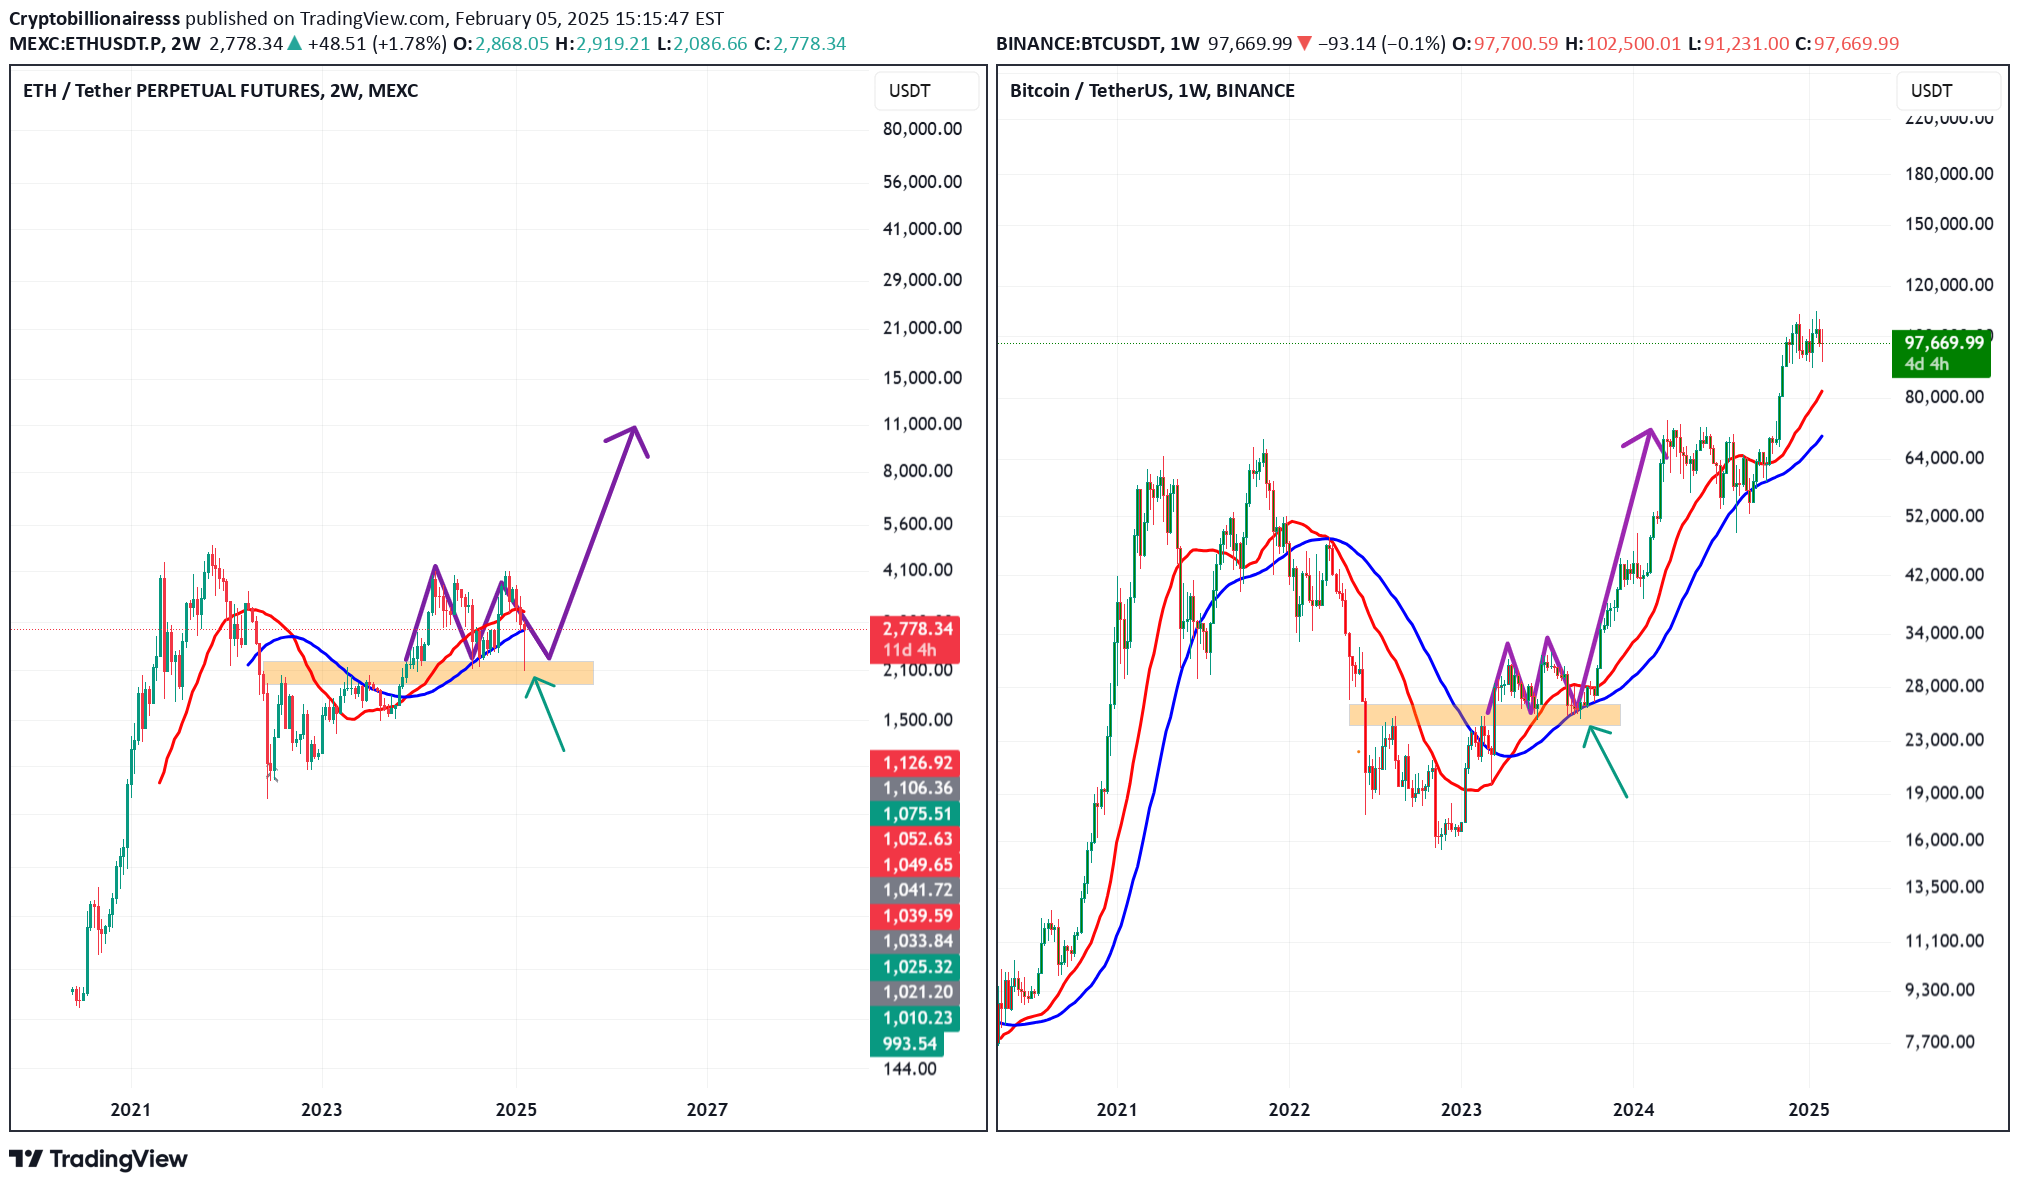
You see the Bitcoin chart on the weekly timeframe on the right, which we posted two and a half years ago (telegram channel) And we said it would be the start of the Bitcoin pump up, and it did! Now you see the Ethereum chart on the left, on the two-weekly timeframe, with the same pattern! What it takes is to suffer in this area for a while and then move. In fact, this Ethereum range is the most important range among all market charts. Whether the price is high or low determines many things. I have been checking the charts for a few days. The old patterns of almost all altcoins have been broken and the charts are terrible, which of course, in the case of altcoins, they can fake the disaster on the charts! But the two-weekly Ethereum chart is the only promising chart in the market that can turn the page. Now there is only one thing left, and that is to assume that my analysis is correct and Ethereum suffers above this range for a while and then starts moving. So, what could be the behavior of altcoins during this period when Ethereum is going to suffer above this range?
Cryptobillionairesss
OP

you can see my previous opti chart idea now : The range box is broken and we are completing the pullback
Cryptobillionairesss
LDO

After breaking the trendline and crossing the weekly resistance, if the daily candle closes in this are, it can move to the first target.
Cryptobillionairesss
flow

According to Dow's theory This is the range where the price leaves the bearish state and enters the bullish cycle see you in 2025 with this chart...
Cryptobillionairesss
ARB

this is my target for ARB after new ATH this is longterm target guys
Cryptobillionairesss

Cryptobillionairesss
GRT

After breaking the trend line and crossing the big weekly resistance, I expect to reach the specified yellow targets
Cryptobillionairesss
UNI

after breaking the upperline of triangle and 2 trend lines in weekly chart, now i expected to see the first target (yellow) in the next following days
Cryptobillionairesss
QTUM

after a big reveres head and shoulder pattern in weekly timeframe and the 60 days range above the neckline, now the price is breaking the range box in 4h timeframe and i expect a movement to the targets
Cryptobillionairesss
TIA CELESTIA

After forming a wedge pattern and breaking the lower trendline, we have 2 paths to the yellow target. The first is direct and the second way is to retrace to the trend line (and the new ATH) and then retrace to 5-7
Disclaimer
Any content and materials included in Sahmeto's website and official communication channels are a compilation of personal opinions and analyses and are not binding. They do not constitute any recommendation for buying, selling, entering or exiting the stock market and cryptocurrency market. Also, all news and analyses included in the website and channels are merely republished information from official and unofficial domestic and foreign sources, and it is obvious that users of the said content are responsible for following up and ensuring the authenticity and accuracy of the materials. Therefore, while disclaiming responsibility, it is declared that the responsibility for any decision-making, action, and potential profit and loss in the capital market and cryptocurrency market lies with the trader.