
Crypto_Inside_trading
@t_Crypto_Inside_trading

What symbols does the trader recommend buying?
Purchase History
پیام های تریدر
Filter
Crypto_Inside_trading
چرا سولانا (SOL) در ماههای آینده از بیت کوین پیشی میگیرد؟ (راز خرید در کف قیمت)
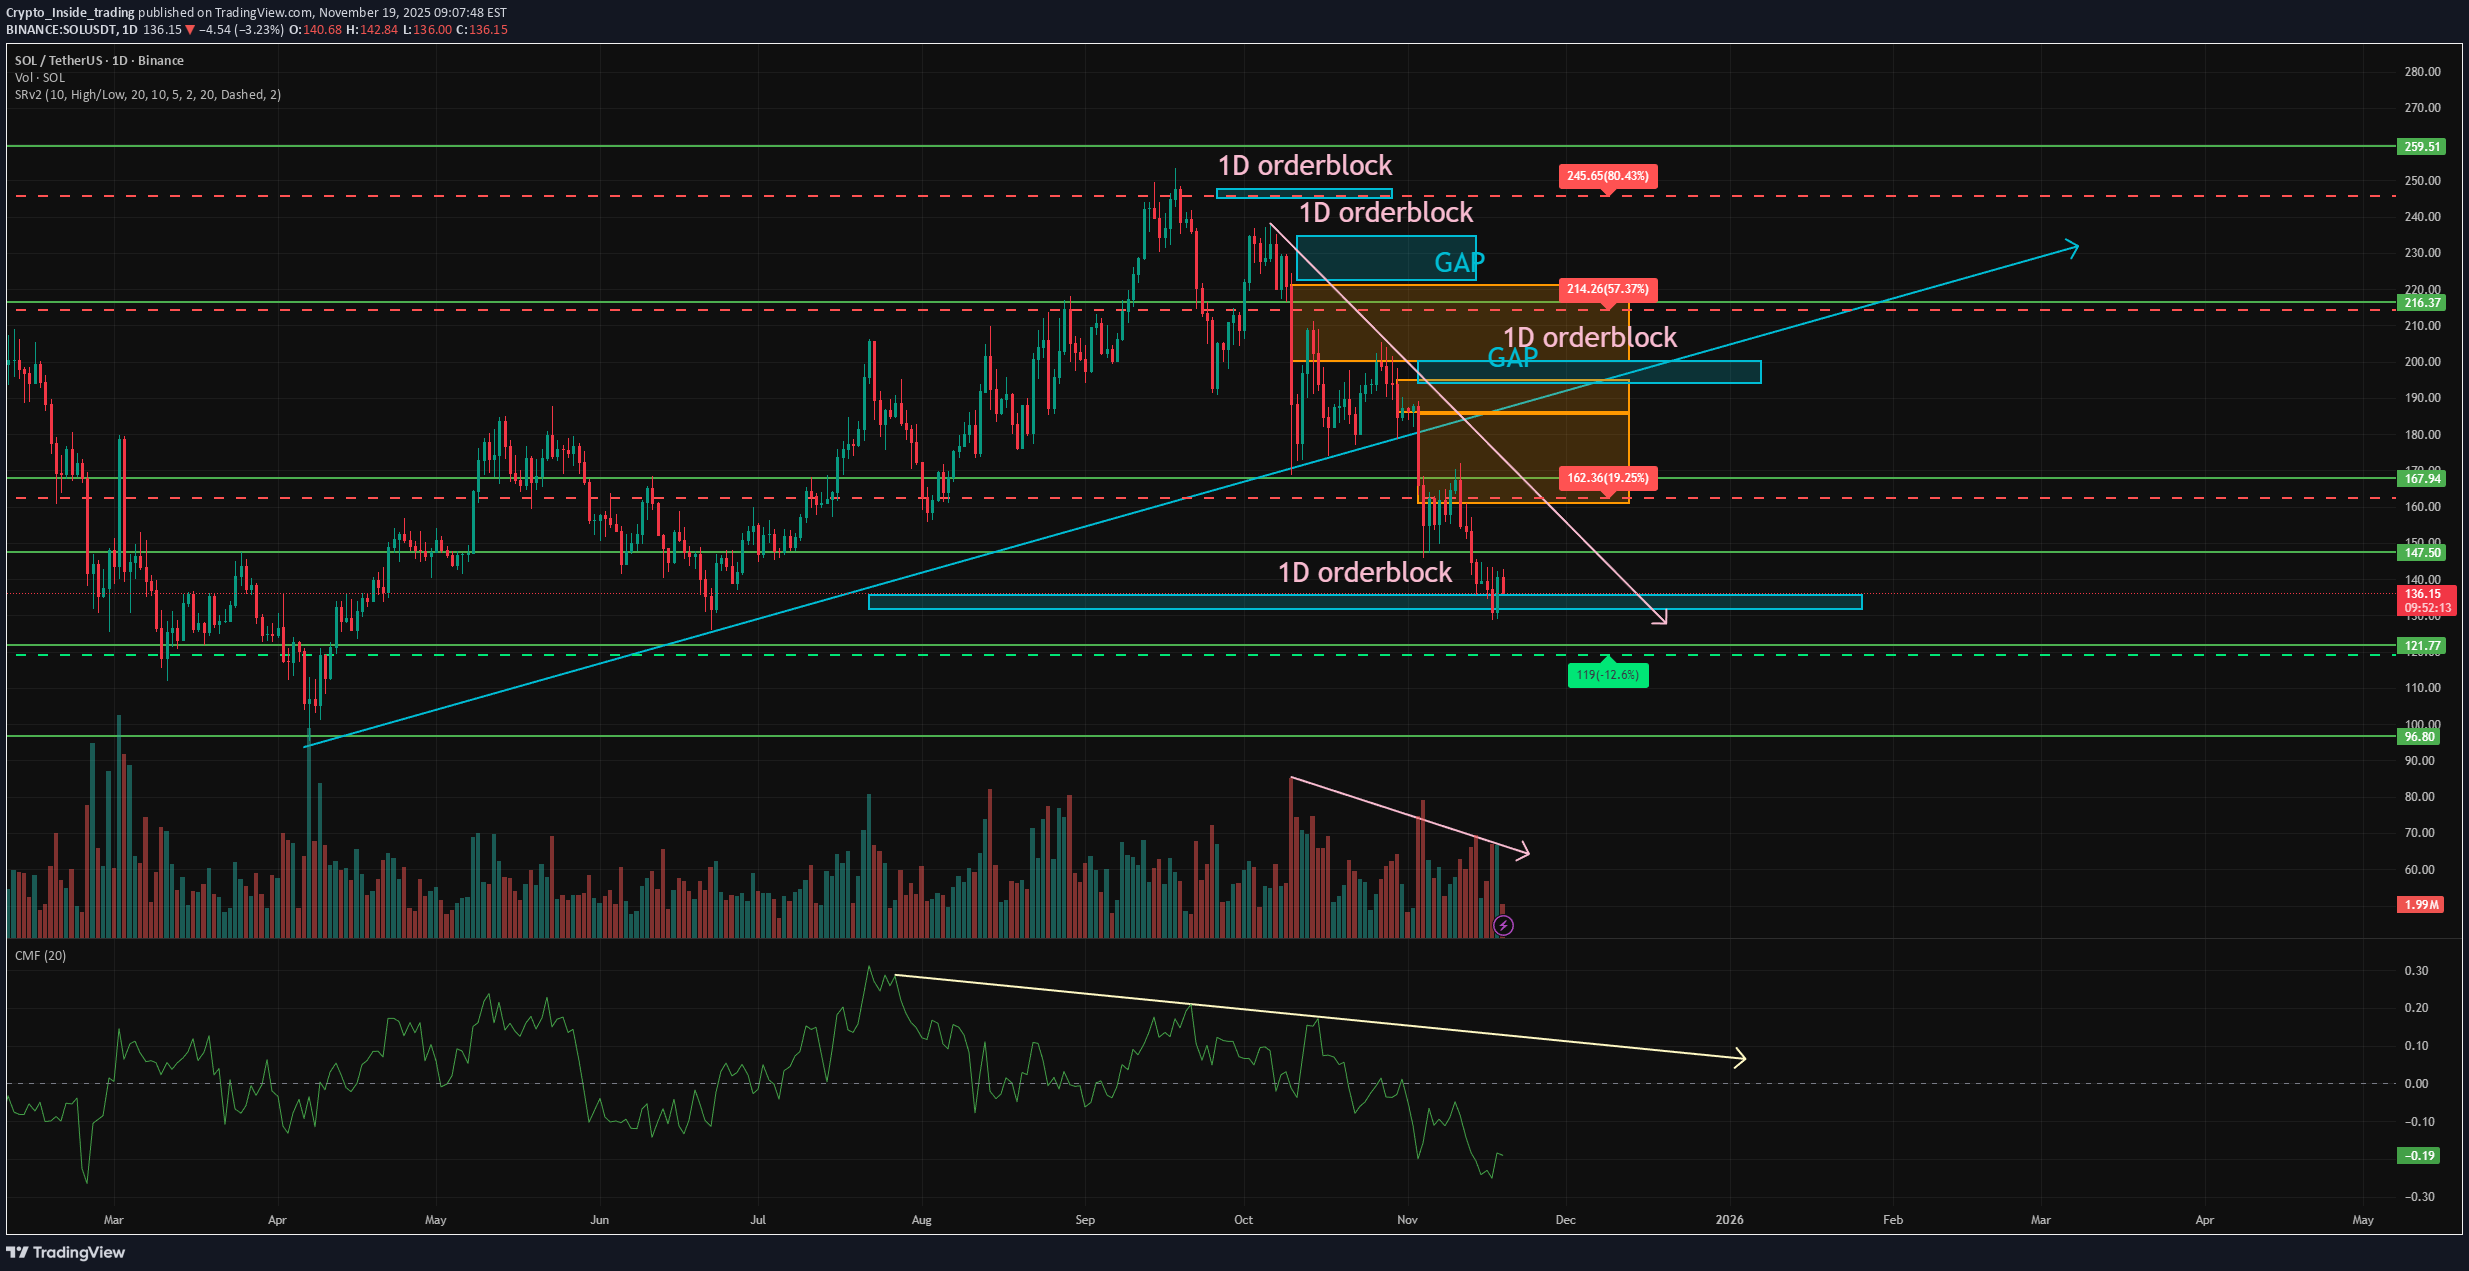
The market continues its powerful crash and while everyone is in panic, real traders use this as an opportunity to buy at a discount. And now I will explain why I am actively buying SOL on spot and why it is the best bet for the next months. 📈 In recent months, while Bitcoin has been dropping 4–5% a day, SOL has been holding strong and either falling by a smaller percentage or even growing by 1–2%. Even today BTC is only 1–2% away from its local bottom, while SOL is 5–6% away. This is largely due to the newly launched SOL ETF. While BTC and ETH ETFs are seeing record outflows, the SOL ETF has not had a single day of outflows yet. Despite the correction, people keep buying SOL. ➡️ As the correction in SOL continues, selling volumes keep decreasing, which shows that selling pressure is going down. ➡️ However, CMF shows liquidity outflows from the asset, which is natural for the market right now. So this is not a reason to panic. ➡️ During the drop, many gaps have also formed above the price. This means that in case of an upward move, the price will move quickly, without facing much resistance. ➡️ Right now the price has reached a large order block on the daily timeframe and has bounced. If the price holds above this level, the next key level is $147. If not, a major support level is waiting around $121. A large demand zone has also formed around this level. 📌 Conclusion: I do not think SOL will fly to a new ATH right now. But as an asset to accumulate on a dip, it is one of the best options at the moment, especially considering the fresh ETF inflows. ✍️ What do you think, does SOL still have a future, or is it already dead?
Crypto_Inside_trading
چرا سولانا (SOL) شانس اول من در موج بعدی بازار است؟ (قویتر از بیت کوین!)
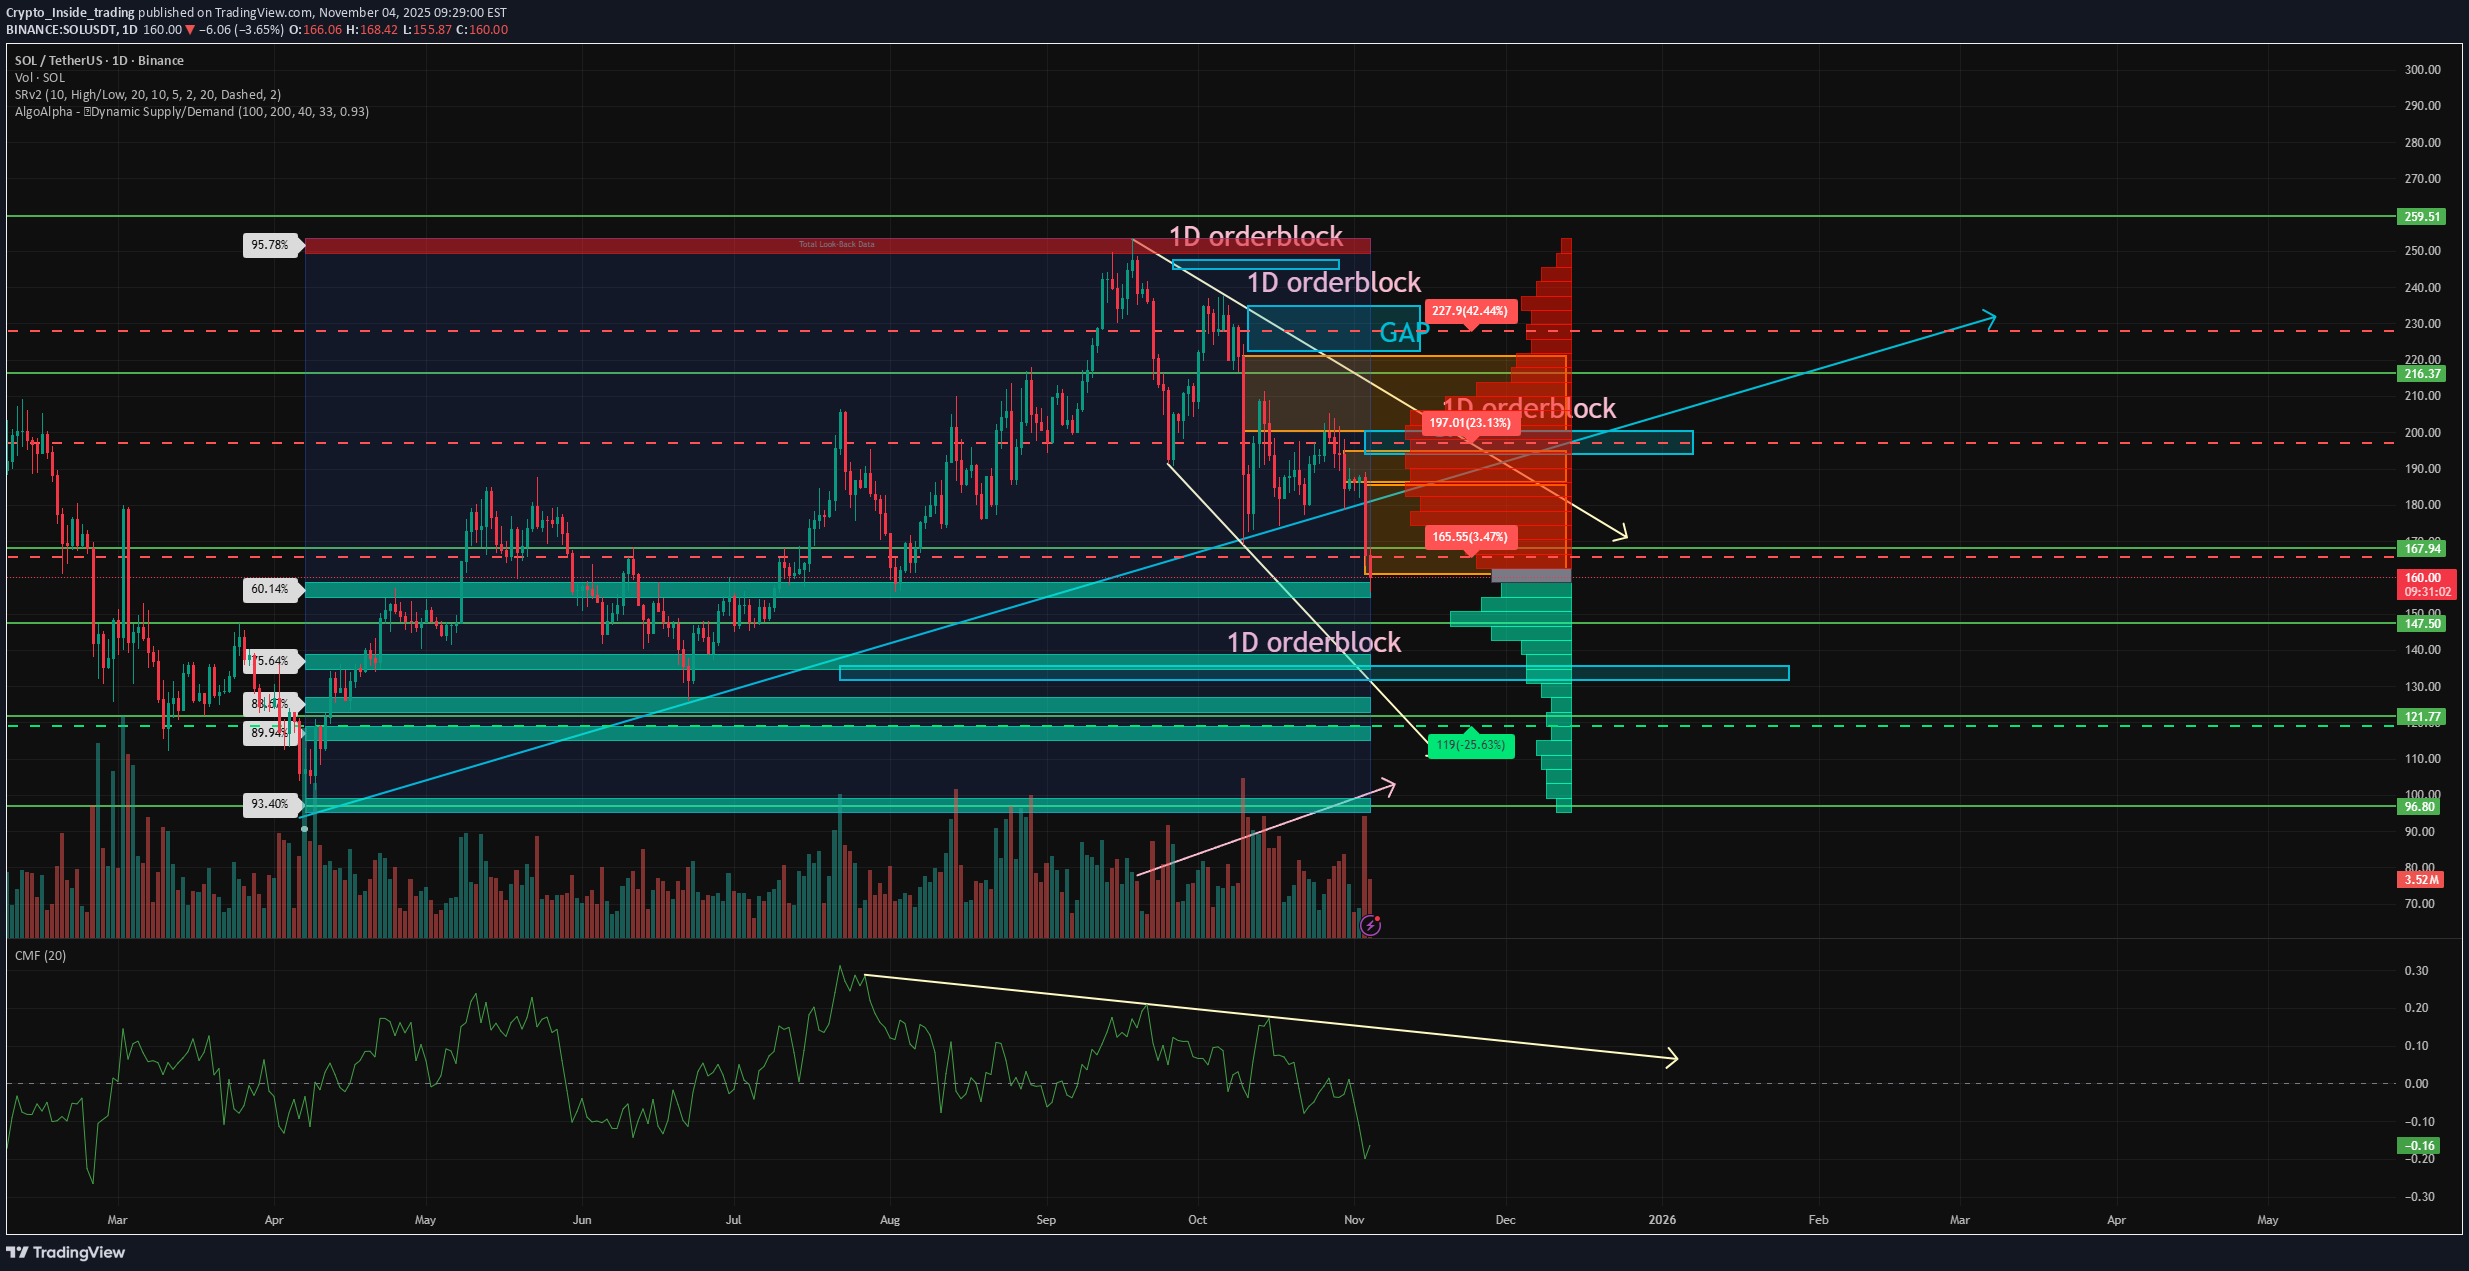
Where some people are afraid and selling, others see an opportunity. Moments like this allow us to accumulate spot positions at good prices. They also help identify obvious market leaders — those who hold stronger than others. Today I will explain why, after analyzing the market, I came to the conclusion that SOL currently looks stronger than Bitcoin and why I’m placing my bet on it. Last week there were days when SOL dropped less in percentage than BTC. Which is basically nonsense for crypto. ➡️ This is primarily related to the newly launched SOL ETF, which has seen inflows from the very first days. And, you know, this is actually the most successful start for a crypto ETF. Because BTC and ETH saw only outflows during the first weeks. ➡️ What we see on the chart: first — yes, a liquidity divergence on the Money Flow has formed. But this is not a secret to anyone, liquidity really leaves the market during such periods and starts returning closer to the bottom. ➡️ Next — the drop was extremely uneven. Despite the lack of major selling volumes, there are a lot of rumors about liquidations and market makers exiting the market, which in turn removed liquidity and now the price moves 10% per day. ➡️ Also, we see harmony in the selling volumes throughout the entire correction. This means the correction is not near its end and sellers are still in control. But no one said SOL will rocket tomorrow. The first thing to look at — where the price may potentially reverse. And the first of such levels is $147. This is a key level of one of the ATHs of the current cycle, which later became an important support level. Below that, there is an order block on the daily timeframe at $135–132. This is where the new impulsive move started back in April this year, therefore the level is important. ➡️ The Supply & Demand indicator shows that major demand has formed around $154–146, confirming the first target where a reaction may occur. I expect Bitcoin to at least retest $99,000 before showing any meaningful bounce. Therefore, the current target levels for SOL look logical. Drop a comment if you’re still alive in this market! 👇
Crypto_Inside_trading
چرا سولانا (SOL) میتواند بیت کوین (BTC) را شکست دهد؟ راز پنهان در سطوح کلیدی!
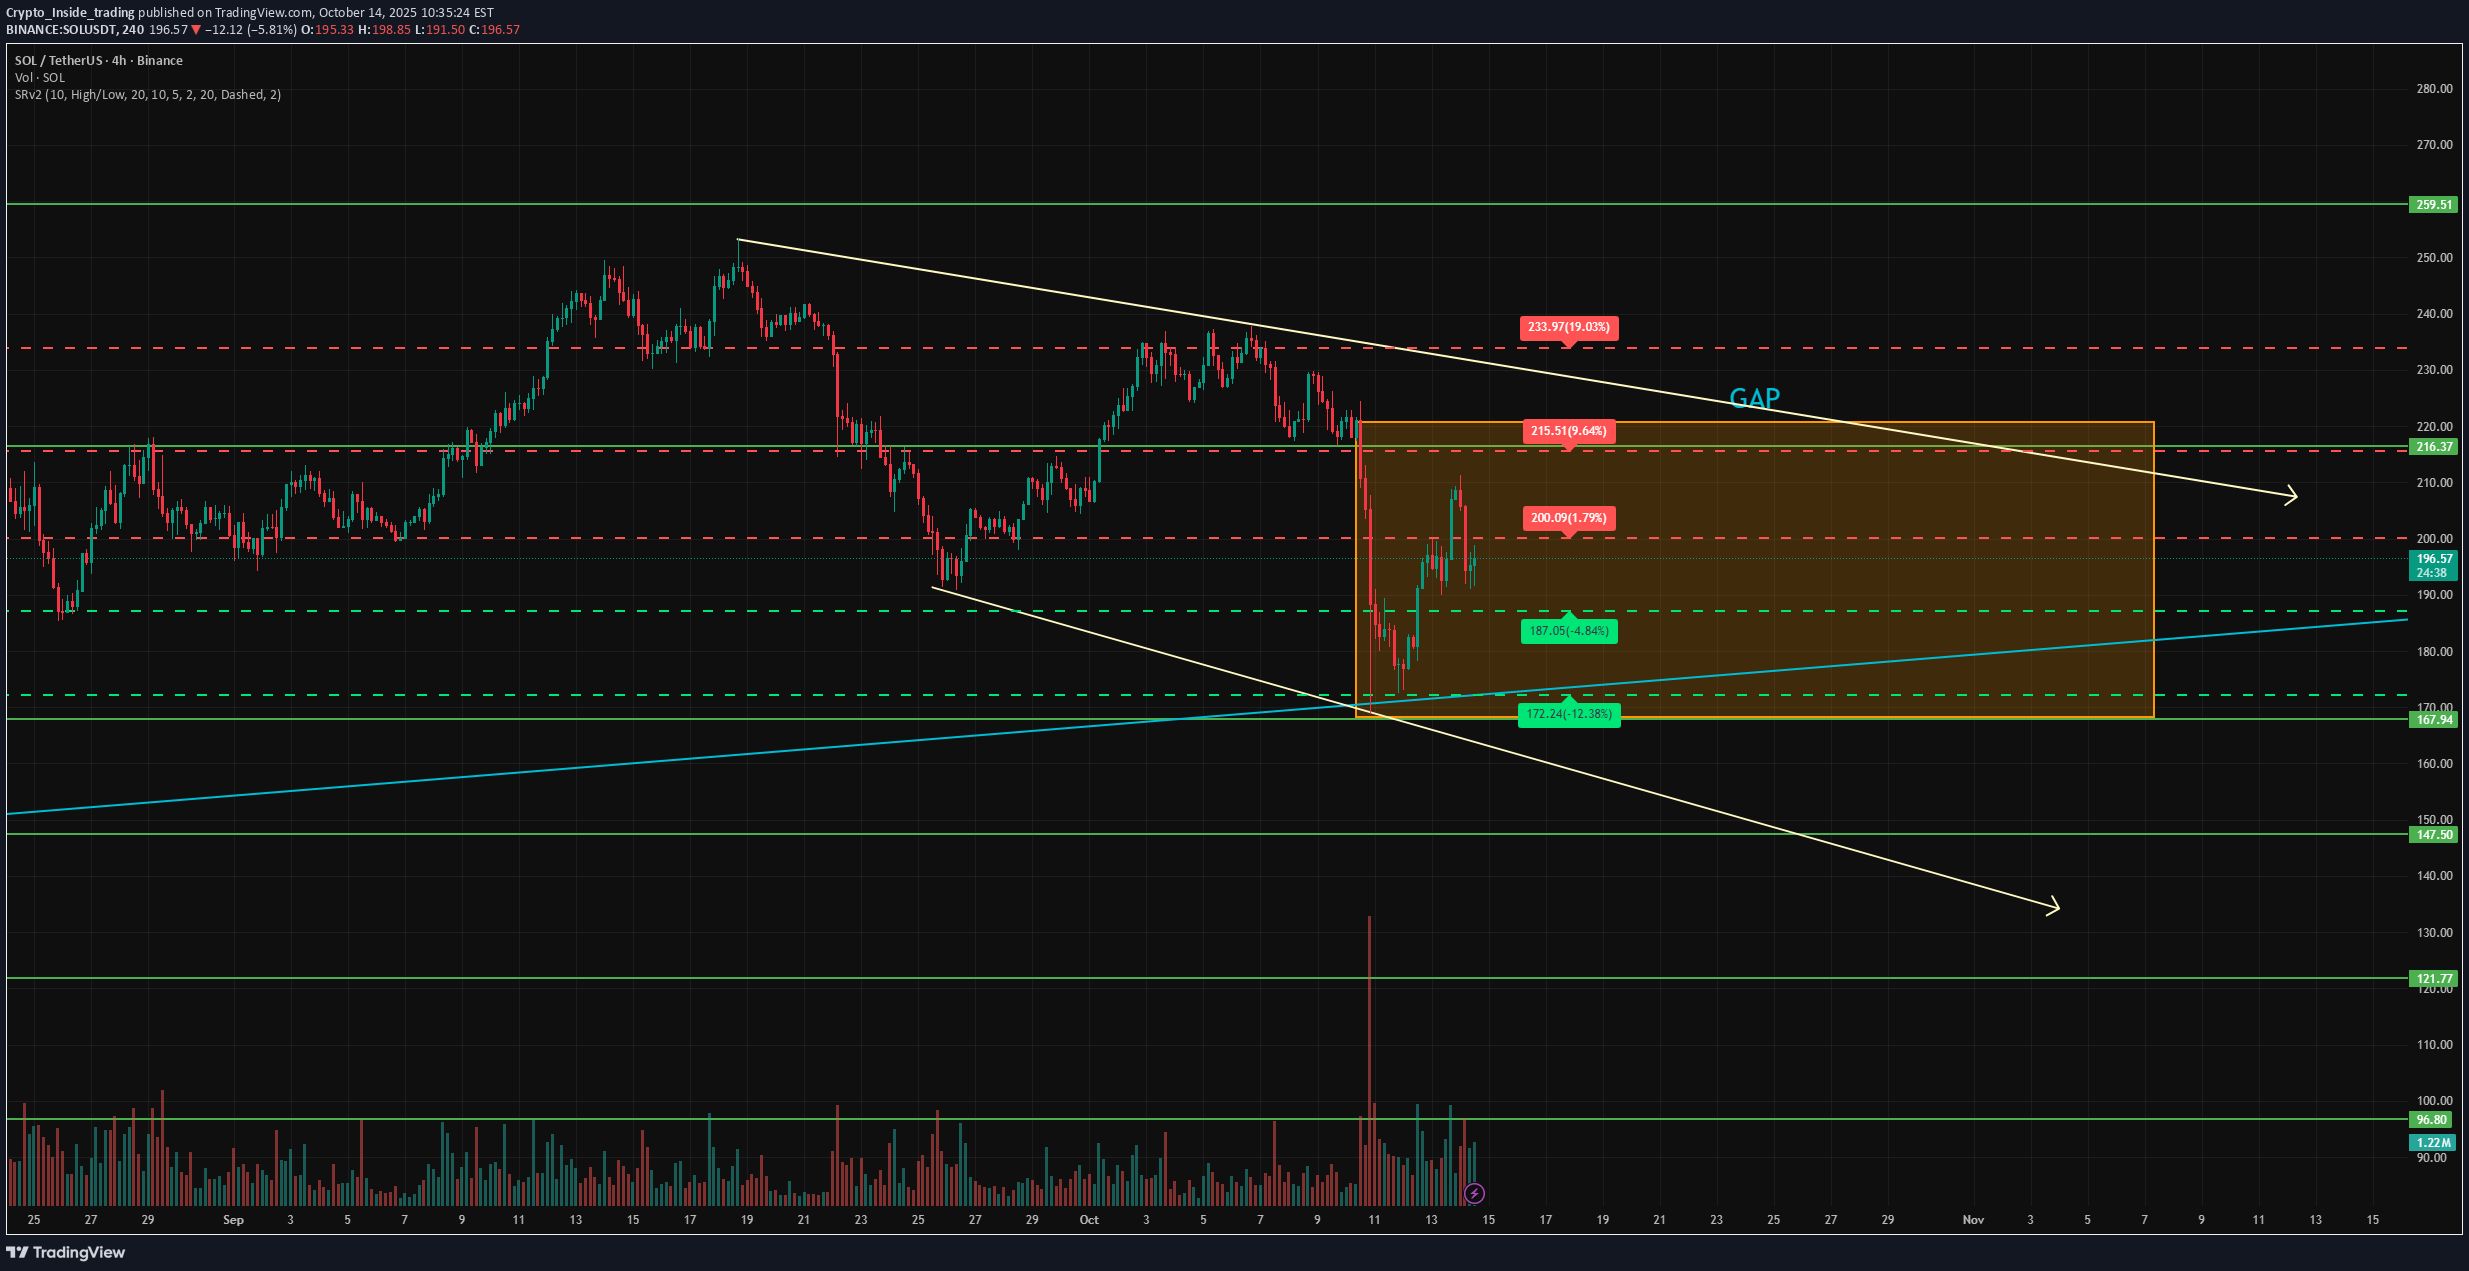
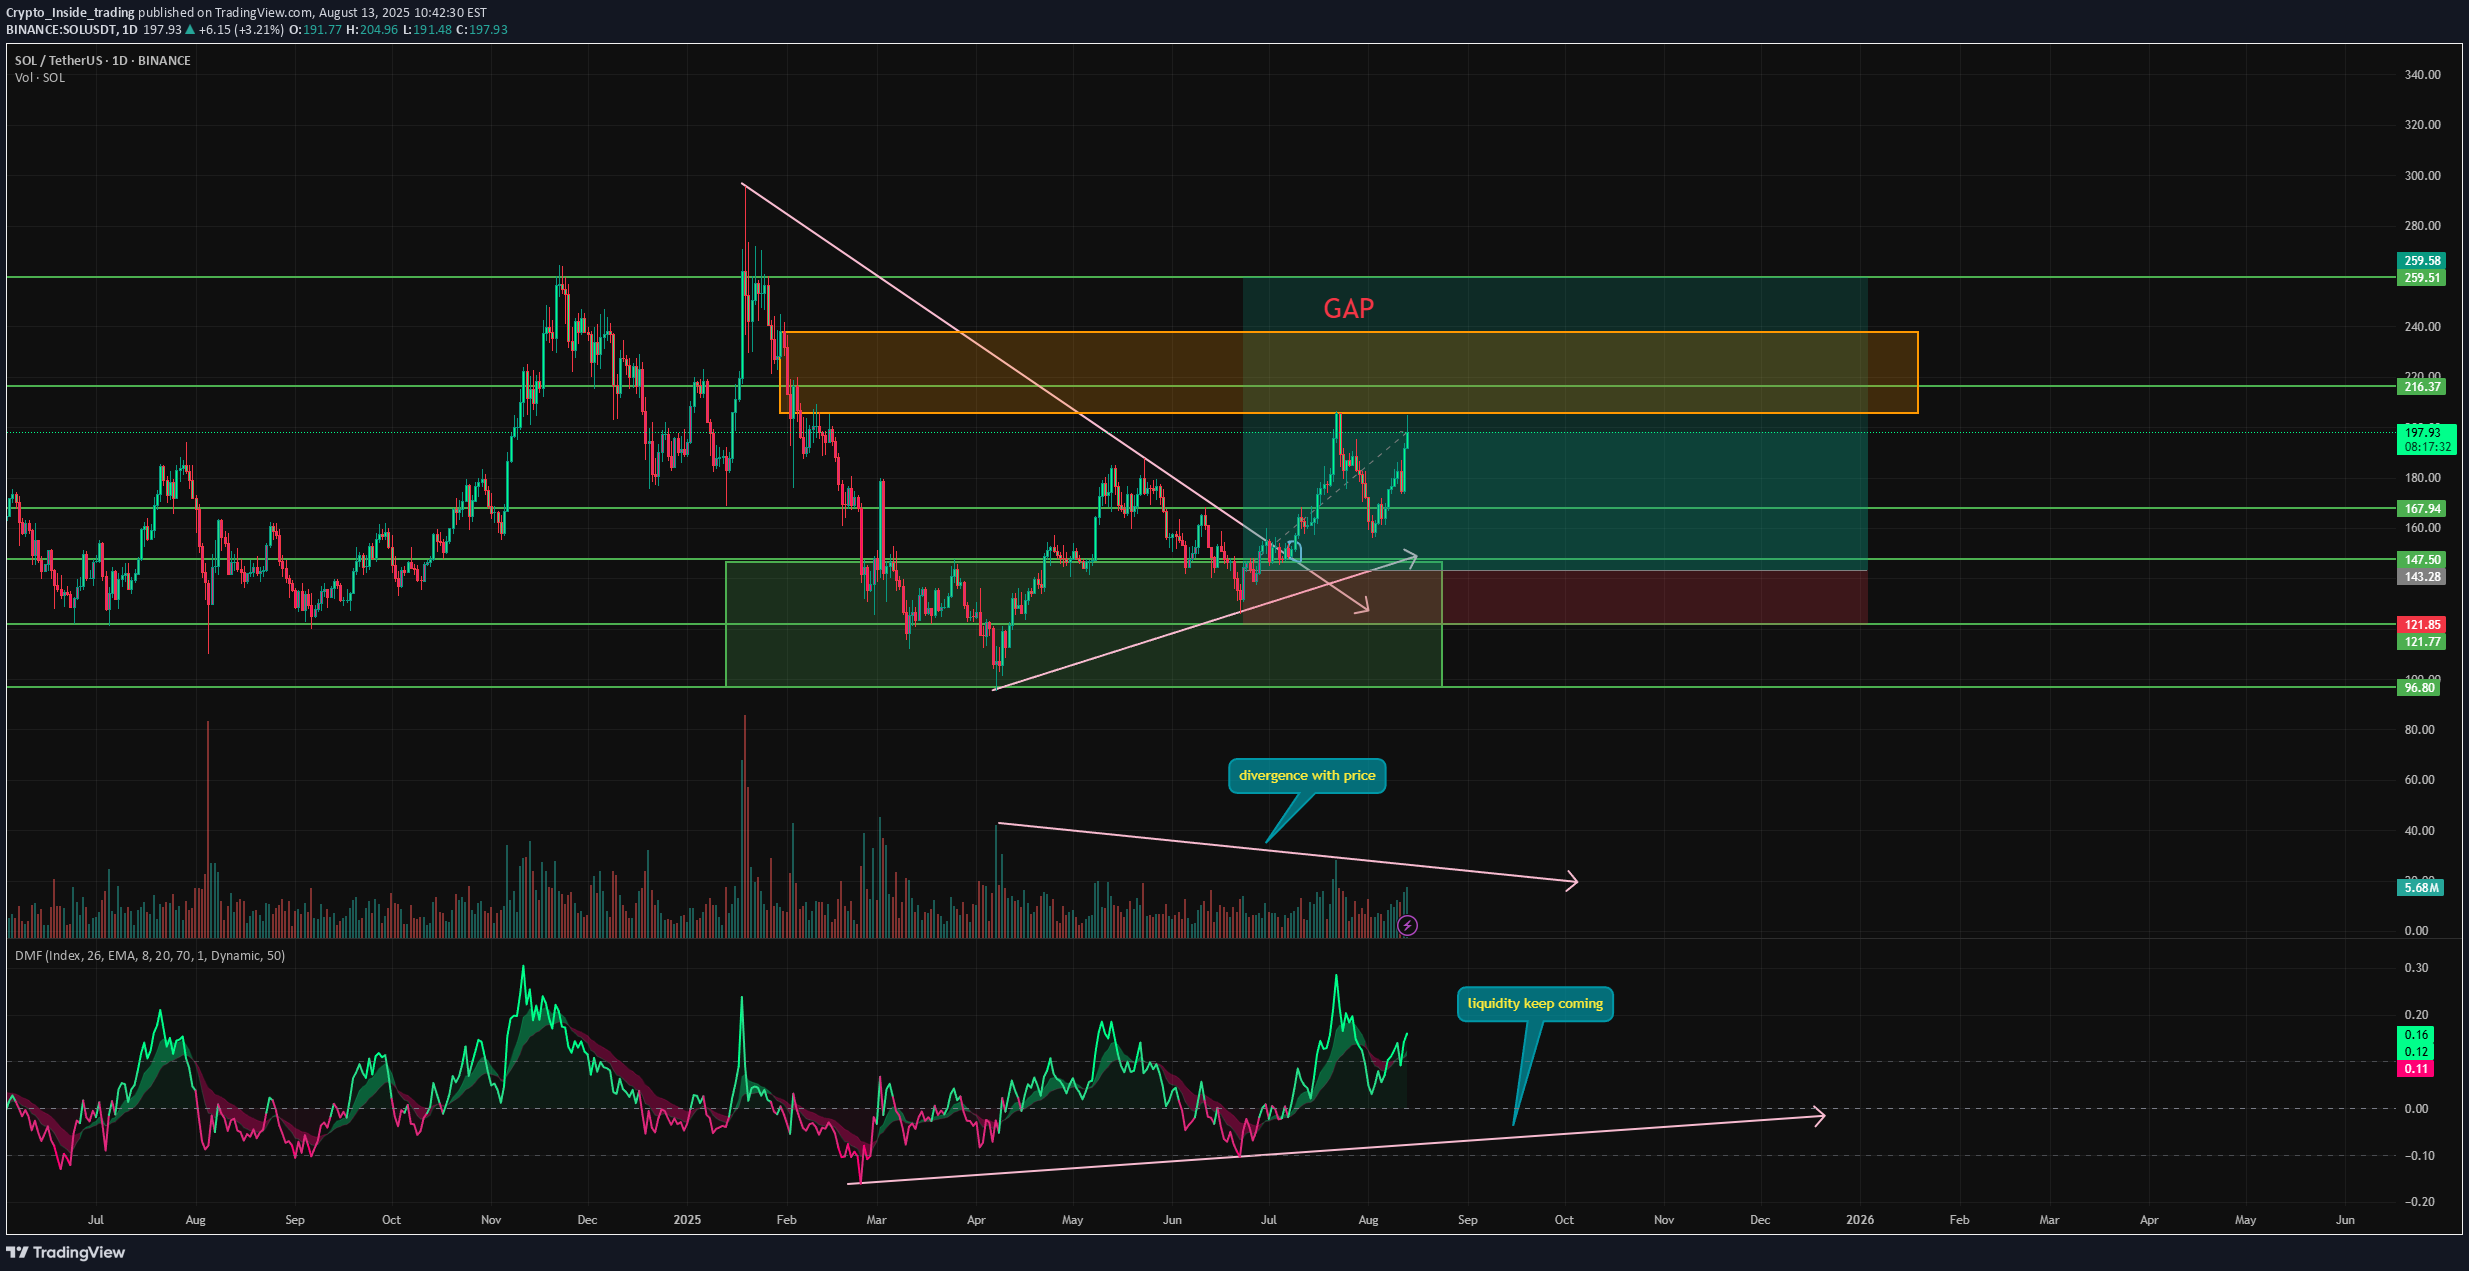
After the recent correction, SOL showed one of the strongest recoveries — not counting the manipulative BNB, where 50% of the supply is held by one person. It’s now trading around the key psychological level of $200. ➡️ The price continues to move within a descending channel, and the current correction has stopped exactly at two major levels: the lower boundary of the descending channel and the ascending support of the six-month trend. ➡️ The fact that the price bounced from this area even during such a volatile period shows that buyers still have confidence in SOL. From a technical standpoint, SOL also remains in an overall uptrend. ➡️ During the correction, a large GAP was formed between $221 – $168 (on some exchanges the price slipped even lower). It has already started to partially close upward, but today we saw a bearish engulfing, sending the price lower again. ➡️ Currently, the price is stuck between two key levels — resistance at $200 and support at $187. If the support breaks first, the lower part of the GAP may be filled, with a potential retest at $168. However, if resistance at $200 breaks first and the price holds above it, a retest of $221 and full GAP closure are likely. ➡️ Buying volumes remain moderate, and overall market sentiment is still negative. But SOL wasn’t as overheated as ETH, meaning fewer liquidations and less frustration among traders. Plus, the key catalyst right now lies with SOL — the upcoming ETF decision in November. That’s why I currently lean toward a long position on SOL around $187, if we get a retest. What do you think? 🤔
Crypto_Inside_trading
چرا هیچکس بیت کوین نمیفروشد؟ راز پشت رکوردشکنی جدید قیمت BTC
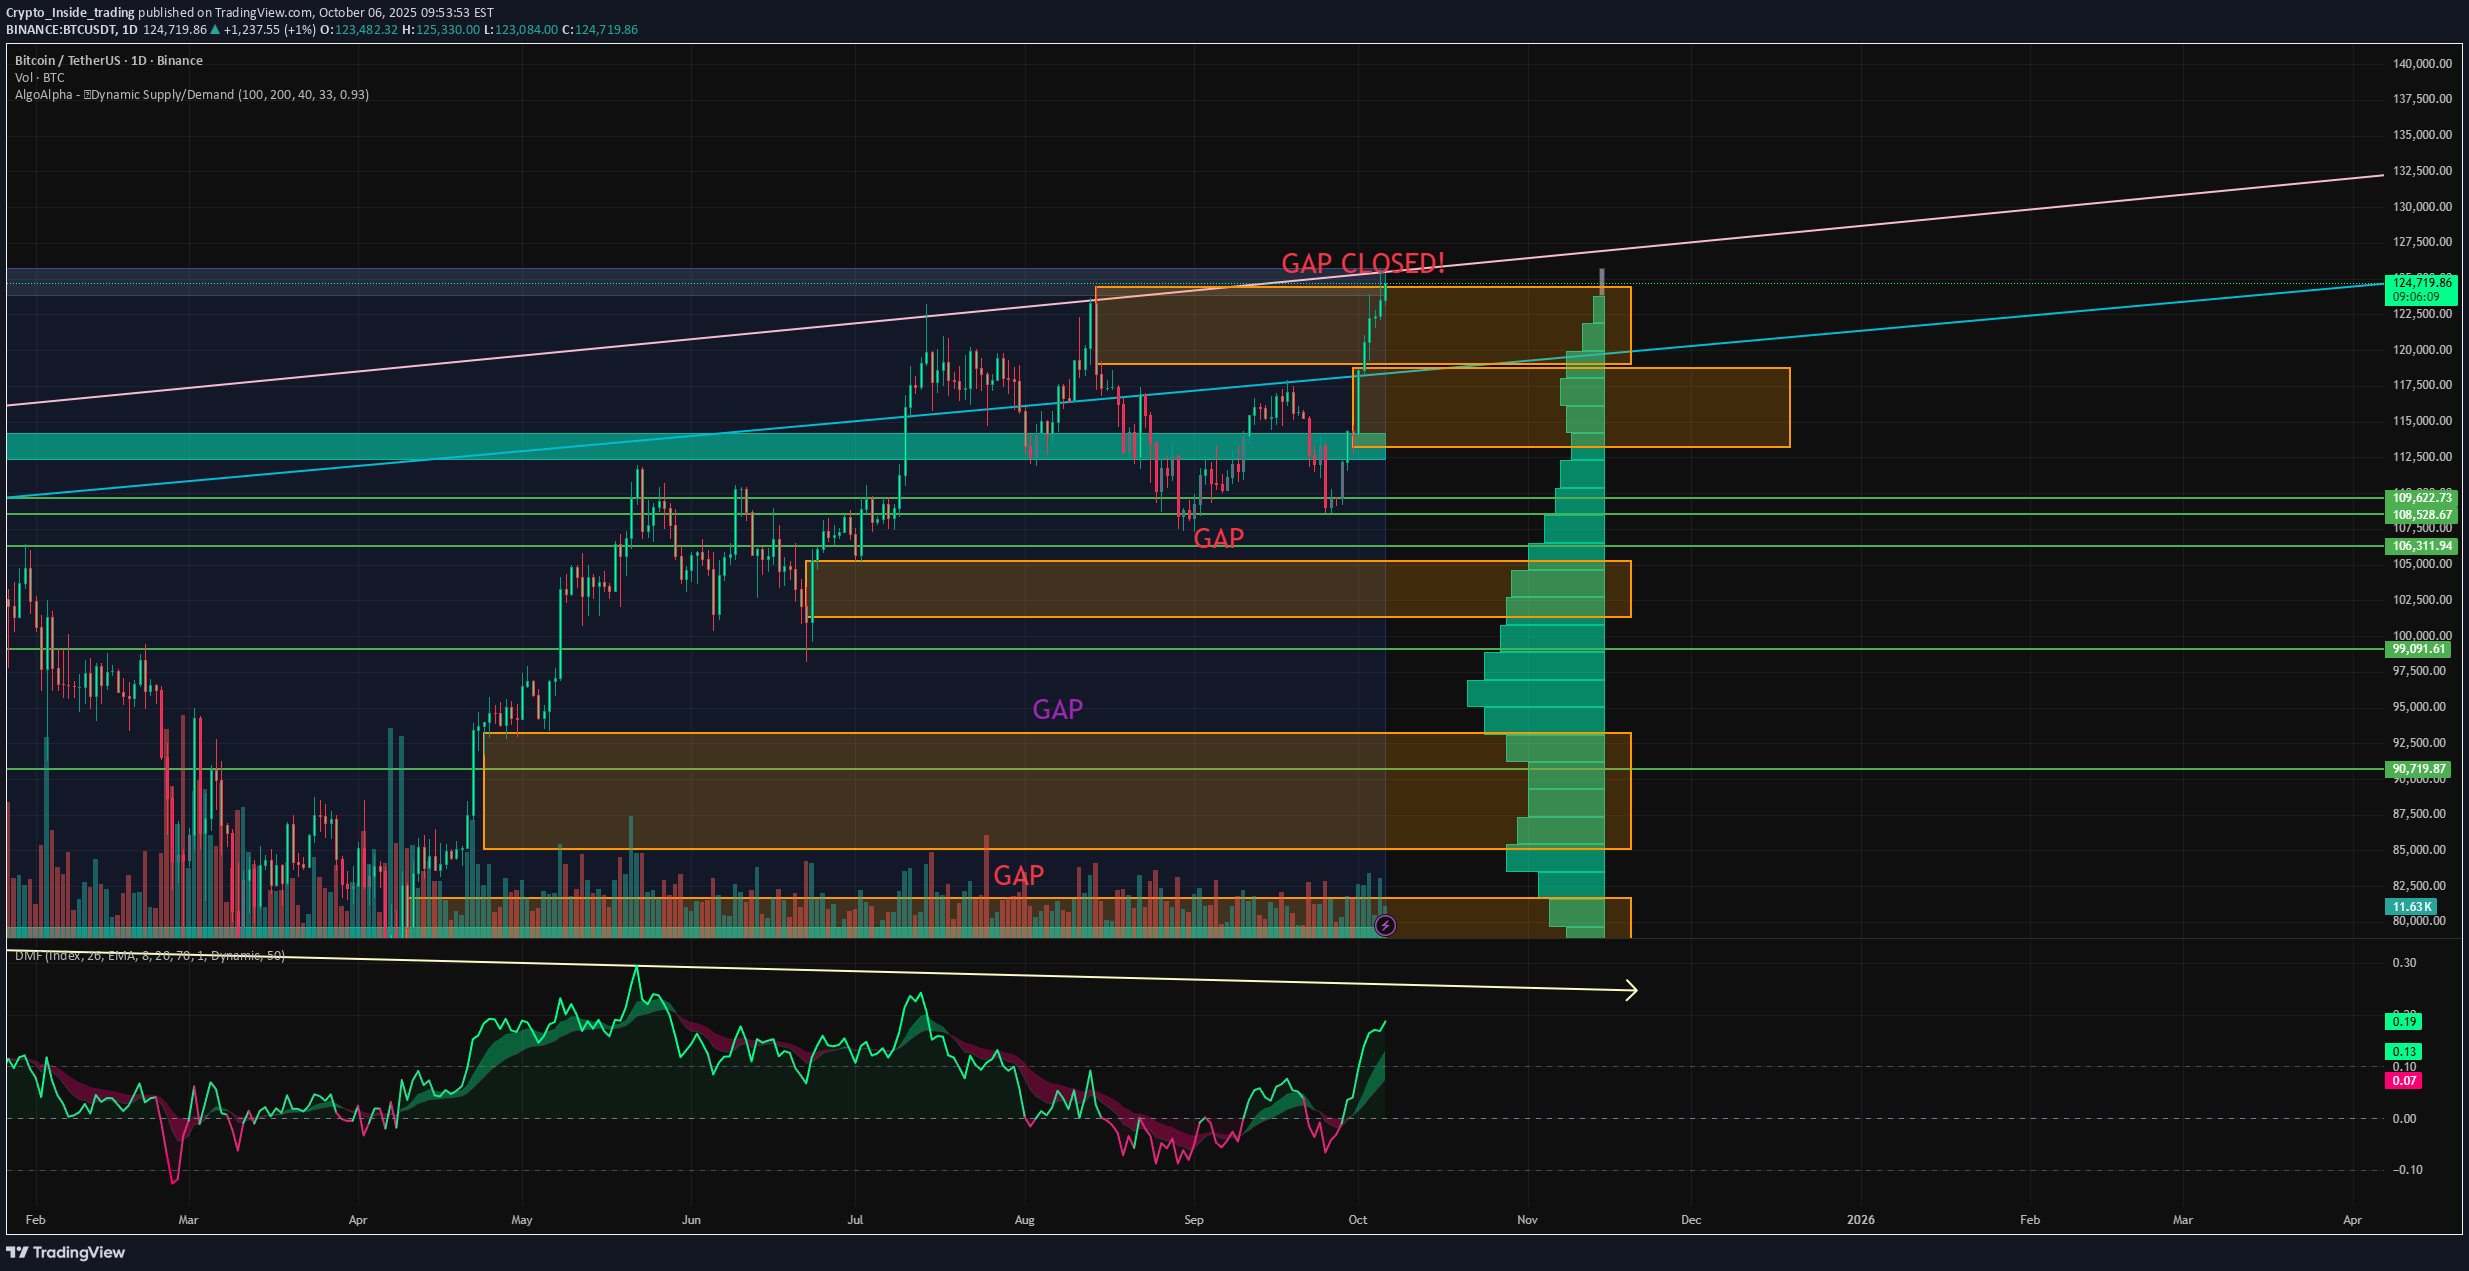
Bitcoin has reached a new ATH, and it’s time to take a look at the chart to see how strong this trend is and whether it can continue: ➡️ Money Flow shows a powerful liquidity spike, meaning the trend is supported by new money inflows. However, the indicator still shows a divergence that has persisted since November 2024. Every new ATH since then has been set with decreasing capital inflows into Bitcoin. This means it’s not that everyone is rushing to buy Bitcoin with billions — it’s that no one wants to sell, and we’re getting closer to a supply shock. Bitcoin reserves on exchanges keep hitting new lows each month. ➡️ The Dynamic Supply and Demand indicator only confirms this theory — there’s simply no supply zone left. No one wants to sell. The price right now is battling only short traders on futures. During the recent rise, the GAP I mentioned earlier — between $124,400 and $119,100 — was closed. So this rally was exactly what we expected! ⚡️ What’s next? If the price manages to hold above the $123,000 support, the growth will likely continue toward the next target at $130,000. If not, the first target becomes $120,000 — the nearest support and a minor psychological level. Also, during the rise, a GAP formed between $118,900 and $113,230. So if the price fails to hold at current levels, a retest of that area can also be expected.
Crypto_Inside_trading
ULTIMA back to the game
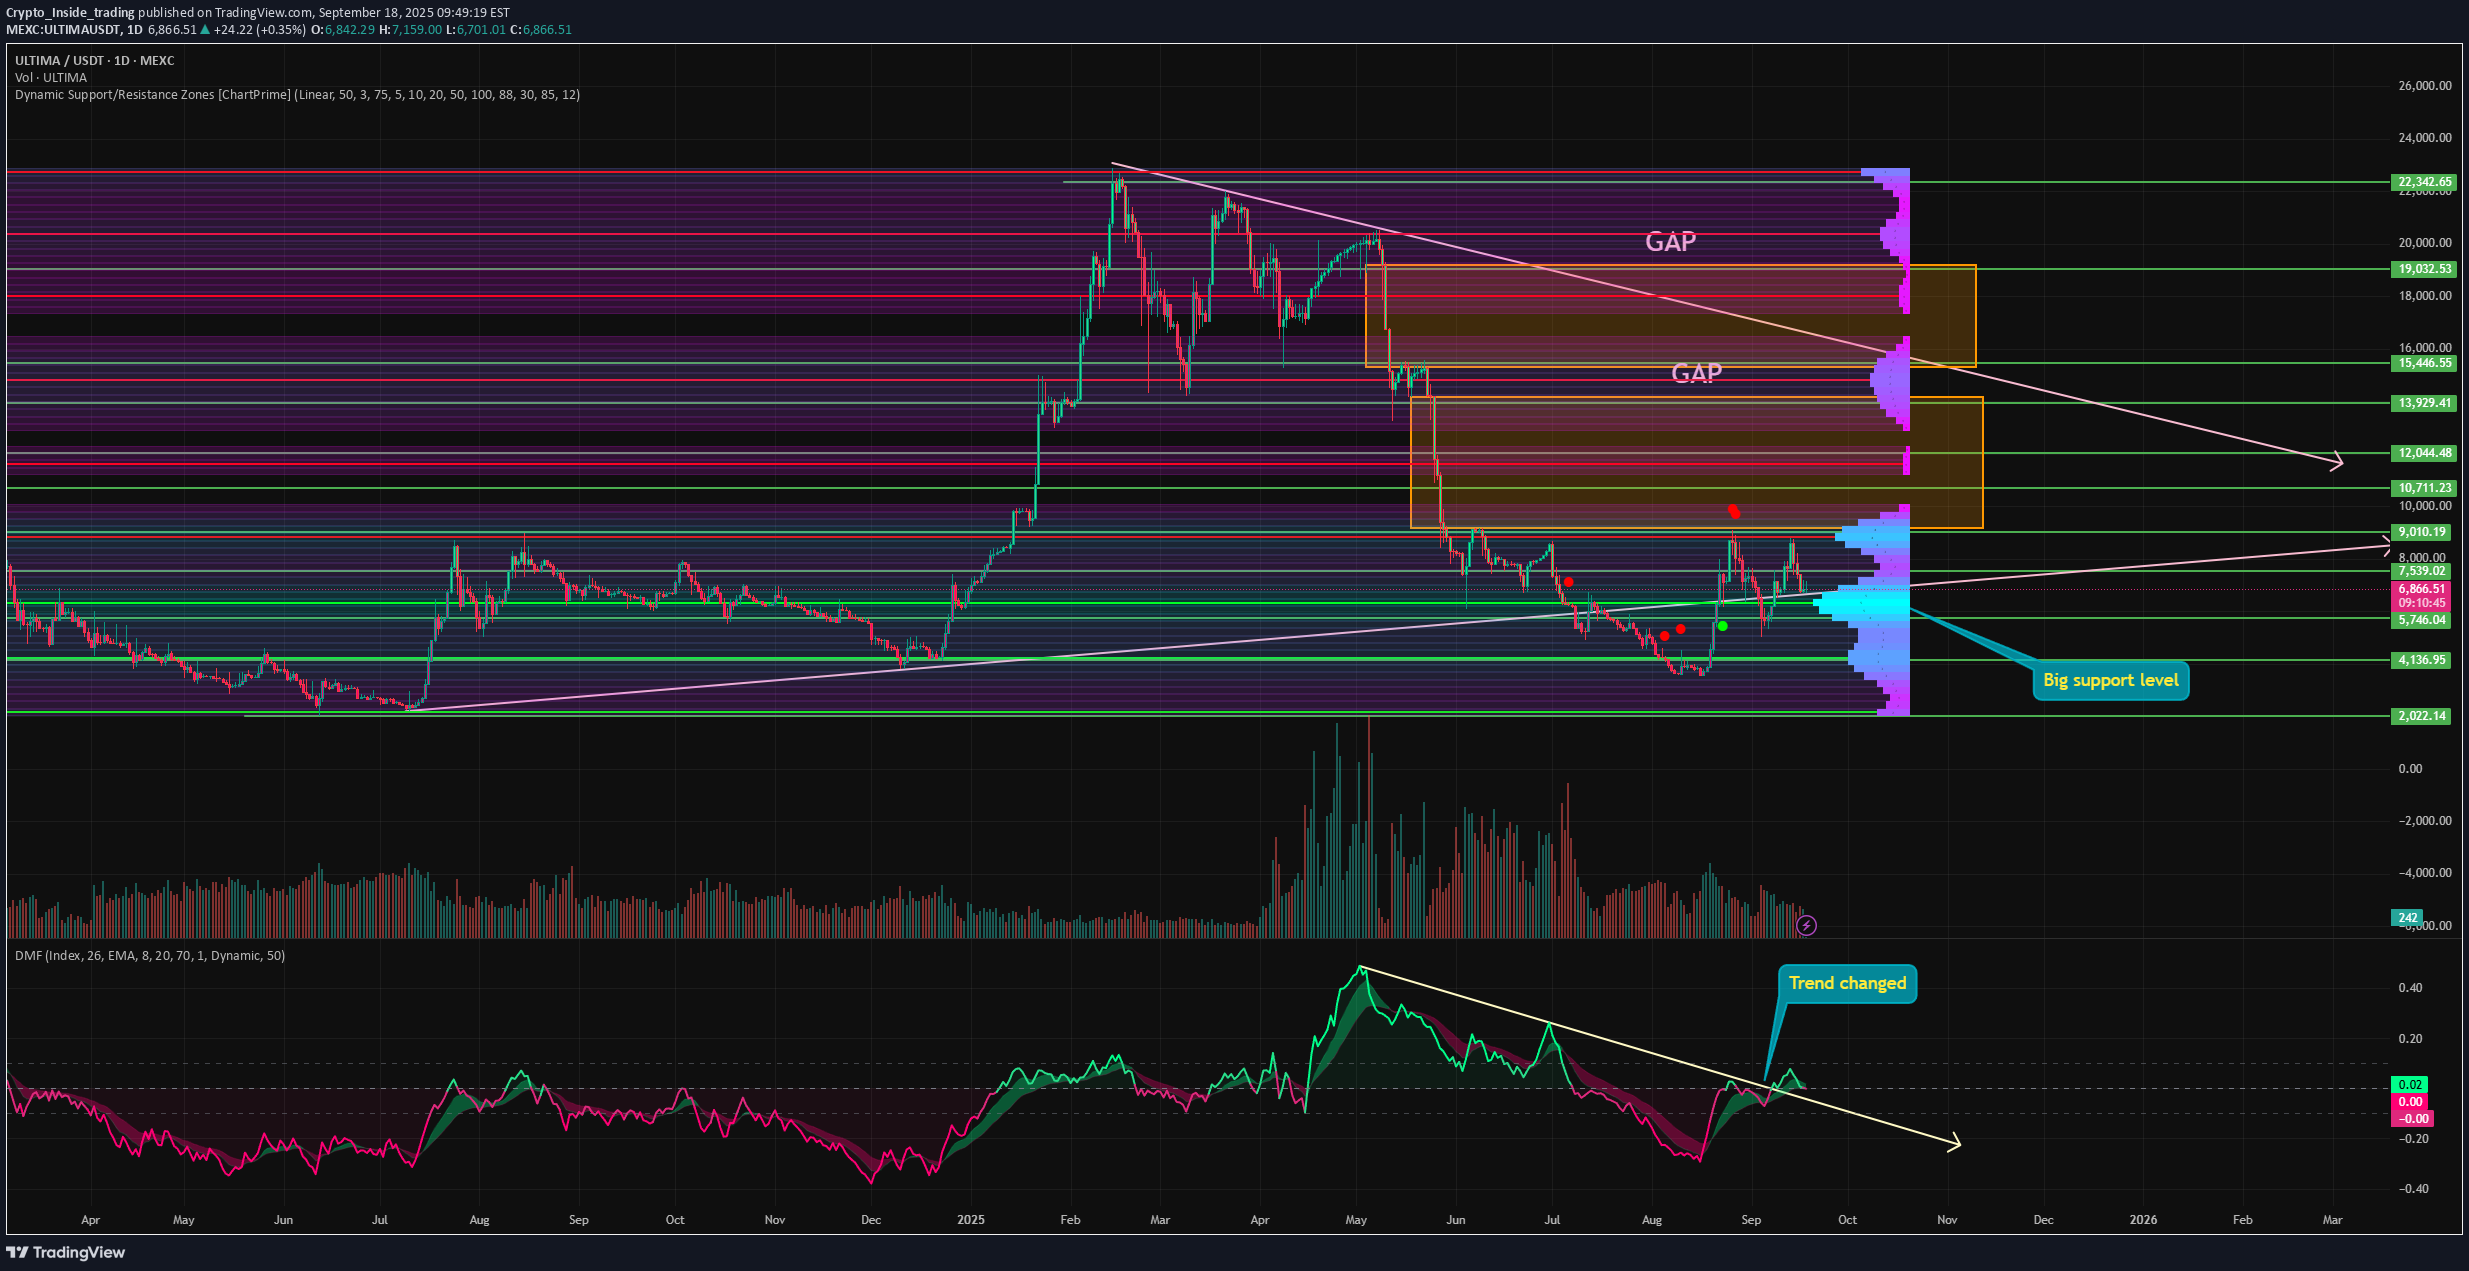
⚡️ Over the past month, ULTIMA has grown by more than 100% — and it looks like this might be just the beginning of a new long-term trend. Here’s why: ➡️ The price has returned to the flag pattern after a long squeeze. Having flushed out overleveraged traders, the token can now return to organic growth driven by spot buying. Considering the company’s hyper-deflationary model (which I haven’t seen anywhere else), the token’s value is likely to keep rising. ➡️ The liquidity outflow trend that had persisted since May has finally been broken, which means outflows are over and capital is flowing back into the asset. This could spark a fresh wave of money into ULTIMA in the near future. ➡️ The Support/Resistance indicator shows a large demand zone has formed around $6,303, just below the current price. This means any dip below could be quickly bought back up. ➡️ Selling volumes have been declining since March and are now at cycle lows. Historically, the end of sell-offs signals a trend reversal and a shift in control to buyers. And don’t forget about the two upside GAPs, which continue to pull the price toward them — and as you know, 99% of GAPs get filled sooner or later. 📌 Overall, nearly all factors now point to a trend reversal in ULTIMA. Combined with the recent U.S. rate cut and the Altseason Index hitting 100, this could make ULTIMA one of the main beneficiaries of the coming months.
Crypto_Inside_trading
ETH Losing Momentum — Correction Ahead
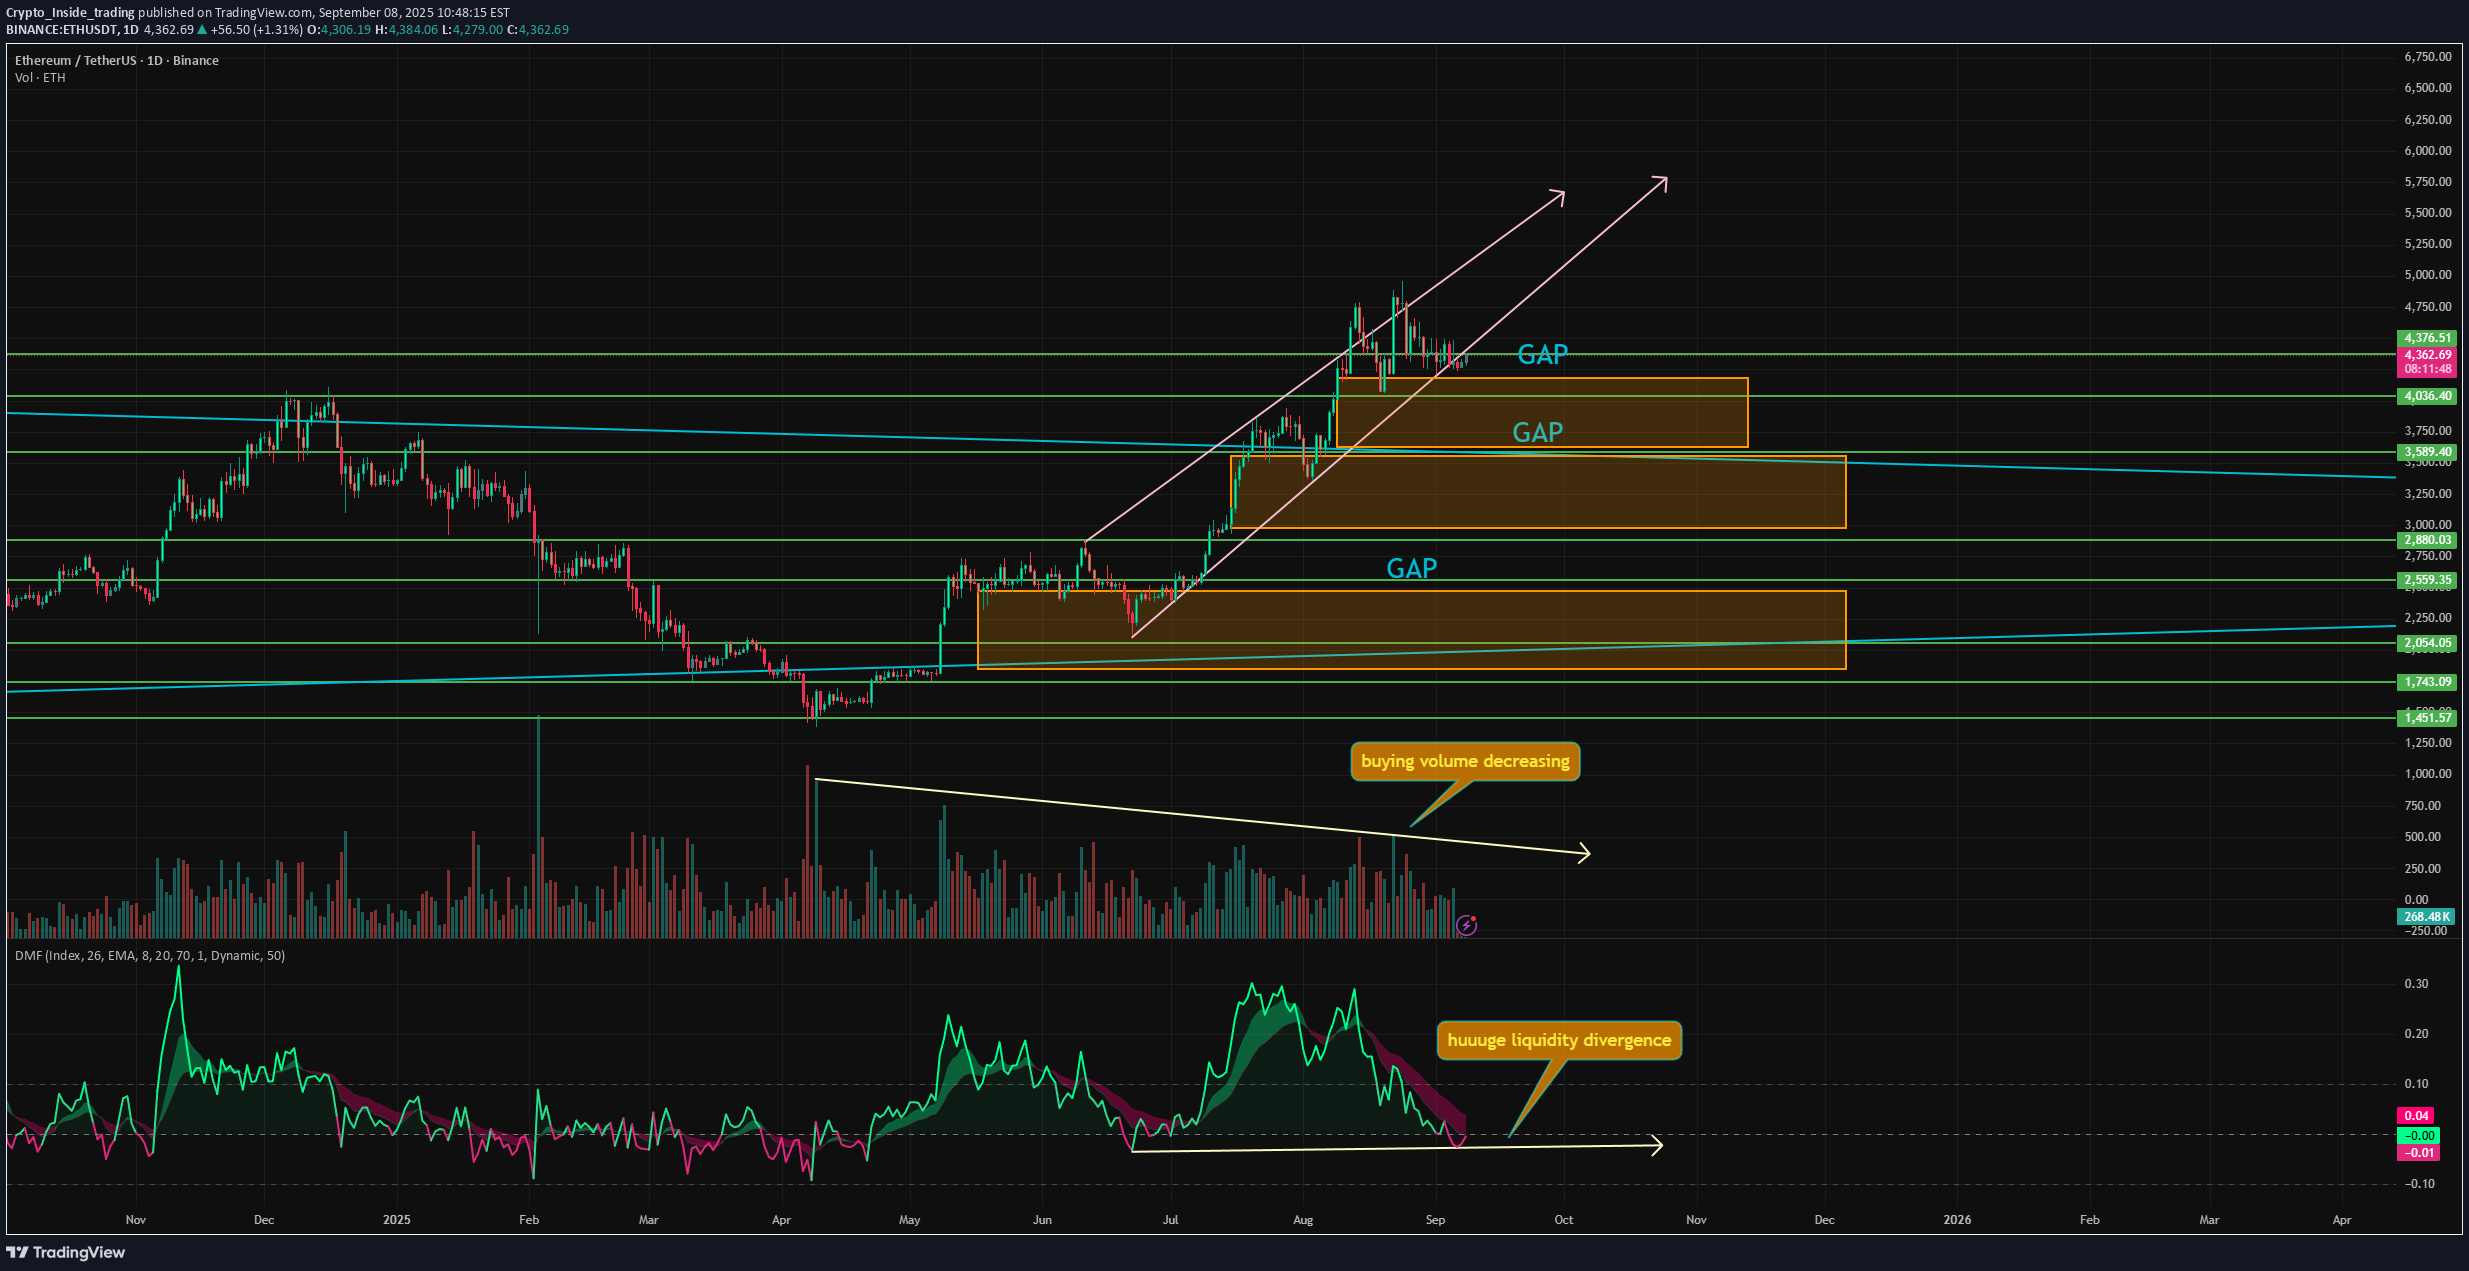
ETH has been one of the most overheated assets for a long time, but now it’s finally cooling off. Attention has shifted back to BTC and SOL. But what’s next for ETH? Let’s break it down. The price has broken below its ascending channel pattern, something I’ve warned about many times. This is the first sign of a trend shift — at minimum, into a range. Confirmation of a full trend reversal into a bearish phase will be a break of market structure (MS) at $4,060. And that looks likely soon, because: ➡️ Money Flow shows divergence — liquidity continues to flow out of ETH, already reaching levels last seen when ETH traded at $2,200 and below. ➡️ Buying Volume keeps declining, also diverging. Not at the new ATH, not anywhere, did we see growth in buying activity. That means the crowd simply has no interest in ETH. ➡️ Three gaps have formed below: $4,180–3,638, $3,565–2,975, and $2,467–1,856. And as we know — as SOL just reminded us — gaps close 99% of the time sooner or later. ETH has already started partially closing one of them. Even today, while the whole market is rising, ETH can’t move. And when price can’t go up, it obviously goes down. 📌 So the next target is $4,000 — a critical psychological level plus the MS level. A breakdown there will officially flip ETH into a bear market.
Crypto_Inside_trading
Bitcoin Finally Cooling Off
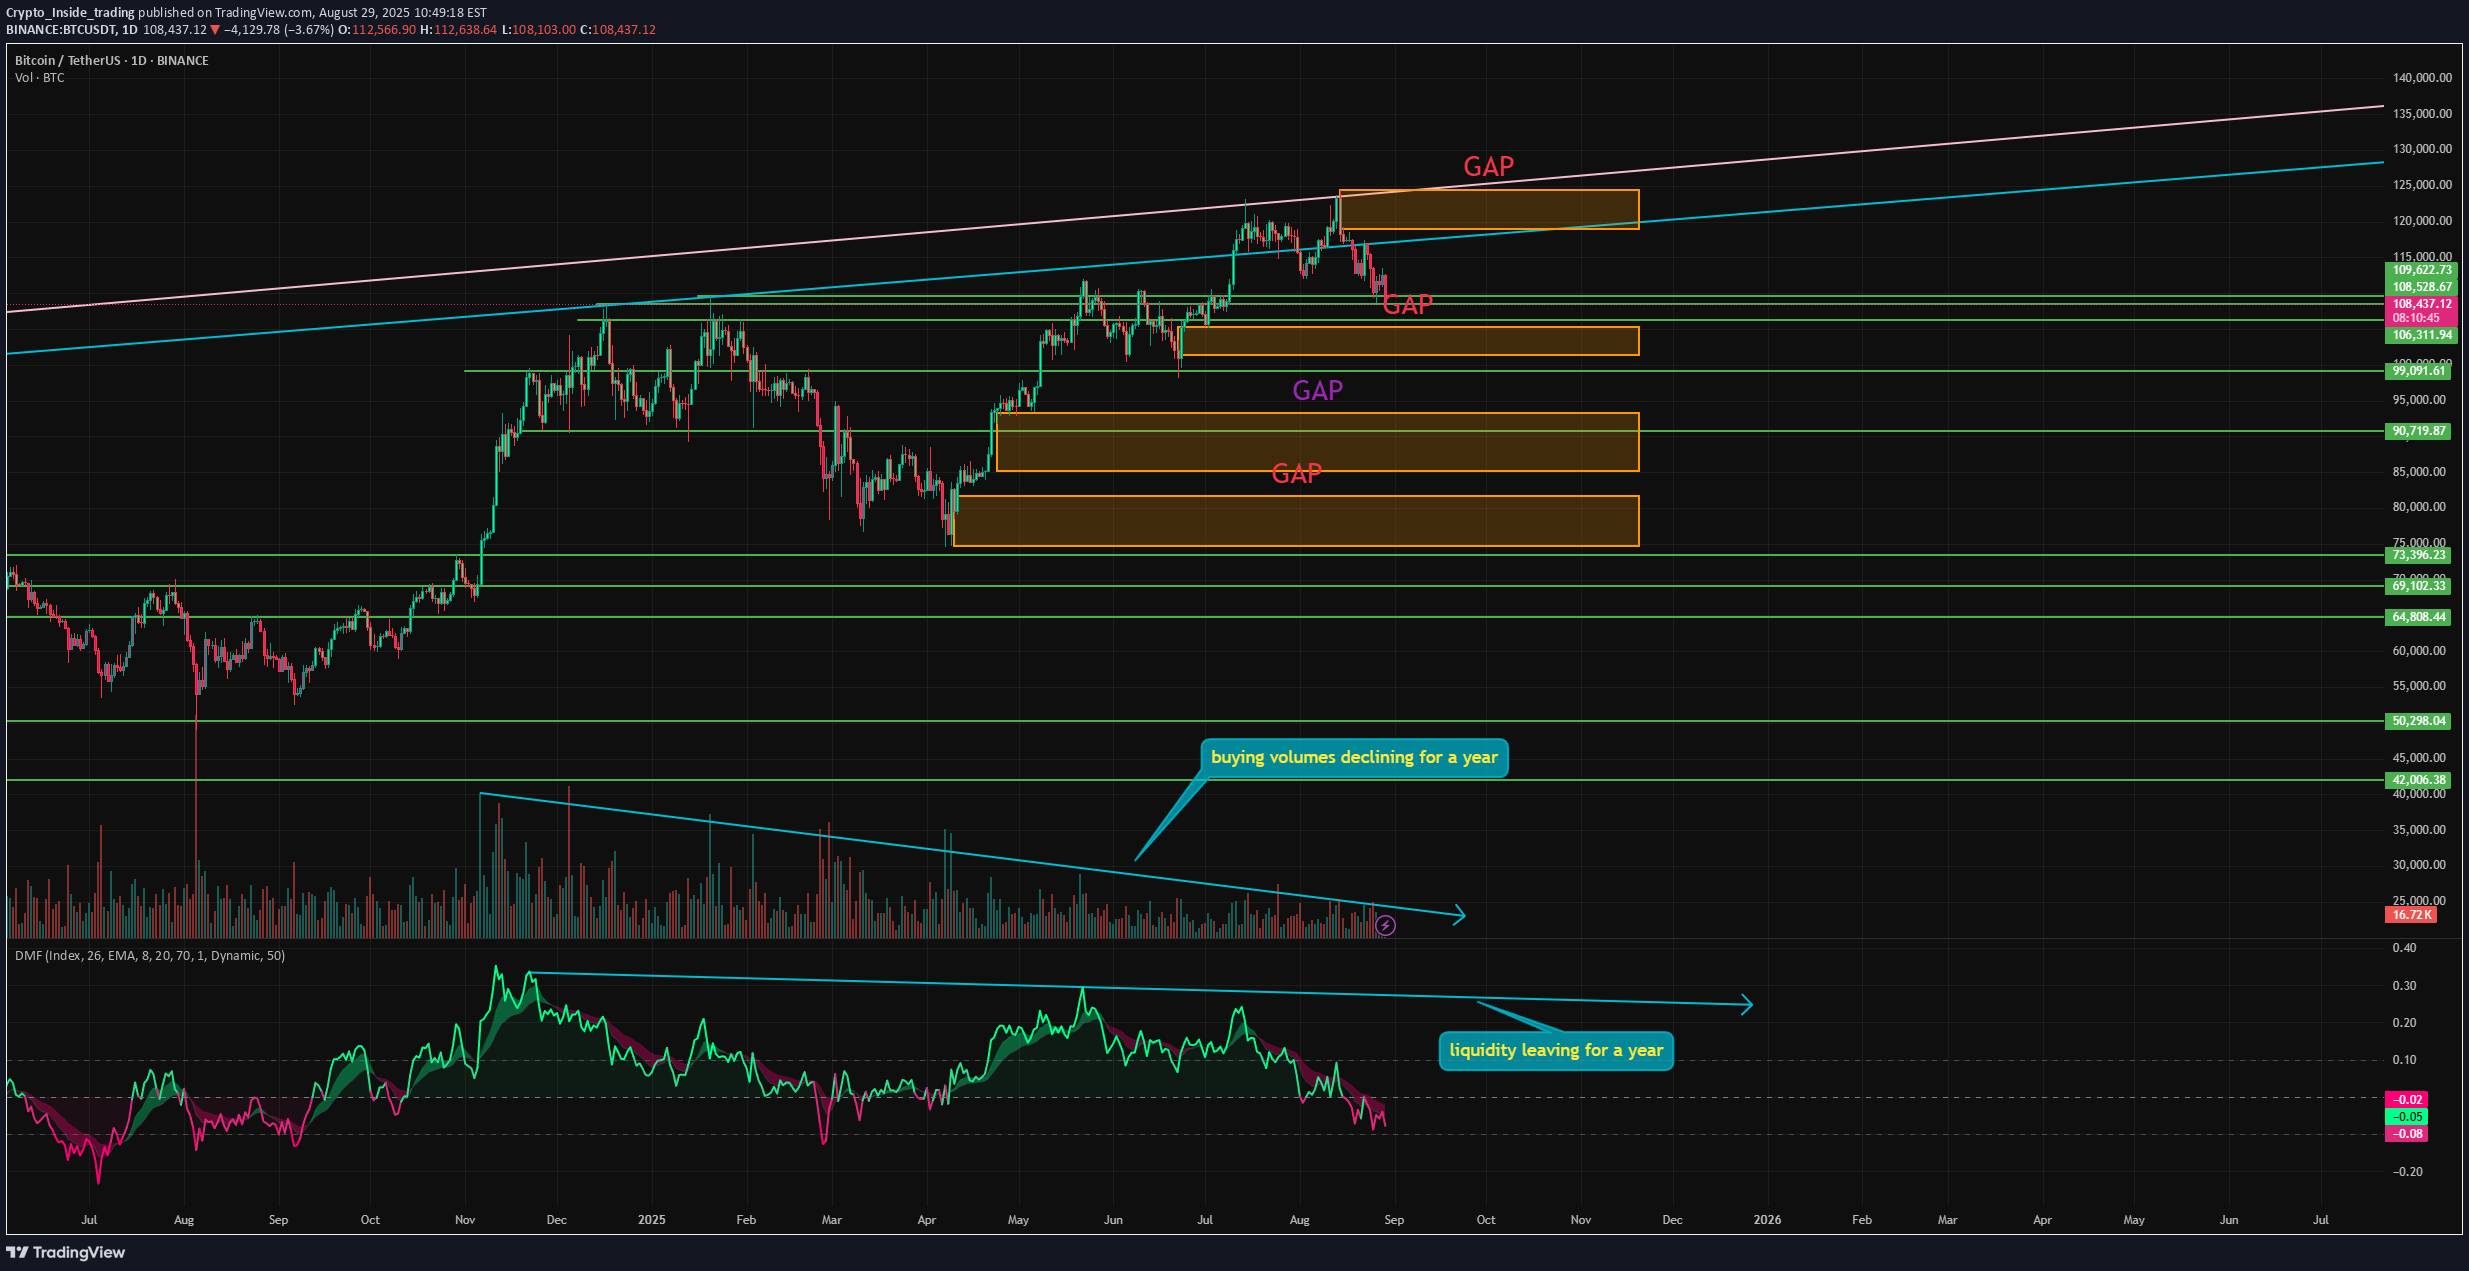
The correction I’ve been warning about for weeks is starting to unfold. Twitter is already filled with bearish sentiment. But in reality, it’s still too early to call this a full-blown correction — this is just the beginning. Here’s what to focus on right now: 1️⃣ Bitcoin was strongly rejected from its diagonal resistance in the 8-year ascending channel. This is a massive psychological level, and it won’t be broken easily — especially with current liquidity conditions. 2️⃣ Buying volumes have been declining the entire year. The rally of the past year wasn’t some miracle surge in demand for Bitcoin — it happened simply because no one was selling. 3️⃣ Liquidity has also been draining for a year. While it’s not disastrous (we’re still in roughly neutral territory), the outflow trend is clear. 4️⃣ Along the way, multiple gaps have formed below: $105,827 – $101,473 $93,282 – $85,090 $81,700 – $74,780 And most recently above at $124,495 – $118,897. As we know, gaps close 99% of the time. With so many stacked below, if correction deepens, price could cascade downward through them. 5️⃣ The first major support level is around $99,000–$100,000 — where the first gap would close. That’s where we can expect a bounce, but I doubt it’ll mark a full return to the uptrend. 📌 Conclusion: BTC, ETH, and SOL are all totally overheated. They’ve been climbing for half a year straight, and the market badly needs to cool off. Bitcoin looks ready to deliver exactly that.
Crypto_Inside_trading
A new trend leg in ULTIMA has already begun
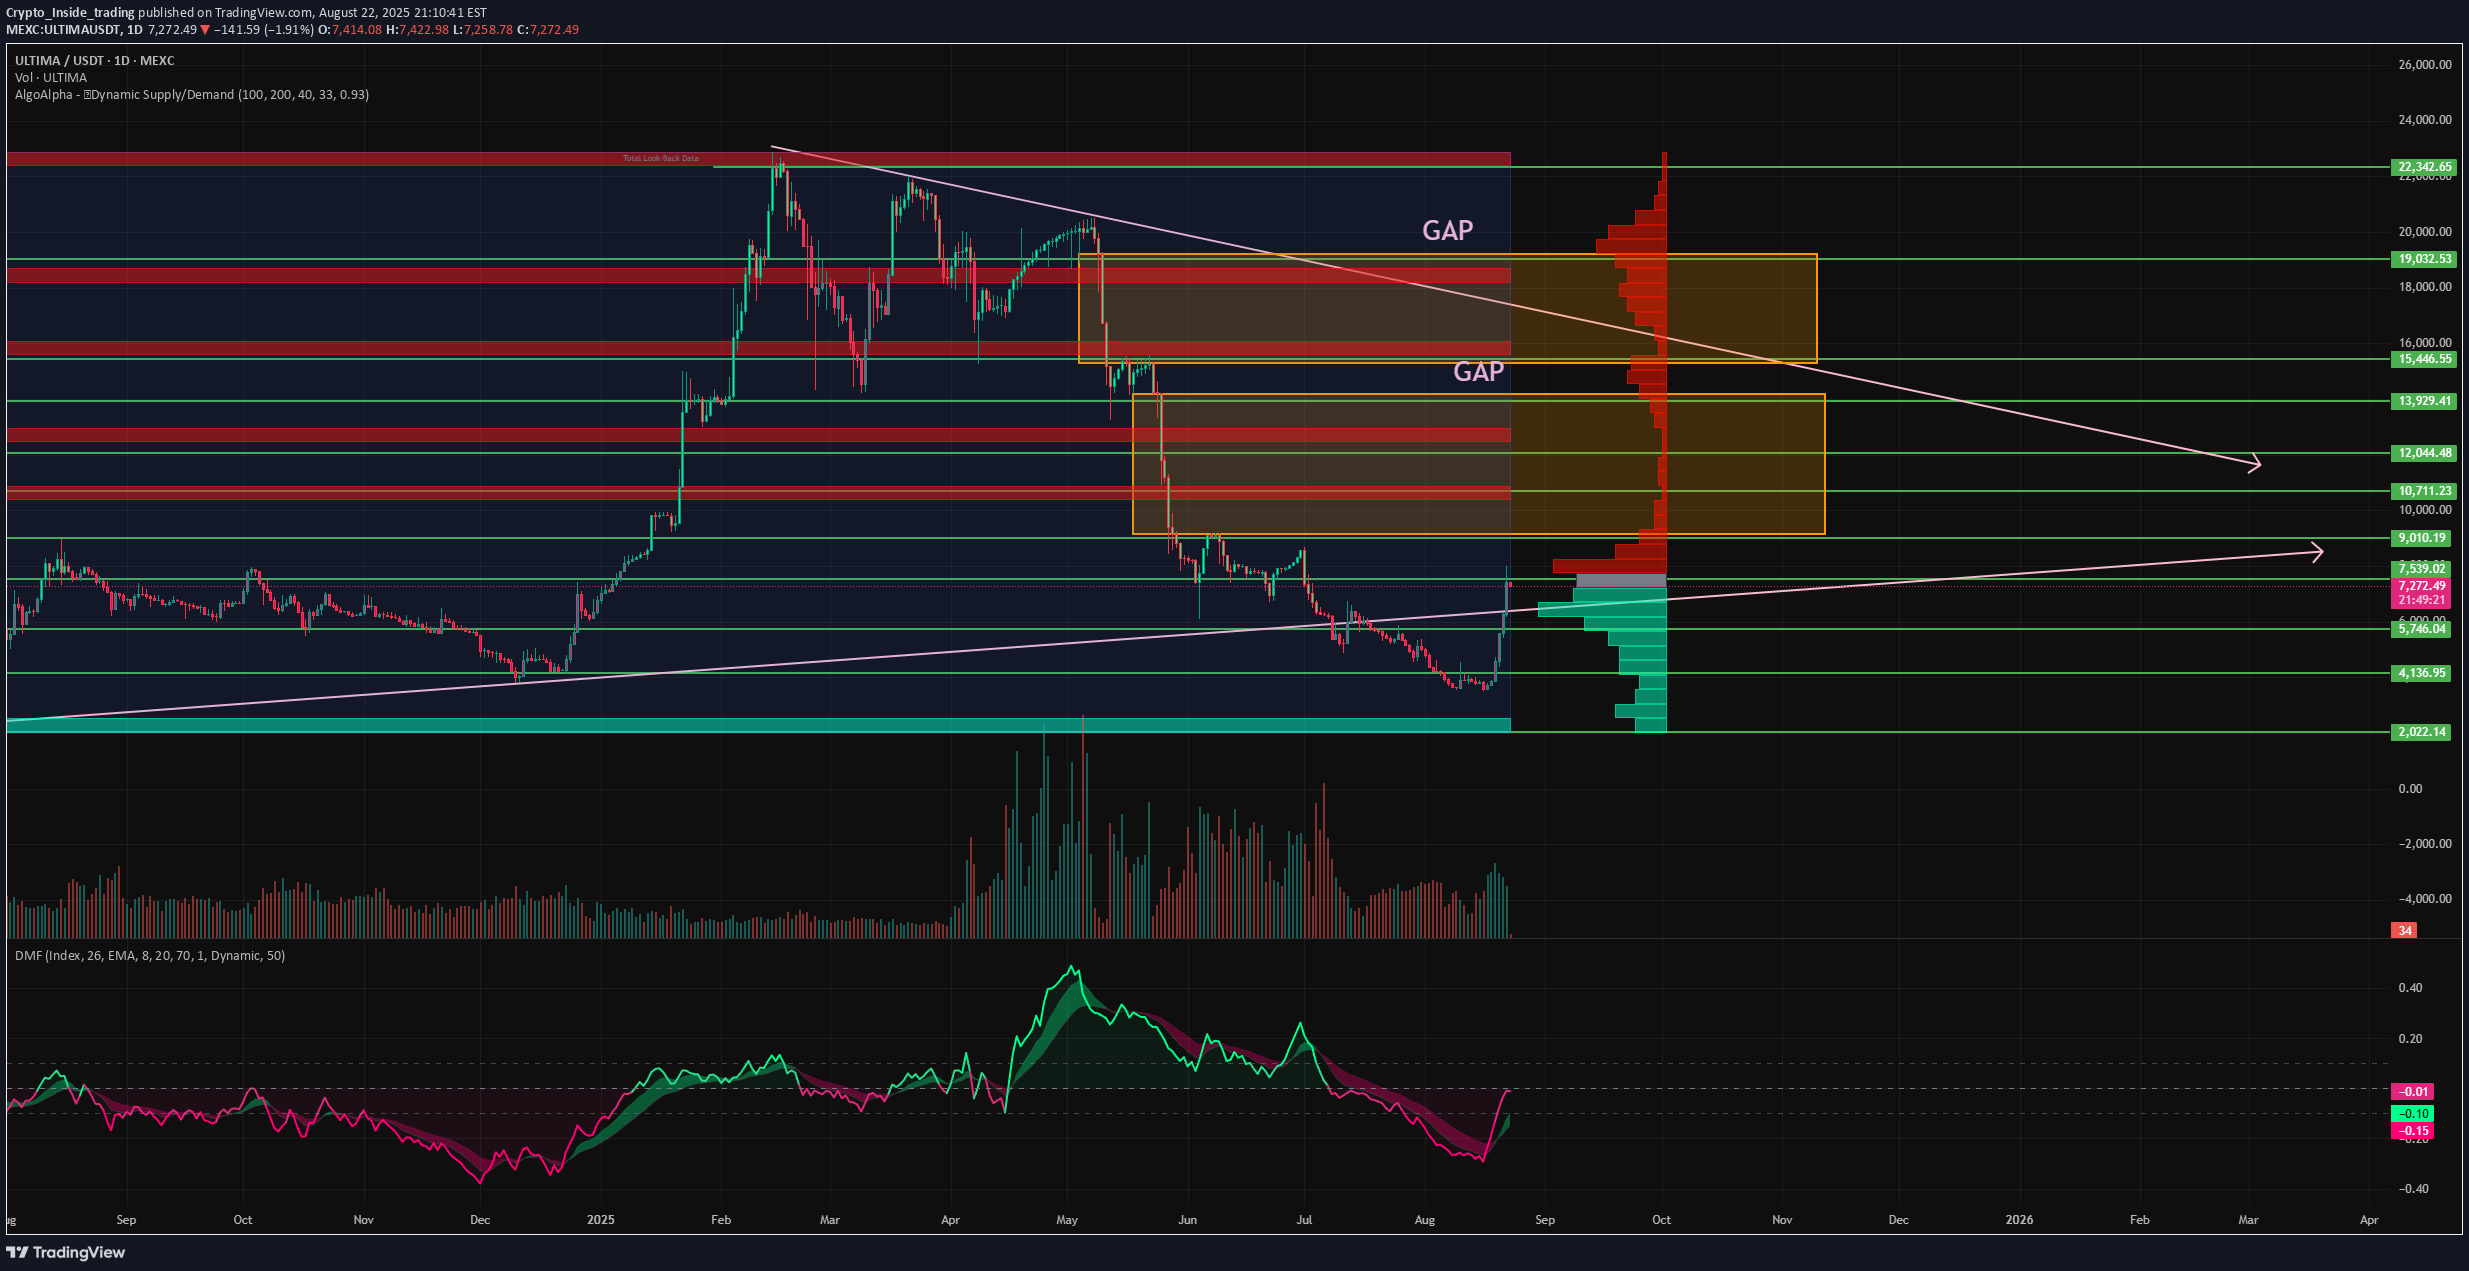
I’ve reviewed this token many times before, but many didn’t pay enough attention. Over the past week, however, it has been consistently ranking among the top daily gainers across the entire market. And this is happening while the broader market has been going through a correction. Now, a new trend leg has started in the token, and it has gained more than 100% in just one week. Here’s why this is a new trend and not just a rebound: 1️⃣ Throughout the correction, there was a clear divergence in selling volumes, signaling weakening selling pressure. Now, buyers are taking control. 2️⃣ Money Flow indicates a strong inflow of liquidity into the asset. Such a sharp spike often points to institutional accumulation, as big players historically prefer to crash the price and buy at the bottom. 3️⃣ Supply and Demand shows strong buying demand forming around the $7,200–$5,800 levels and lower, while supply is nearly absent. This makes sense: those who wanted to sell already sold, and the indicator confirms this. With this imbalance, the price is likely to continue climbing with little resistance. 4️⃣ During the steep drop, large GAPs were formed at $19,225–$15,336 and $14,173–$9,194. And as we know, in 99% of cases, gaps eventually get filled, constantly pulling the price towards them. 5️⃣ The price has returned within the flag pattern, which is a neutral pattern but, in a bull market, historically signals an accumulation phase before the next leg up. Combined with the above factors, this strengthens the case for a fresh trend. 📌 Conclusion: Everything now points to the start of a new trend leg. In a bull market, this could lead to a new ATH. The only thing to watch closely now is whether the price can hold above the lower boundary of the flag. That would be the confirmation of the new trend.
Crypto_Inside_trading
Is PEPE Completely Dead?
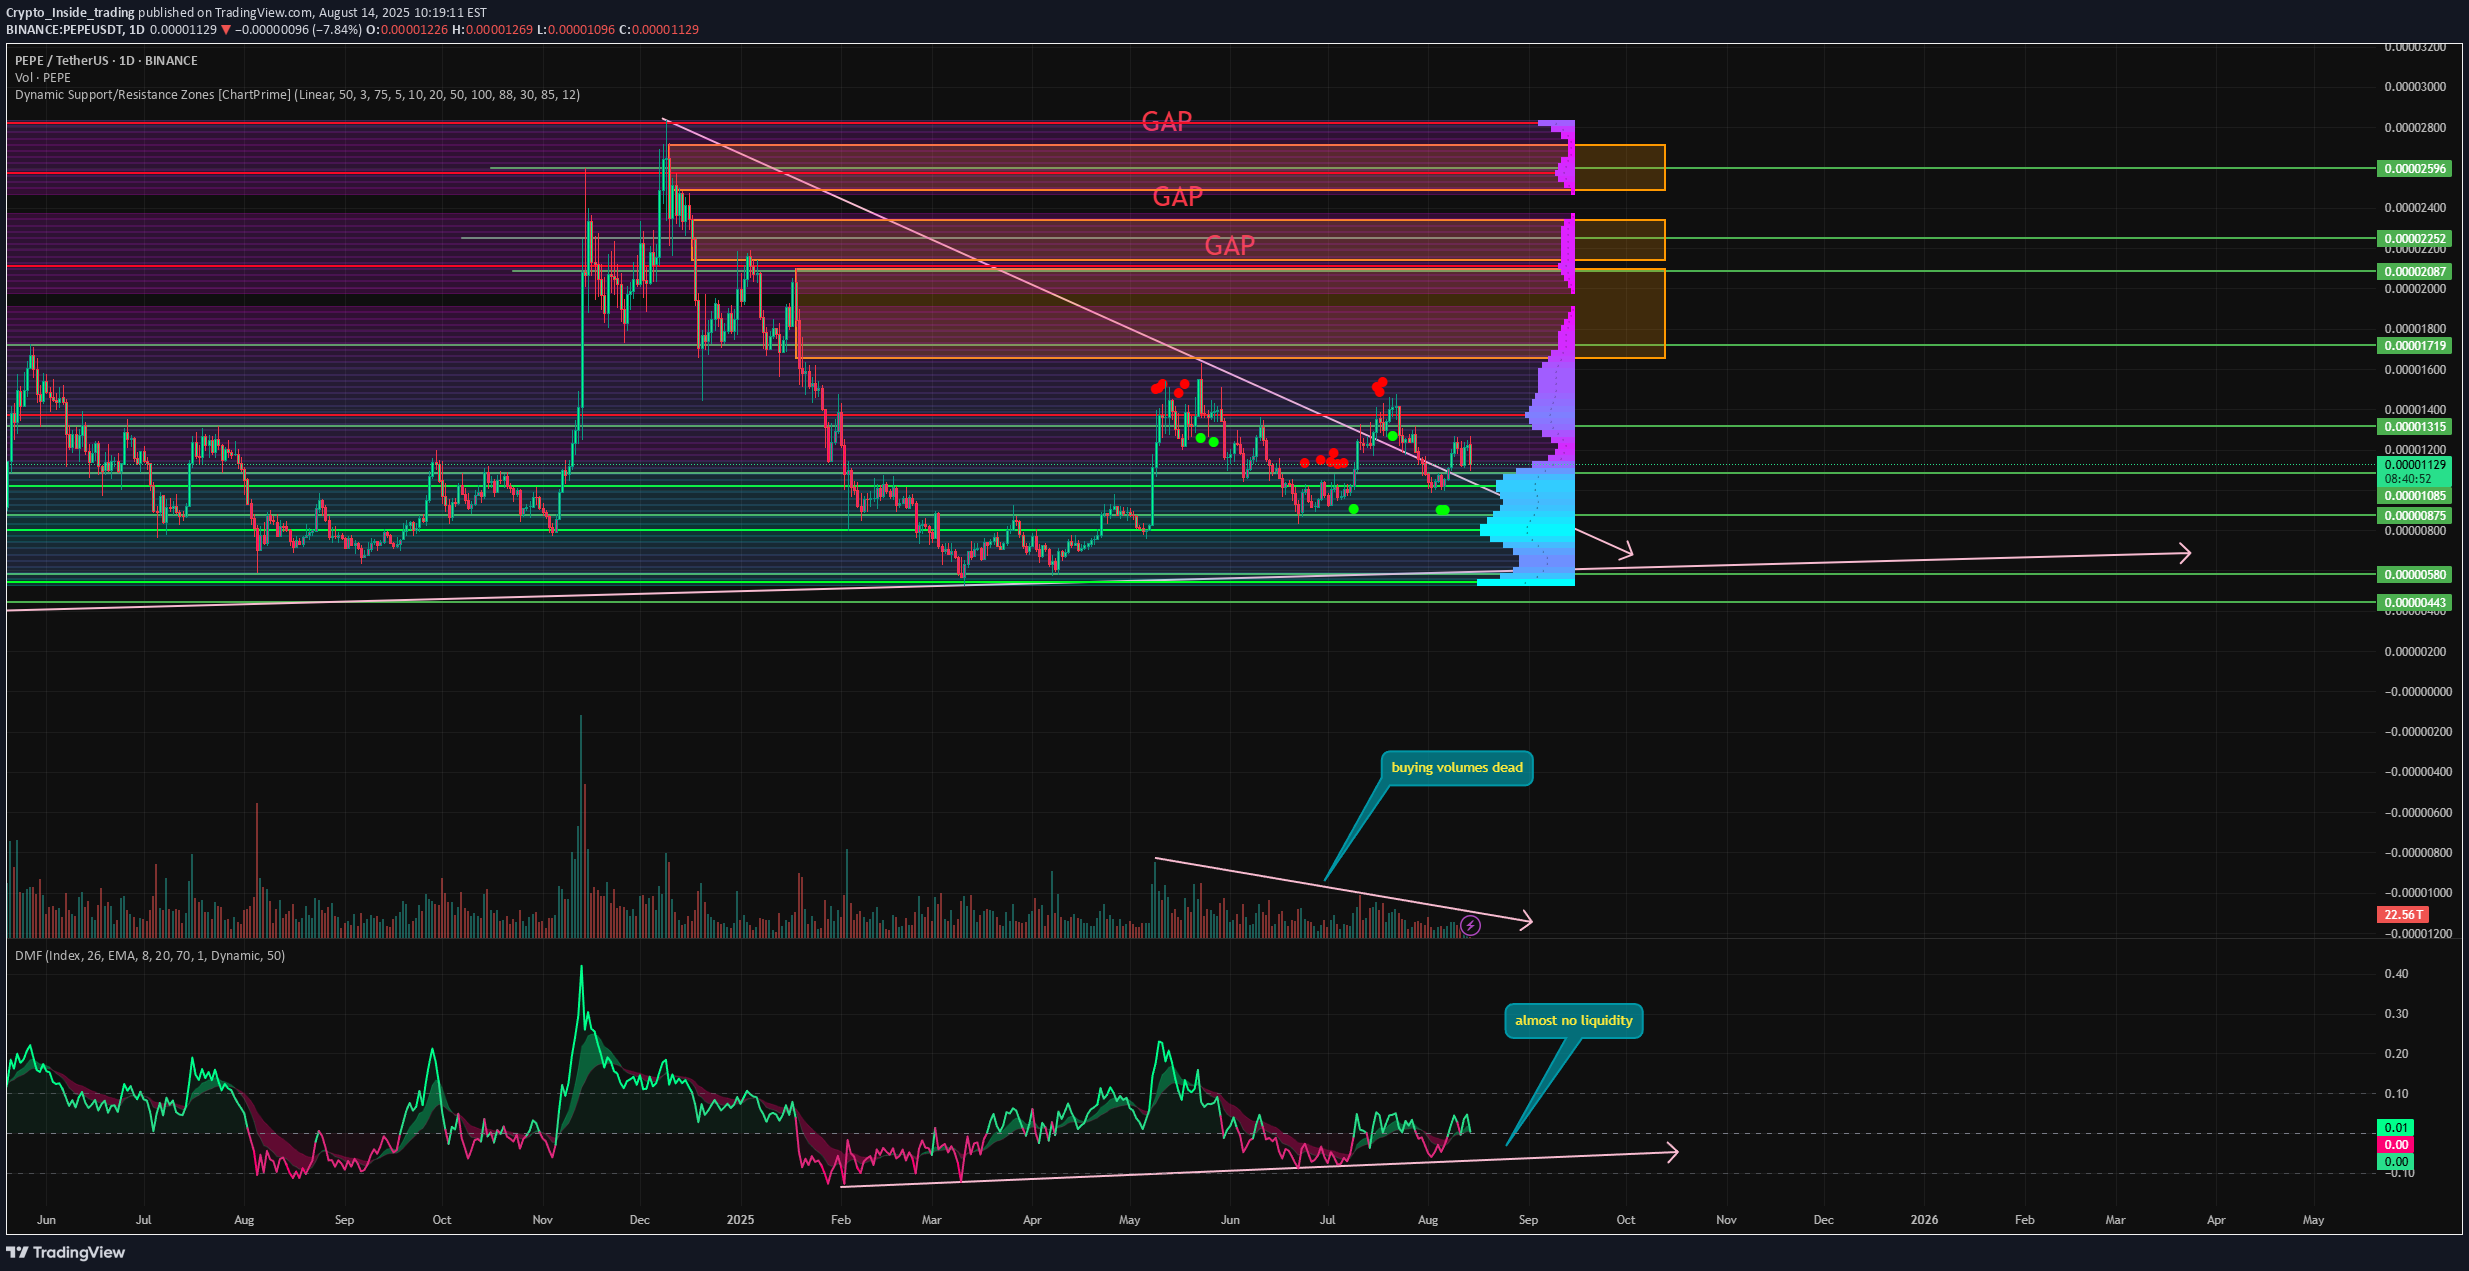
Old memecoins haven’t shown any real signs of life over the past six months. And while DOGE is at least making some effort, PEPE seems to have almost no chance for growth. Or does it? Let’s break it down: ➡️ The price is currently in a flag pattern and recently broke through resistance, now trying to hold above it. The funny thing is, during this market rally, other tokens had already broken out of their flags/channels long ago and are climbing higher, while PEPE is only now managing to do so. ➡️ And this impulse happened when ETH reached its ATH — with PEPE being considered ETH’s main memecoin. Yet PEPE printed a lower high and is now moving down. ➡️ Volume — there’s a divergence in buying volume, showing declining buyer interest. PEPE’s trading volume is basically at cycle lows while the rest of the market is setting new ATHs. ➡️ Money Flow — there’s a small liquidity inflow, but the indicator is sitting in a neutral zone. And that’s during a period of market-wide euphoria. ➡️ Support / Resistance zones — there’s a large support area right below current prices, so there are still people willing to buy PEPE. But given its sluggish price action, clearly not at these levels. 📌 Conclusion: Right now, PEPE looks totally dead. But as often happens, near the end of the cycle, old tokens that have spent months at the bottom tend to wake up — mostly because everyone had been busy trading the shiny new stuff. I still think PEPE has the potential to explode, but for that to happen, the price needs to drop significantly lower first.
Crypto_Inside_trading
SOL Silently Grinding Toward New Highs
⚡️ Time to update one of my SOL ideas and see how things are looking. The closer ETH gets to its ATH, the harder it becomes to push it higher — and attention starts shifting to its L2s and, of course, SOL. Over the past few days, SOL has been growing steadily. On top of that, the first-ever staking ETF in crypto history was launched for SOL — something that definitely won’t go unnoticed once the ETH madness cools down. ➡️ The first thing that stands out is the current price action. SOL has come right up to a large gap at $238–205.6. It’s already been rejected from this zone once and is now testing it for the second time. If it manages to break inside, price could move smoothly to around $216.72, since it’s a gap zone with no other resistances. ➡️ Next, Volume — we can see a divergence in buying volume, indicating a decline in buyer interest. True, ETH and BTC also moved higher on declining volumes until they approached levels near their peaks, where huge volumes kicked in. So, we could see the same pattern here. Plus, it’s no secret ETH is still at the center of attention, taking all the liquidity for itself. ➡️ Money Flow — here we see strong harmony with price, meaning liquidity is still flowing steadily into the asset, which is definitely encouraging. 📌 Conclusion: For now, SOL is still outside the spotlight, and its trading volume barely keeps it in the daily top 10. But it’s quietly grinding toward its highs — and once the ETH hype fades, everyone will suddenly remember: “Guys! We have the first-ever staking token! And it’s also a blockchain that’s been number one in profits for months!” By then, however, it might be too late. Because we’ve already been in the game for a while.
Disclaimer
Any content and materials included in Sahmeto's website and official communication channels are a compilation of personal opinions and analyses and are not binding. They do not constitute any recommendation for buying, selling, entering or exiting the stock market and cryptocurrency market. Also, all news and analyses included in the website and channels are merely republished information from official and unofficial domestic and foreign sources, and it is obvious that users of the said content are responsible for following up and ensuring the authenticity and accuracy of the materials. Therefore, while disclaiming responsibility, it is declared that the responsibility for any decision-making, action, and potential profit and loss in the capital market and cryptocurrency market lies with the trader.