
CryptoTaoist
@t_CryptoTaoist

What symbols does the trader recommend buying?
Purchase History
پیام های تریدر
Filter
CryptoTaoist
سقوط بزرگ بازار سهام آمریکا: پایان حباب پارابولیک نزدیک است!

The parabolic growth curve that started almost 30 years ago in the US stock market is about to come to a dramatic conclusion. We saw a test example of what happened in April when the market for the first time in 27 years broke through the parabolic growth curve, how quickly things just fell apart. Falling more than 10% in just a few days and then sharply rebounding to reclaim the parabolic growth curve. Well, get prepared for an even more disorderly crash about to hit the market. We are for the second time in a year, right now losing the parabolic ascent. No one actually believes the US economy is growing parabolically right? Even viruses don't achieve this level of "growth". It's all built on a phony baloney house of cards called the US Dollar backed by nothing but the "full faith and credit" of the US. Well guess what? The credit of the US is constantly being downgraded by bond rating agencies. And we elected a leader who destroyed every other countries' faith in us. Consider poor Canada and the faith they have in us now. You might laugh and think these kinds of things are silly, but I promise you it's deadly serious. We have NOTHING but hot air backing the US dollar now because we have no faith and our credit is in the dumpster. Also for comparison sake, I included the angle of growth (copy and pasted the small yellow line) that we had in the "raging" 1990s bull market. If you were alive during that time, the market was truly considered raging. But compare the angle of ascent to the last 6 months since Taco trump announced his worldwide agenda to destroy the US. The angle of ascent is almost pornographic compared to the 90s rager. Parabolas don't unwind. They crash. What other confluence do we have in the indicators to prior year crashes? 1) VIX 8day RSI achieved its lowest ever stochastic %D this summer, numbers 2 and 3 were 2007 and 2000. 2) P/E ratios are the highest they have ever been at 40+, only exceeded by one other time +44, just before the dot com crash. 3) 2y 10 y bond yield differential maintaining above .42% like every prior recessionary crash.
CryptoTaoist
CryptoTaoist
سقوط بیت کوین: چرا منتظر ۸۰ هزار دلار در پایان سال باشیم؟
Bitcoin decisively broke below a 4 month old channel support line on high volume. Head and Shoulders present as well. Will see prices in the high 80k by end of year.
CryptoTaoist
Gold and the 100 year head and shoulders. 3x by 2033!
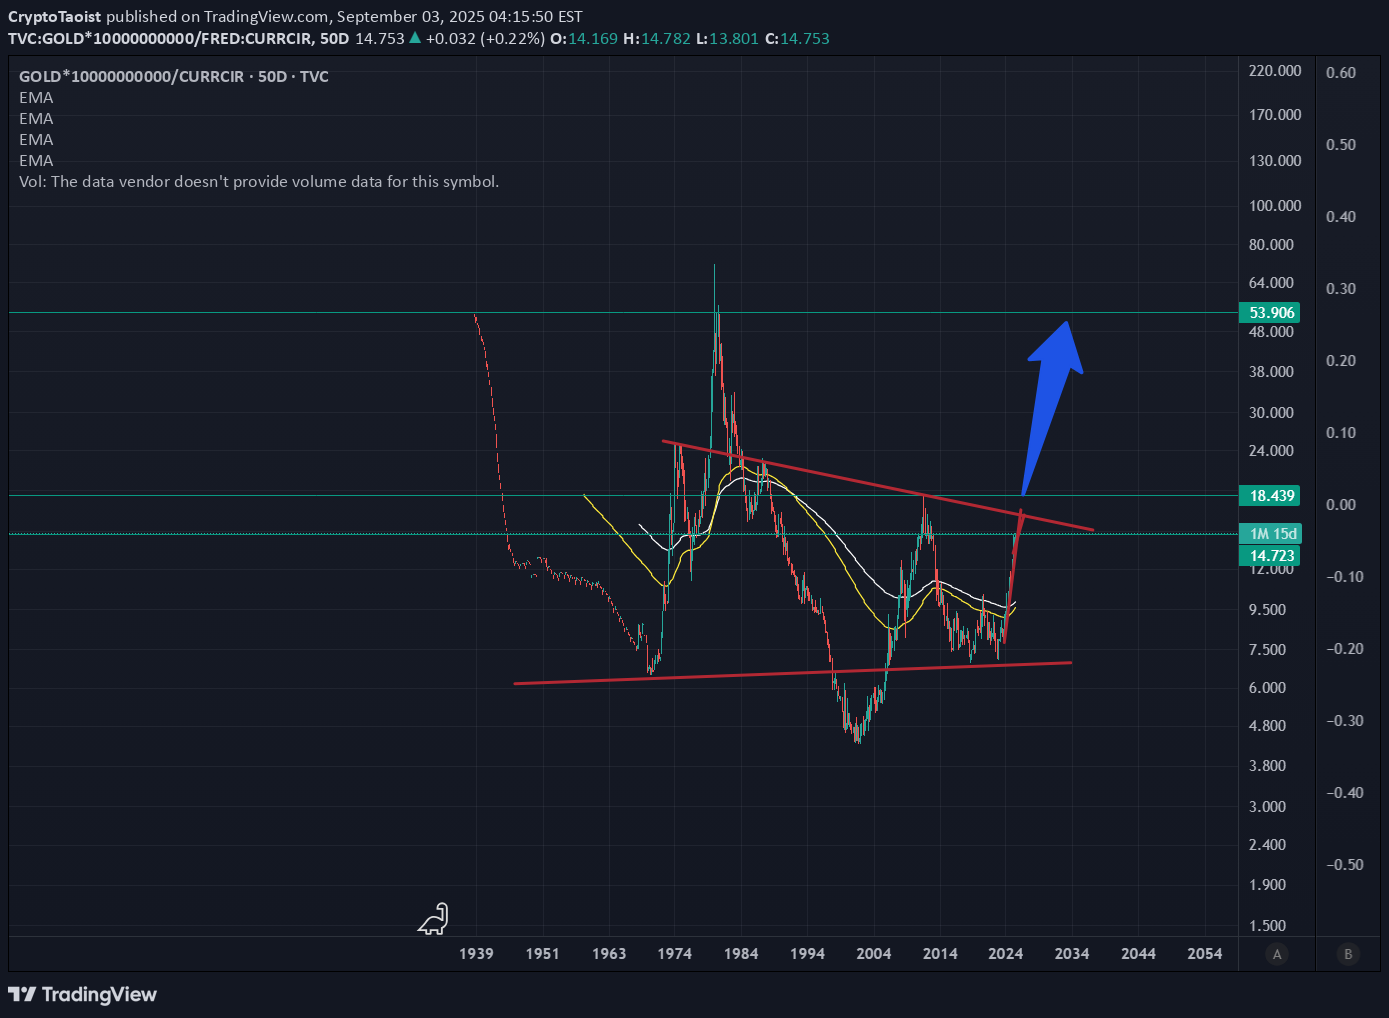
Gold is about to challenge the neckline of a 100-year head and shoulders pattern against total currency in circulation. That neckline is approximately 12% higher than we are now. My assumption is that we test it before the end of the year. If we clear it and hold it after the year ends, we will be in very good bullish position for 2026.I meant inverse head and shoulders!
CryptoTaoist
Entire S and P history in one chart. Approaching a neck-snapper!
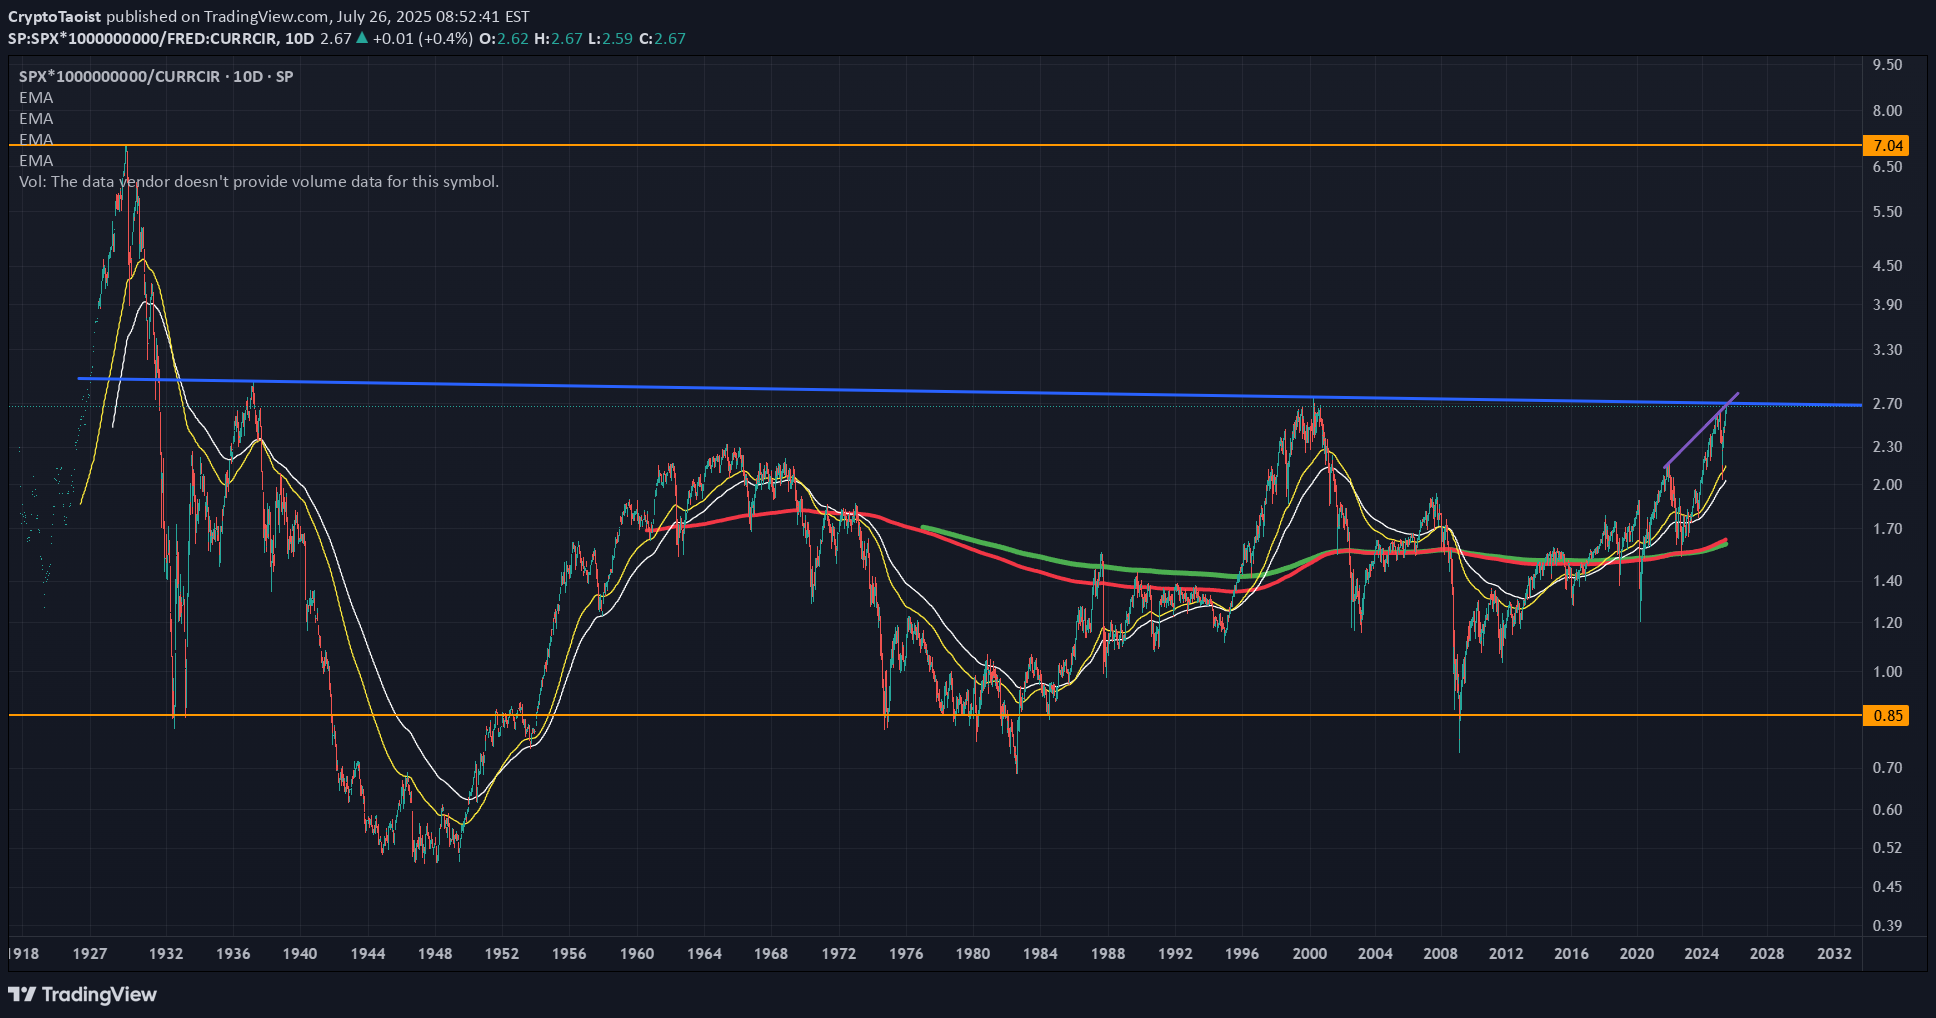
Here is a chart of the entire S and P history versus total currency in circulation. This gives bubble periods (anytime the value is over 2) and times when the market crashed after being in a bubble. If you notice we are fast approaching the line that broke the neck of the market in the 60s and 2000 dotcom bust. If we clear that line, hold on to your hats because we are going into full blown speculative mania like just before the Great Depression! In fact maybe the AI-crypto bubble will be exactly like the Great Depression, AI causing mass unemployment and global poverty.I meant the 2 times that line snapped the neck of the bull was in 1936 and 2000 (not the 60s crash which was only a minor bubble).
CryptoTaoist
Big Picture look at why 52.5k is such a huge resistance level!

Here we see a big picture look of what Bitcoin is currently up against. You'd think with making a 20% gain in the last 10 days, we'd be able to blast right through this "puny" ~52.5k level. Why is Bitty struggling now? Well the answer goes back to 2020 and 2021. You see the 52.5K area is a massive resistance level in it's own right. It was exactly the level that formed the left and right shoulders of the head and shoulder top of 2021 that plunged Bitcoin ~75% down from 69k to sub-16k. Add to the fact that there is a second resistance line perfectly lining up with the 52.5k resistance which is the huge old channel which has rejected Bitcoin crossing on numerous occasions. This is a channel resistance that goes back to 2013 in fact. So to answer the question what can cause a raging bull to stop in it's tracks all of a sudden? 2 big old heavy resistance lines perfectly converging together right now. Now here's the upside. If, Bitcoin manages to breakthrough these two lines, you will almost never have to worry about lower priced bitcoin ever again. These two lines would become massive support. For that to happen though, you must understand the proper anatomy of a major line break, which I will demonstrate in pictures below. Don't get suckered in long right now UNLESS, you see the following happen.... I am personally on the sidelines other than having sold some longer dated calls some 5k higher. If bitcoin breaks through, I'll take the loss. But I imagine we will do something similar to March of 23: Test the heck out of these lines for months (that's right Bitcoin tested this line for 2 full months back in March of '23). And then ultimately turn and head lower before the halving. Good luck and happy trading!Before I get to the anatomy of proper line break, I want to show the convergence of these two lines on smaller time frame so you can see them clearly... Notice the larger sell volumes beginning to show up here.Let's now look at the anatomy of a proper line break in detail... First let's take a look on a bigger time frame the line I am talking about. We could say this line break is what set off the bullrun of 2020....Ok so now you see that line that spanned the course of almost 2 full years (it goes back even further but I won't show that now), At first it was support, then broke below during the COVID flash crash, then bitcoin tried to break it 2 times and was finally successful in October of 2021. Now let's zoom in when Bitcoin breaks through that line in October of 2021...Now do you see the anatomy of that line break more clearly? See what happens... First there is a massive spike in volume on 3 strong bullish bars with little to no upper or lower wick and rising volume each bar and bigger percentage moves each bar... Then it has a massive test of it, which initially breaks back below it... Then we inch back up above and have one more high volume bearish test, which Bitty succeeds in closing above the bar. This all occurs over the course of 5 days... And that my friends is the anatomy of a proper big line break. Now let's compare to what's going on today...Notice the highest volume spikes in this area are sells, not buys. It could of course happen before the end of the week, but I suspect not.The best way to think of a rising resistance line is as a growth speed line. If you look at the entire coinbase history of bitcoin and you see the upper white line (not the current line, you see that it established it's original support at the price of $109 on Jan 5, 2015. It had it's final underside test and rejection of this line on March 26, 2022 at a price of $48240. If you do the math what the market is saying is that Bitcoin's value against the USD was no longer going to grow at a pace of 240% per year (that is the annualized growth rate between the above two dates I gave and the above two prices). The market determined, through price action, that this was not a sustainable growth rate. So now it establishes the lower line that we are currently up against. This line established it's first support at the COVID low of $4935 on March 17 2020. Now on Feb 17 2024 we are at $52000 testing the under side of this line and Bitcoin is trying to break above that price. So the market is currently asking the question: should Bitcoin be growing faster than 150% per year against the USD. 150% per annum is a massive growth rate (not to mention 240%). I suspect Bitcoin could have bursts of growth rates that amounted to 150% per annum on select years, but as an average I simply don't believe it. That may be naive. Given the trillions and trillions of outstanding USD and the very limited supply of Bitcoin. However supply is only one side of the coin. Demand is the other. While investors are chasing returns and moving to Bitcoin as a potential safe haven against long term dollar destruction, Bitcoin is still not traditionally an asset as such. It doesn't produce wealth for it's holders as such. It has potential as a store of value, less so as a unit of account, but to me it's highest function is as a global liquidity barometer. I am guessing Bitcoin's ultra long term average growth rate (let's say at 200+ years) against the USD will match its halving rate which is approximately 20% per year. That will take many years to establish, but in any case that long term line would be much much lower than where we currently are. Perhaps the market can sustain an average valuation increase of 150% per year, but I don't believe that narrative and I believe you should have sane reasons to doubt it as well. Of course, I am open to being wrong. But I suspect the USD is a lot stronger than the naysayers want to give it credit for. It is still the worldwide reserve currency without any question. Until that changes, I wouldn't expect any long term average of Bitcoin to be 150% growth per year. Let's see!Also one other thing I wanted to add. 99% of bitcoiners only give a f*ck about the dollar value of bitcoin. They could care less about bitcoin, they care about dollars. And yet, they never stop to ask themselves---if what I really care about is having more dollars and what more dollars can buy me, doesn't that make the dollar more valuable than bitcoin? Food for thought....
CryptoTaoist
Clearing 52200 will be a massive feat! Stay alert!

With a massive 20% gain in the last 10 days, Bitcoin is cruising ever higher. But the real test is now upon us. Bitcoin is right now touching a huge old channel resistance line. This resistance line goes all the way back to 2013 (shown here back at the bottom of the 2020 market) and bitcoin has failed on a number of instances to clear it since it broke below it near the bottom of the last bear market. It rejected this line several times in the past and it suffered a rejection already early in the trading day today. But the 5 and 15 day bars are all closing today so the next 5 days are really critical. If it continues to reject this line, expect a retrace of earlier levels. 40 and 45k and 48k remain good support zones. It remains a huge momentum hurdle. Stay on alert! It doesn't mean it can't rise against this line since this line is a rising line itself, but if it clears it, look out because it means we are headed way, wayyyyy higher. It will essentially establish this line moving forward as a bottom and longs immediately above the line break on a good time frame (3 day minimum), will have very little to be concerned with.Here's a close up on much lower timeframe...I'm becoming more convinced that bitty will retrace here. Combination of heavy old resistance plus being badly overbought plus bigger time frame RSIs look very messy to me. It could take something like 30 days to properly break away from the line. I don't expect fireworks, I expect bitty to do what bitty does best, grind grind grind until momentum surely builds against it and then drop "suddenly".
CryptoTaoist
Bitcoin recaptures major bullish trend line! Close all shorts!

Disclaimer: previously I was short, but as new market information presents itself, it must be followed. Bitcoin just made a major bullish move which is the recapture of it's original October bullish trendline which had broken in the Grayscale sell off. This is majorly bullish. Additionally, we spent several days testing and confirming the major Fibonacci level at 42641. Taken together this strongly opens the pathway to 54211 which is the next major level higher. If it gets there by March 6, that would also represent a confluence with a major channel resistance. So 54211 is the new target. Good luck and happy trading.Comment: Also please note, options are extremely cheap right now. You could do either one of the following strategies: 1) Take a leveraged long and buy March 1 44000 puts for $1000 per contract (can be purchased in 0.1 contract size also on Deribit). Your risk is limited then to $1500 (difference between current price and strike price) plus $1000 (option cost). If you leveraged 2 to 1. This represents a total risk of $5000 (10%) of your portfolio. With a target of 54200 the upside would be $20,000 ($10000 x 2 contracts) - $2000 for the 2 puts = $18.000. That represents a gain of 40%! That puts risk/reward at better than 1:4. 2) Buy March 1 48000 calls for $1000. If it makes it to 53000 by March 1, you have a gain of $5000 for each contract minus the cost of the $1000 option for each contract. This also represents a 1:4 risk reward but at a much lower total risk. Total risk is the cost of the option.Stay vigilant. If we fail to hold this trend line or break back below it before the end of the week, that's really bad news!
CryptoTaoist
Bitcoin's LONGEST term history analysis and what comes next!

I want to call particular attention to those calling for 100K bitcoin this year and why, if history is any judge we will not touch that figure for 3-4 more years at least. Follow me on a longterm history of bitcoin price movements, courtesy of Bitstamp, the oldest running record of bitcoin price history going back all the way to 2012. In the picture above, I want to call your attention to something very specific. Note the 2 green circles I have drawn. These are where you can see very slight dips in that yellow moving average. That yellow line is the 100-period simple moving average. The “period” I am using in this case is 10 days. So in that case, this yellow line represents 1000 days of the average Bitcoin price movement (10 day period X 100 periods moving average). Let’s call that 3 years for simplicity sake. (FYI the Blue moving average is 25 periods i.e. 250 days, and the white line is 50 periods i.e. 500 days based on a 10-day period). It means in both these instances, first in 2016 and again in 2020, Bitcoin’s average price movement for the preceding 3 years was ever so slightly negative. You can see this in the way the line bends downwards ever so slightly within the green circles I have drawn. Now next make note of the blue dots that you can see underneath the circles. These are an indicator I developed and without getting into too much depth about it, I can say that what they represent is something like support (and the yellow dots above mean resistance). I am not debating here whether they actually represent support and resistance, I just want to call your attention to the existence of them and how many of them exist within the purple shaded boxes I have drawn which span over the course of most of 2016 and most of 2020. In 2016 you see 2 of them and in 2020 you see 5 of them (one which is the “black swan” COVID market crash of 2020). Still in both of these instances, you have two of these dots and in both cases which are sitting right by that yellow 1000 day line. Also notice the presence of the blue and white lines and how close they are to this yellow line both years and how in the case of 2020, the lines get almost tangled up together over the course of the year. If that’s clear please see the next picture of 2024…Above is a picture of 2024... As you can see the picture of 2024 is markedly different than 2016 and 2020. The yellow line has a deep curvature to it far deeper and more pronounced than 2016 and 2020, the blue line is just now beginning to cross over the yellow line and the white line still remains several thousand dollars below the yellow line. Also notice the complete absence of lower blue dots so far this year. Now of course you can blindly say 2024 will be nothing like 2016 and 2020 (not even the years have anything in common!") and "because huge Wall Street funds are now involved!" and everybody knows huge Wall Street funds exist 100% to make the small guy tons and tons of money. Sure Wall Street is your best friend and they always have been. Know anyone that lost their house or their job in 2008 market crash? I do. Me, I am personally waiting for lower prices, some line tangling which I am sure will occur at some point this year and some blue dots to show up. You are free to buy now of course because we are going to 100K next month and 1 million dollars in 2 months. Me I am Bearish for almost the entirety of 2024. Good luck and happy trading.I wanted to clarify one line I wrote that was miswritten: "It means in both these instances, first in 2016 and again in 2020, Bitcoin’s average price movement for the preceding 3 years was ever so slightly negative. You can see this in the way the line bends downwards ever so slightly within the green circles I have drawn." What I meant to say is that at the moment of the slight dip, the average price for the preceding 1000 days at the moment was falling not negative. Duh. Also, as it really only spanned about 4-5 bars in both cases and the dips were relatively flat, it means that at the moment of the dip and until the dip recovered it's upward slope the average price over the preceding 3 years was falling. I hope that's clearer now.
CryptoTaoist
Timing the next US stock market crash. An RSI bedtime story...

We have ever shortening boom bust cycles... Using RSI as a gauge every so often we see deep dips in RSI. (I use 144 RSI not 14 and this is a monthly timeframe.) The first one from the Panic of 1893 to the Great Depression of 1932. ~40 years. The second one from the true end of the Great Depression (1942--US WWII production boom) to the Nixon-Vietnam-Energy crisis crash of 1978. ~32 years. The third cycle from the after the Nixon Era crash to the Wall Street greed-induced Housing Market Crash of 2008. ~31 years. The fourth cycle I am guessing will be a huge bank liquidity crisis crash (already underway) or could be a US debt driven crash. I am saying 30 years which would be 2039. 15 more years of easy livin'!I should name the last cycle the "Monetary Creation Cycle" as I believe most of the gains are and will be driven by the massive amounts of money creation which will create ever diminishing returns in productivity rather than massive increases of productivity. If I were to just throw a number out, I would say it's 50/50. 50% true increase production and production efficiency and 50% simple massive monetary creation (think of that like fudging the numbers). And it is exactly that second reason that will lead to the 2039 crash and bank liquidation and debt liquidation event.
Disclaimer
Any content and materials included in Sahmeto's website and official communication channels are a compilation of personal opinions and analyses and are not binding. They do not constitute any recommendation for buying, selling, entering or exiting the stock market and cryptocurrency market. Also, all news and analyses included in the website and channels are merely republished information from official and unofficial domestic and foreign sources, and it is obvious that users of the said content are responsible for following up and ensuring the authenticity and accuracy of the materials. Therefore, while disclaiming responsibility, it is declared that the responsibility for any decision-making, action, and potential profit and loss in the capital market and cryptocurrency market lies with the trader.