
CryptoSignalAPP
@t_CryptoSignalAPP

What symbols does the trader recommend buying?
Purchase History
پیام های تریدر
Filter
CryptoSignalAPP
AVAX MID TERM TRADE IDEA
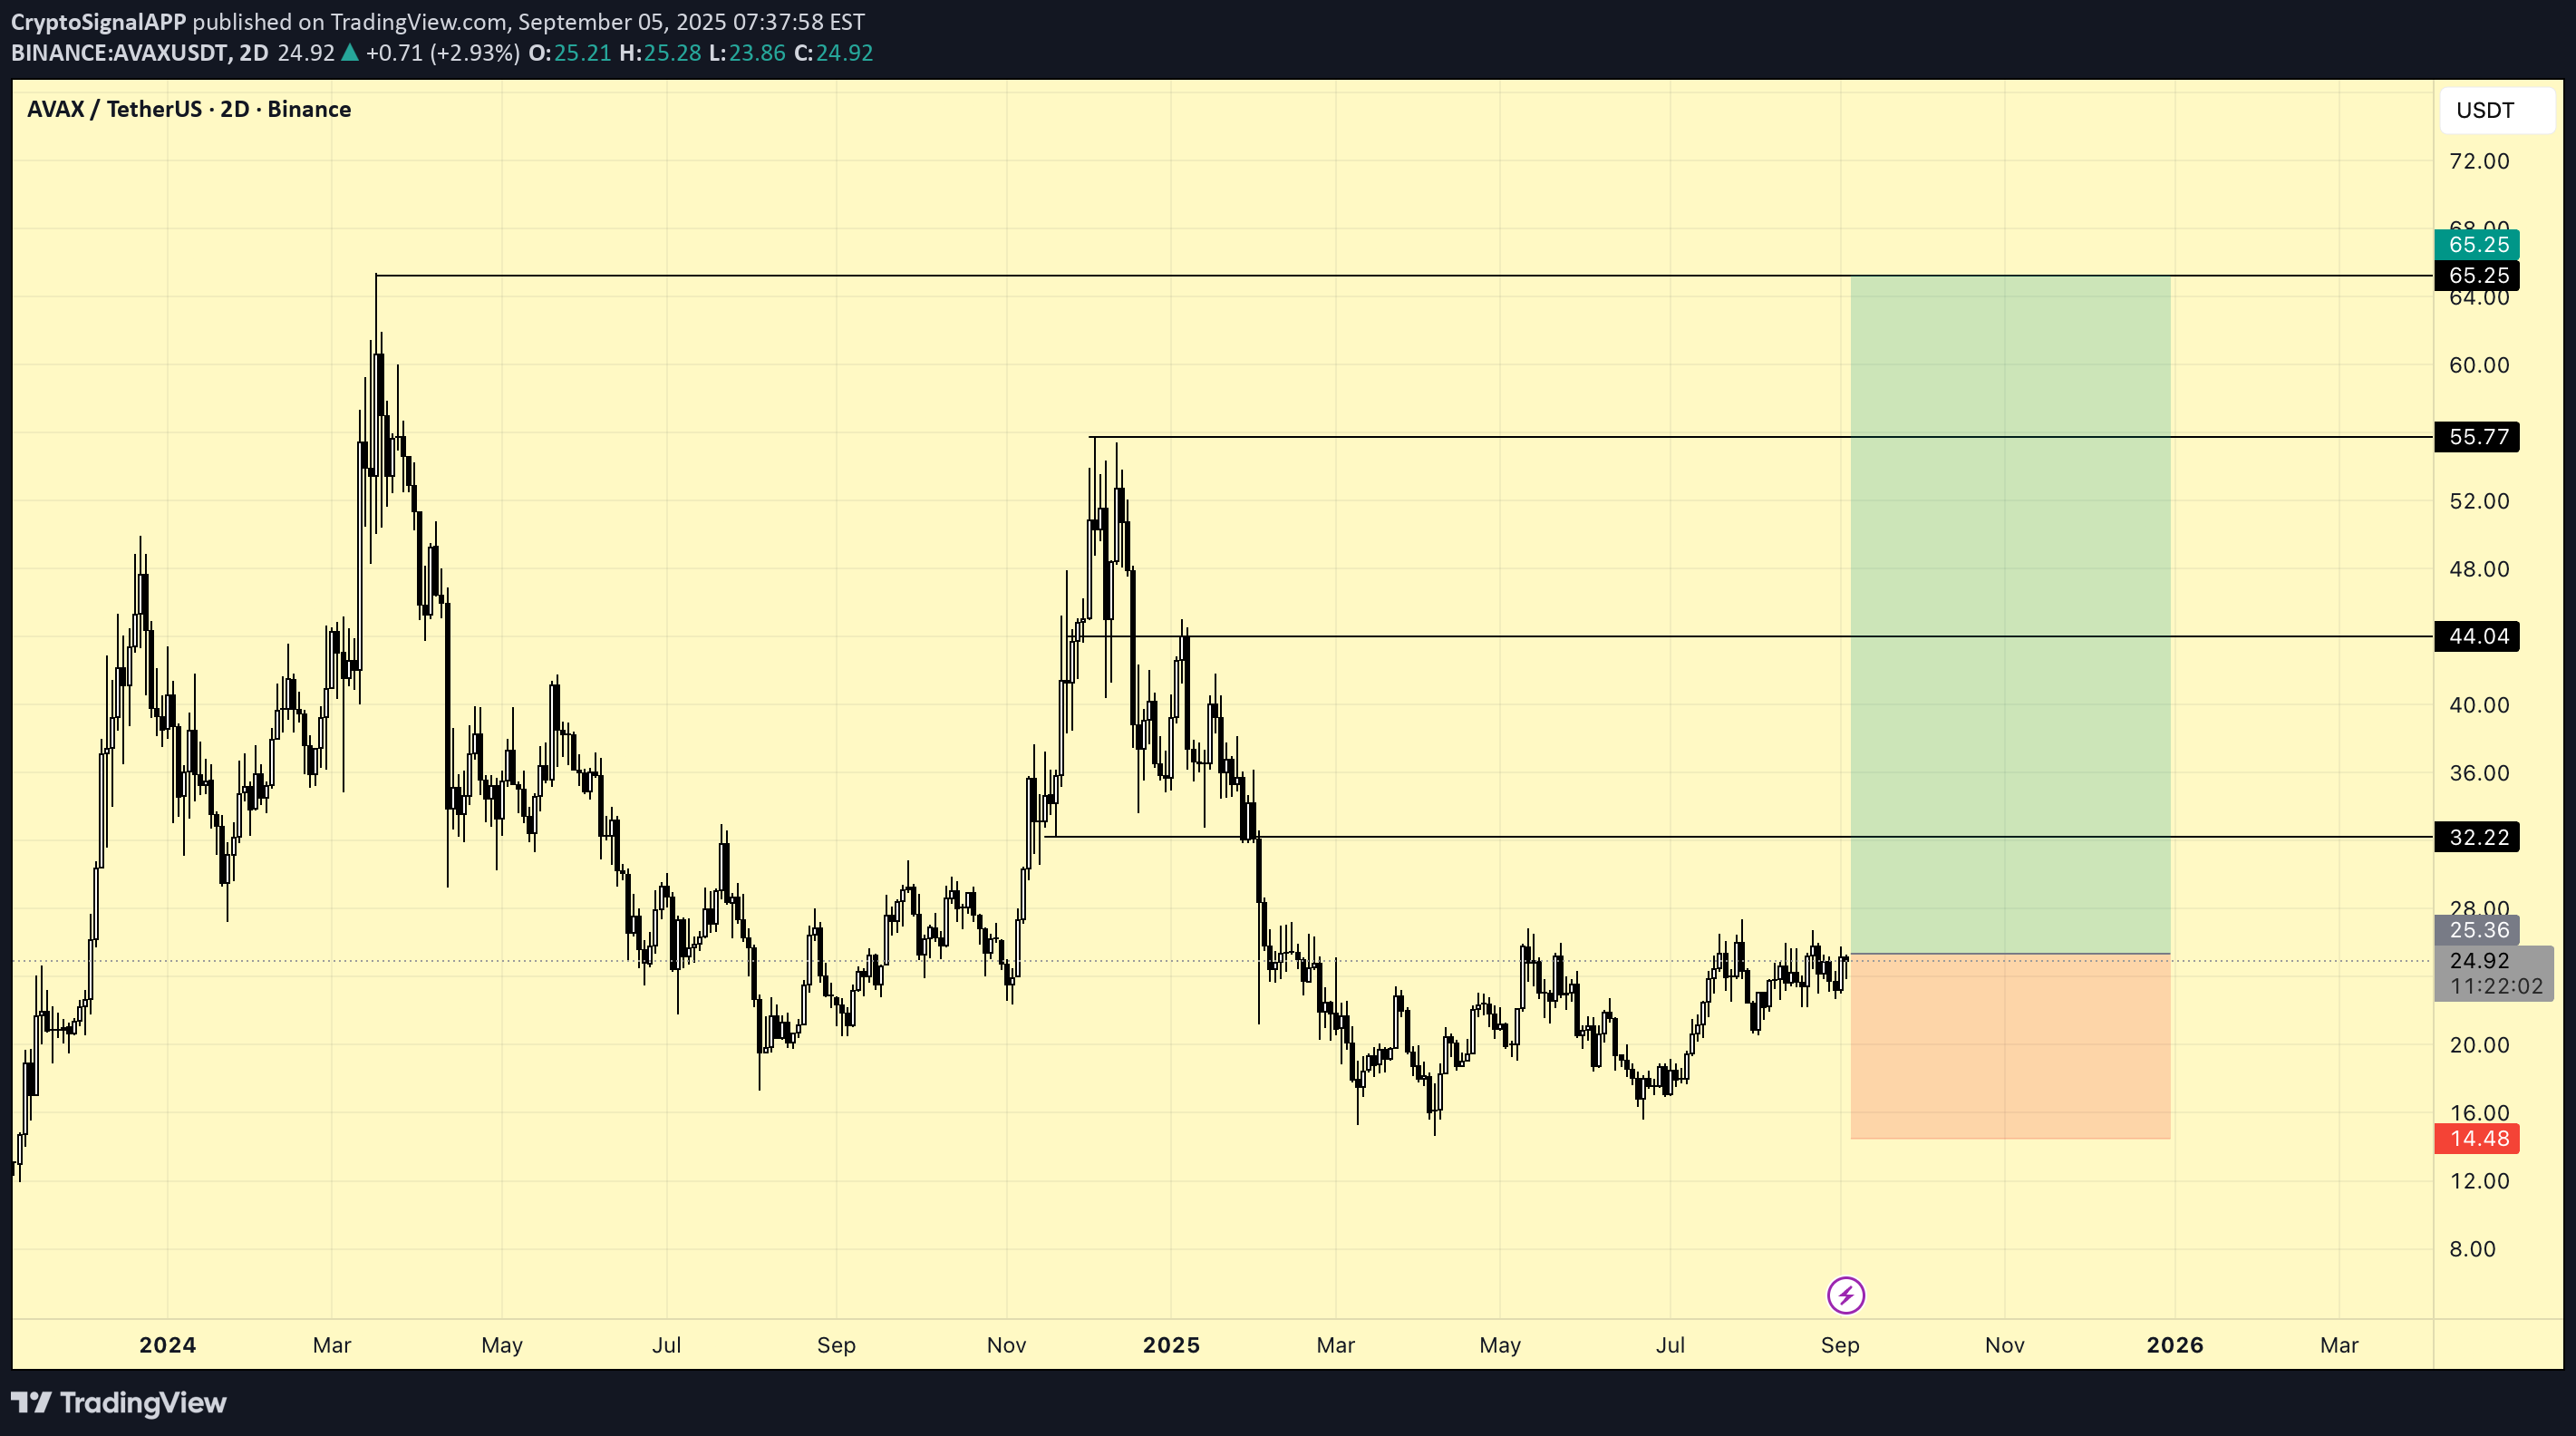
Key Features and Explanation Main support zone is marked at 14.48 USDT, indicating the stop-loss level for the setup. Major resistance zones are drawn at 32.22, 44.04, 55.77, and 65.25 USDT as potential upside targets. The green zone shows the reward/risk area for a bullish scenario, while the red zone visualizes the risk if price drops below support. Current price is around 24.95 USDT, in a sideways consolidation near local resistance. Trade Setup Summary The chart captures a medium-term opportunity favoring a move up from the current range, aiming for the outlined resistance targets with managed stop-loss. Level markings help define clear entries, exits, and targets for risk management. Overall, this chart offers a structured technical outlook for AVAXUSDT, combining price levels with visual risk/reward parameters for effective trading assessment.
CryptoSignalAPP
Bitcoin Market Update – August 19, 2025: Key Levels to Watch
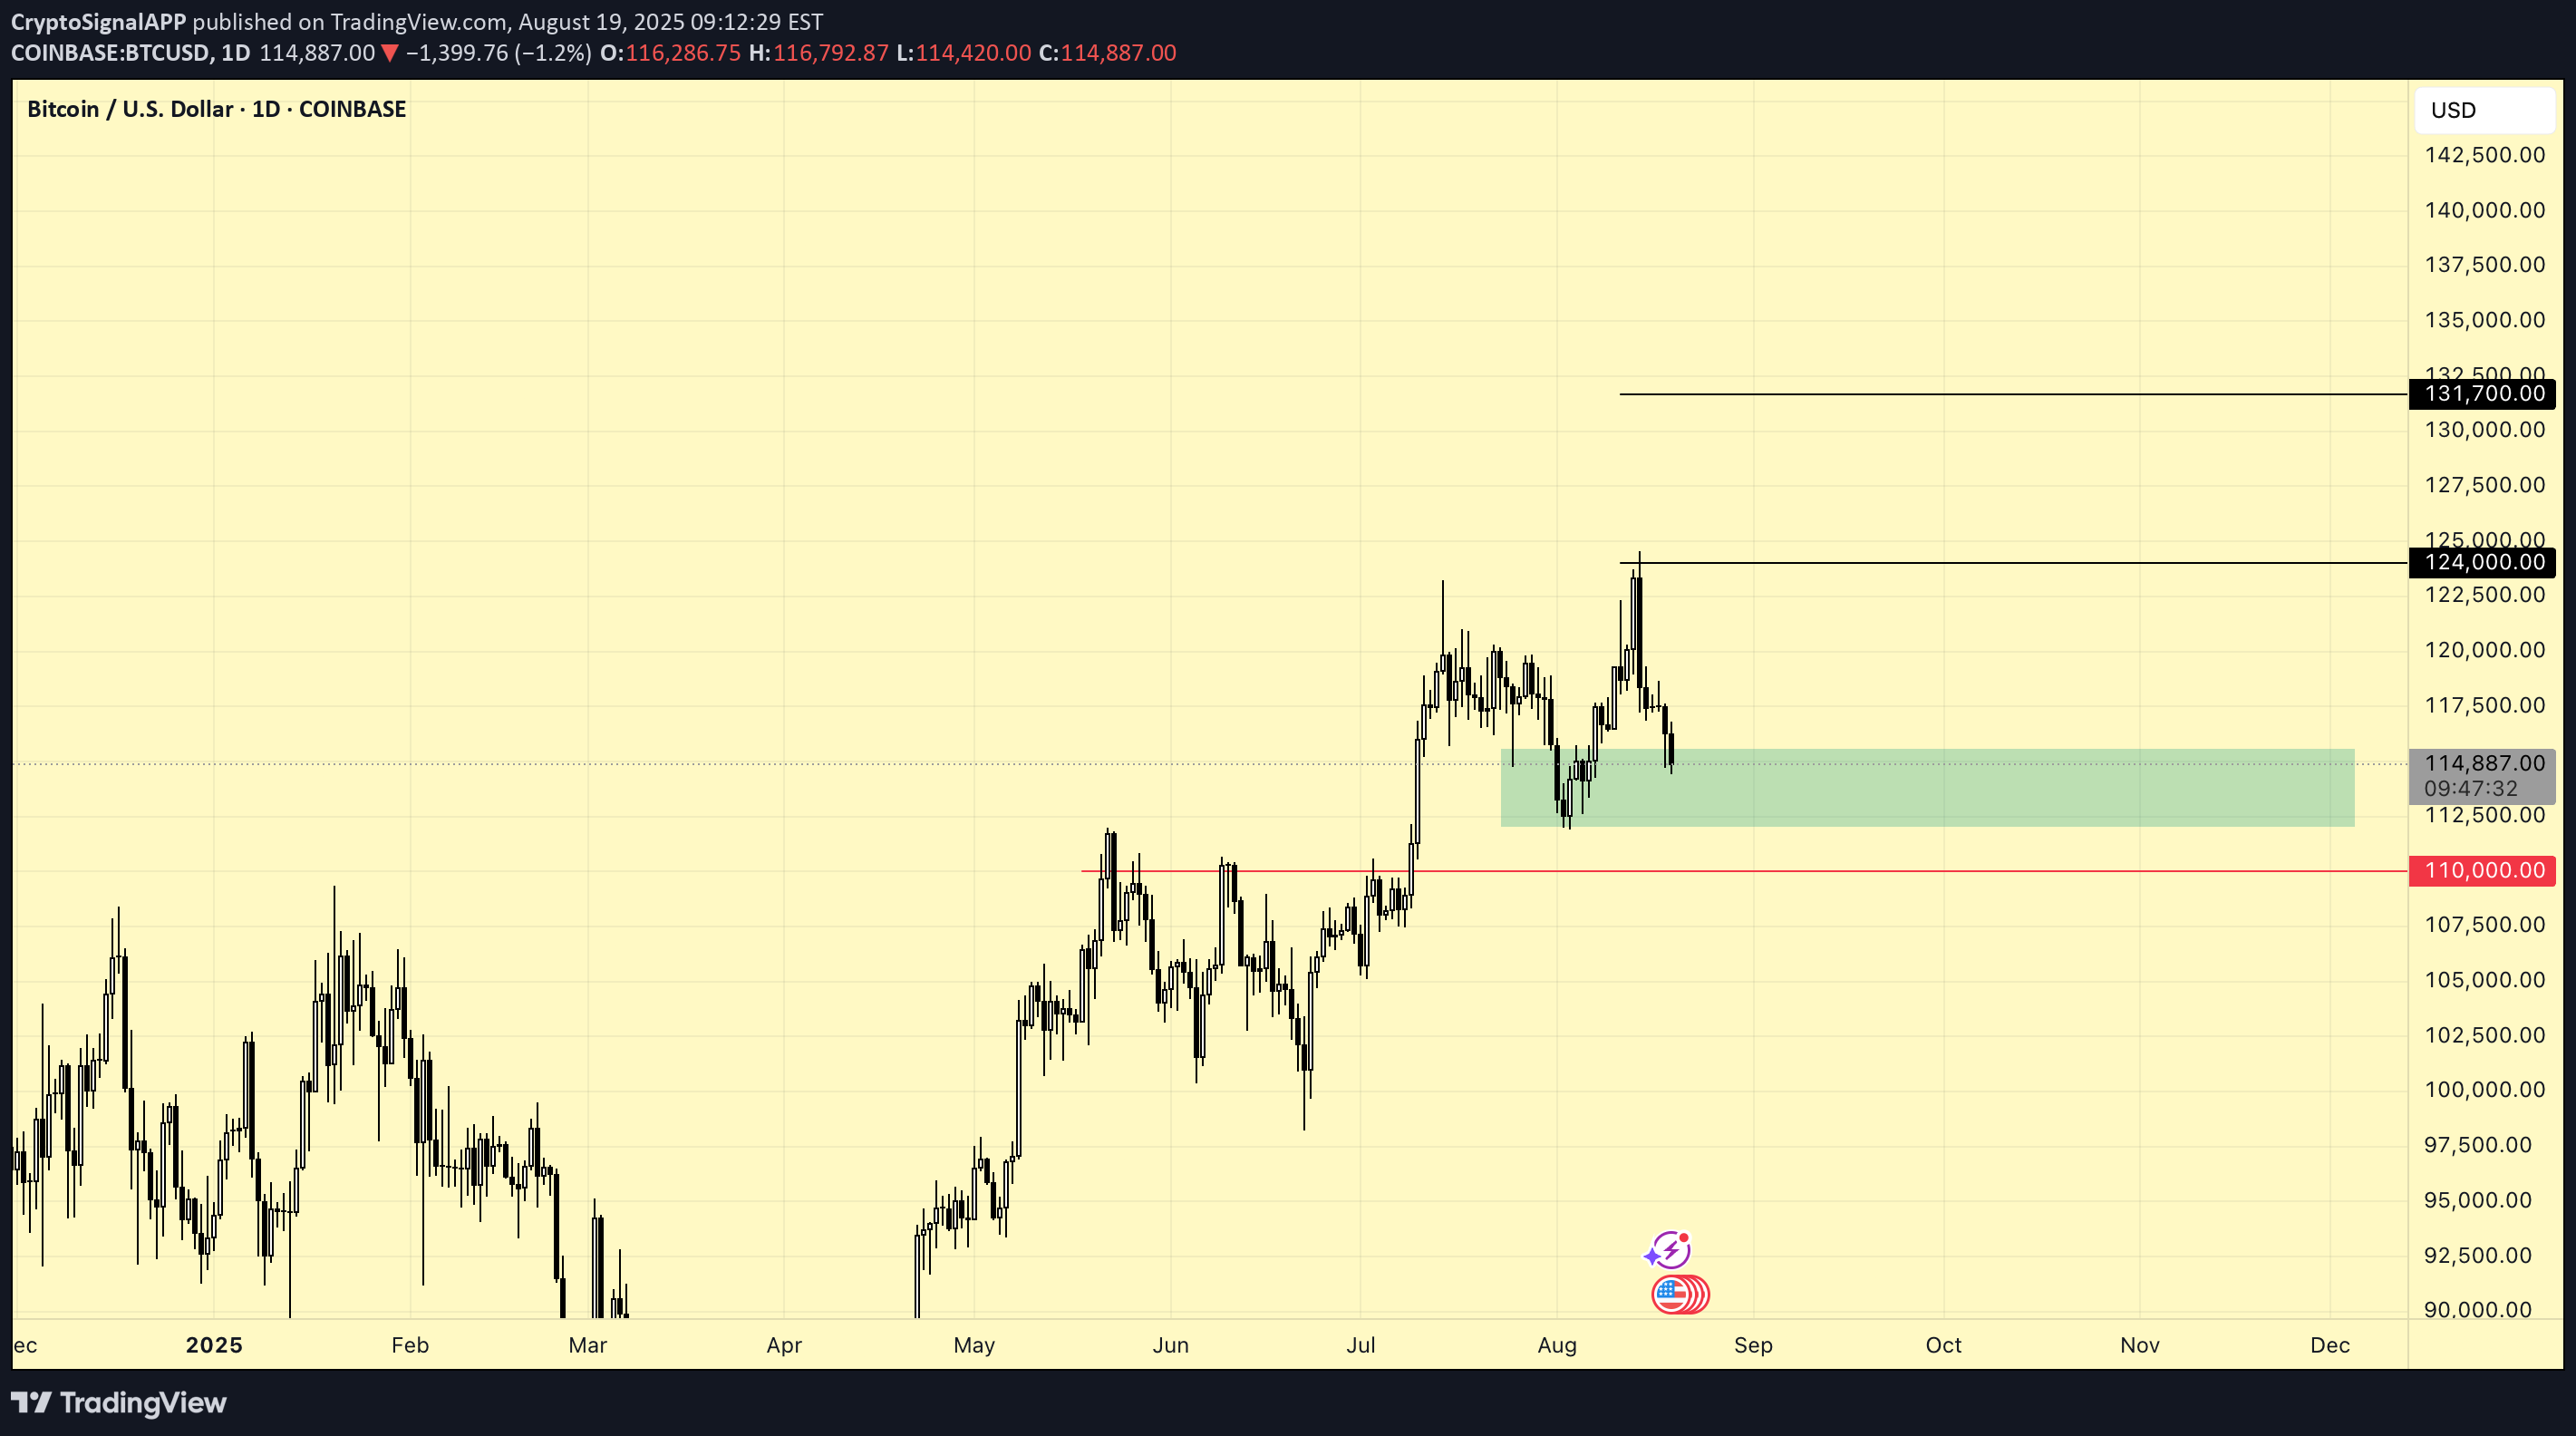
Dear Crypto Enthusiast, As of August 19, 2025, here is your latest Bitcoin (BTC) market analysis to help you stay ahead in this dynamic market. Bitcoin Price Overview Bitcoin recently experienced a pullback from its mid-August highs around $124,000, settling near the critical support level of $115,000. This zone could act as a launching point for a potential rebound or signal further volatility depending on upcoming market dynamics. What the Technicals Are Saying Short-term bullish momentum is visible as BTC oscillates between $115,000–$117,500. A decisive close above this range would reinforce upward momentum. Should BTC dip below $110,000, it might trigger deeper corrections in the near term. Looking Ahead August trading is expected to be volatile, with BTC price fluctuating roughly between $115,600 and $122,000. Forecasts suggest an upward surge in September, possibly pushing Bitcoin prices up to $131,700. Market Sentiment and Outlook Post-correction rallying from $112,000 lows indicates renewed bullish interest, supported by rising activity on CME futures and strengthening institutional demand. As digital asset treasuries grow cautiously, the medium-term outlook for Bitcoin remains constructive. What This Means for You Monitor the $115,000 support closely; it’s pivotal for near-term trading strategies. Watch for potential breakouts above $117,500 as confirmation of sustained buying pressure. Stay alert to macroeconomic factors that can influence crypto markets overall. Stay tuned with CryptosignalApp for real-time signals and expert market insights to capitalize on Bitcoin’s evolving trends. Trade smart, trade informed. Best regards, The CryptosignalApp Team
CryptoSignalAPP
Bitcoin Analysis - 7 May

The price continues to move within the range of $91,700 - $100,400. In approximately 3 hours, the FED will announce its interest rate decision. The expectation is for it to remain unchanged. If it remains unchanged; there could be a horizontal consolidation between 94,990 – 97,500. If a breakout occurs, the upward movement will accelerate; otherwise, there could be a pullback to the 91,781 – 94,990 levels. If the interest rate is reduced; the psychological resistance at 100,400 USDT may be tested, and if surpassed, the target of 109,605 (ATH) comes into play. If the interest rate is increased; the supports at 94,990 USDT and below could be tested quickly. The levels of 91,781 and 85,085 USDT become potential targets. With stronger selling, the support zone at the 2024 ATH level of 73,776 USDT may come into play.
CryptoSignalAPP
RENDER MID TERM
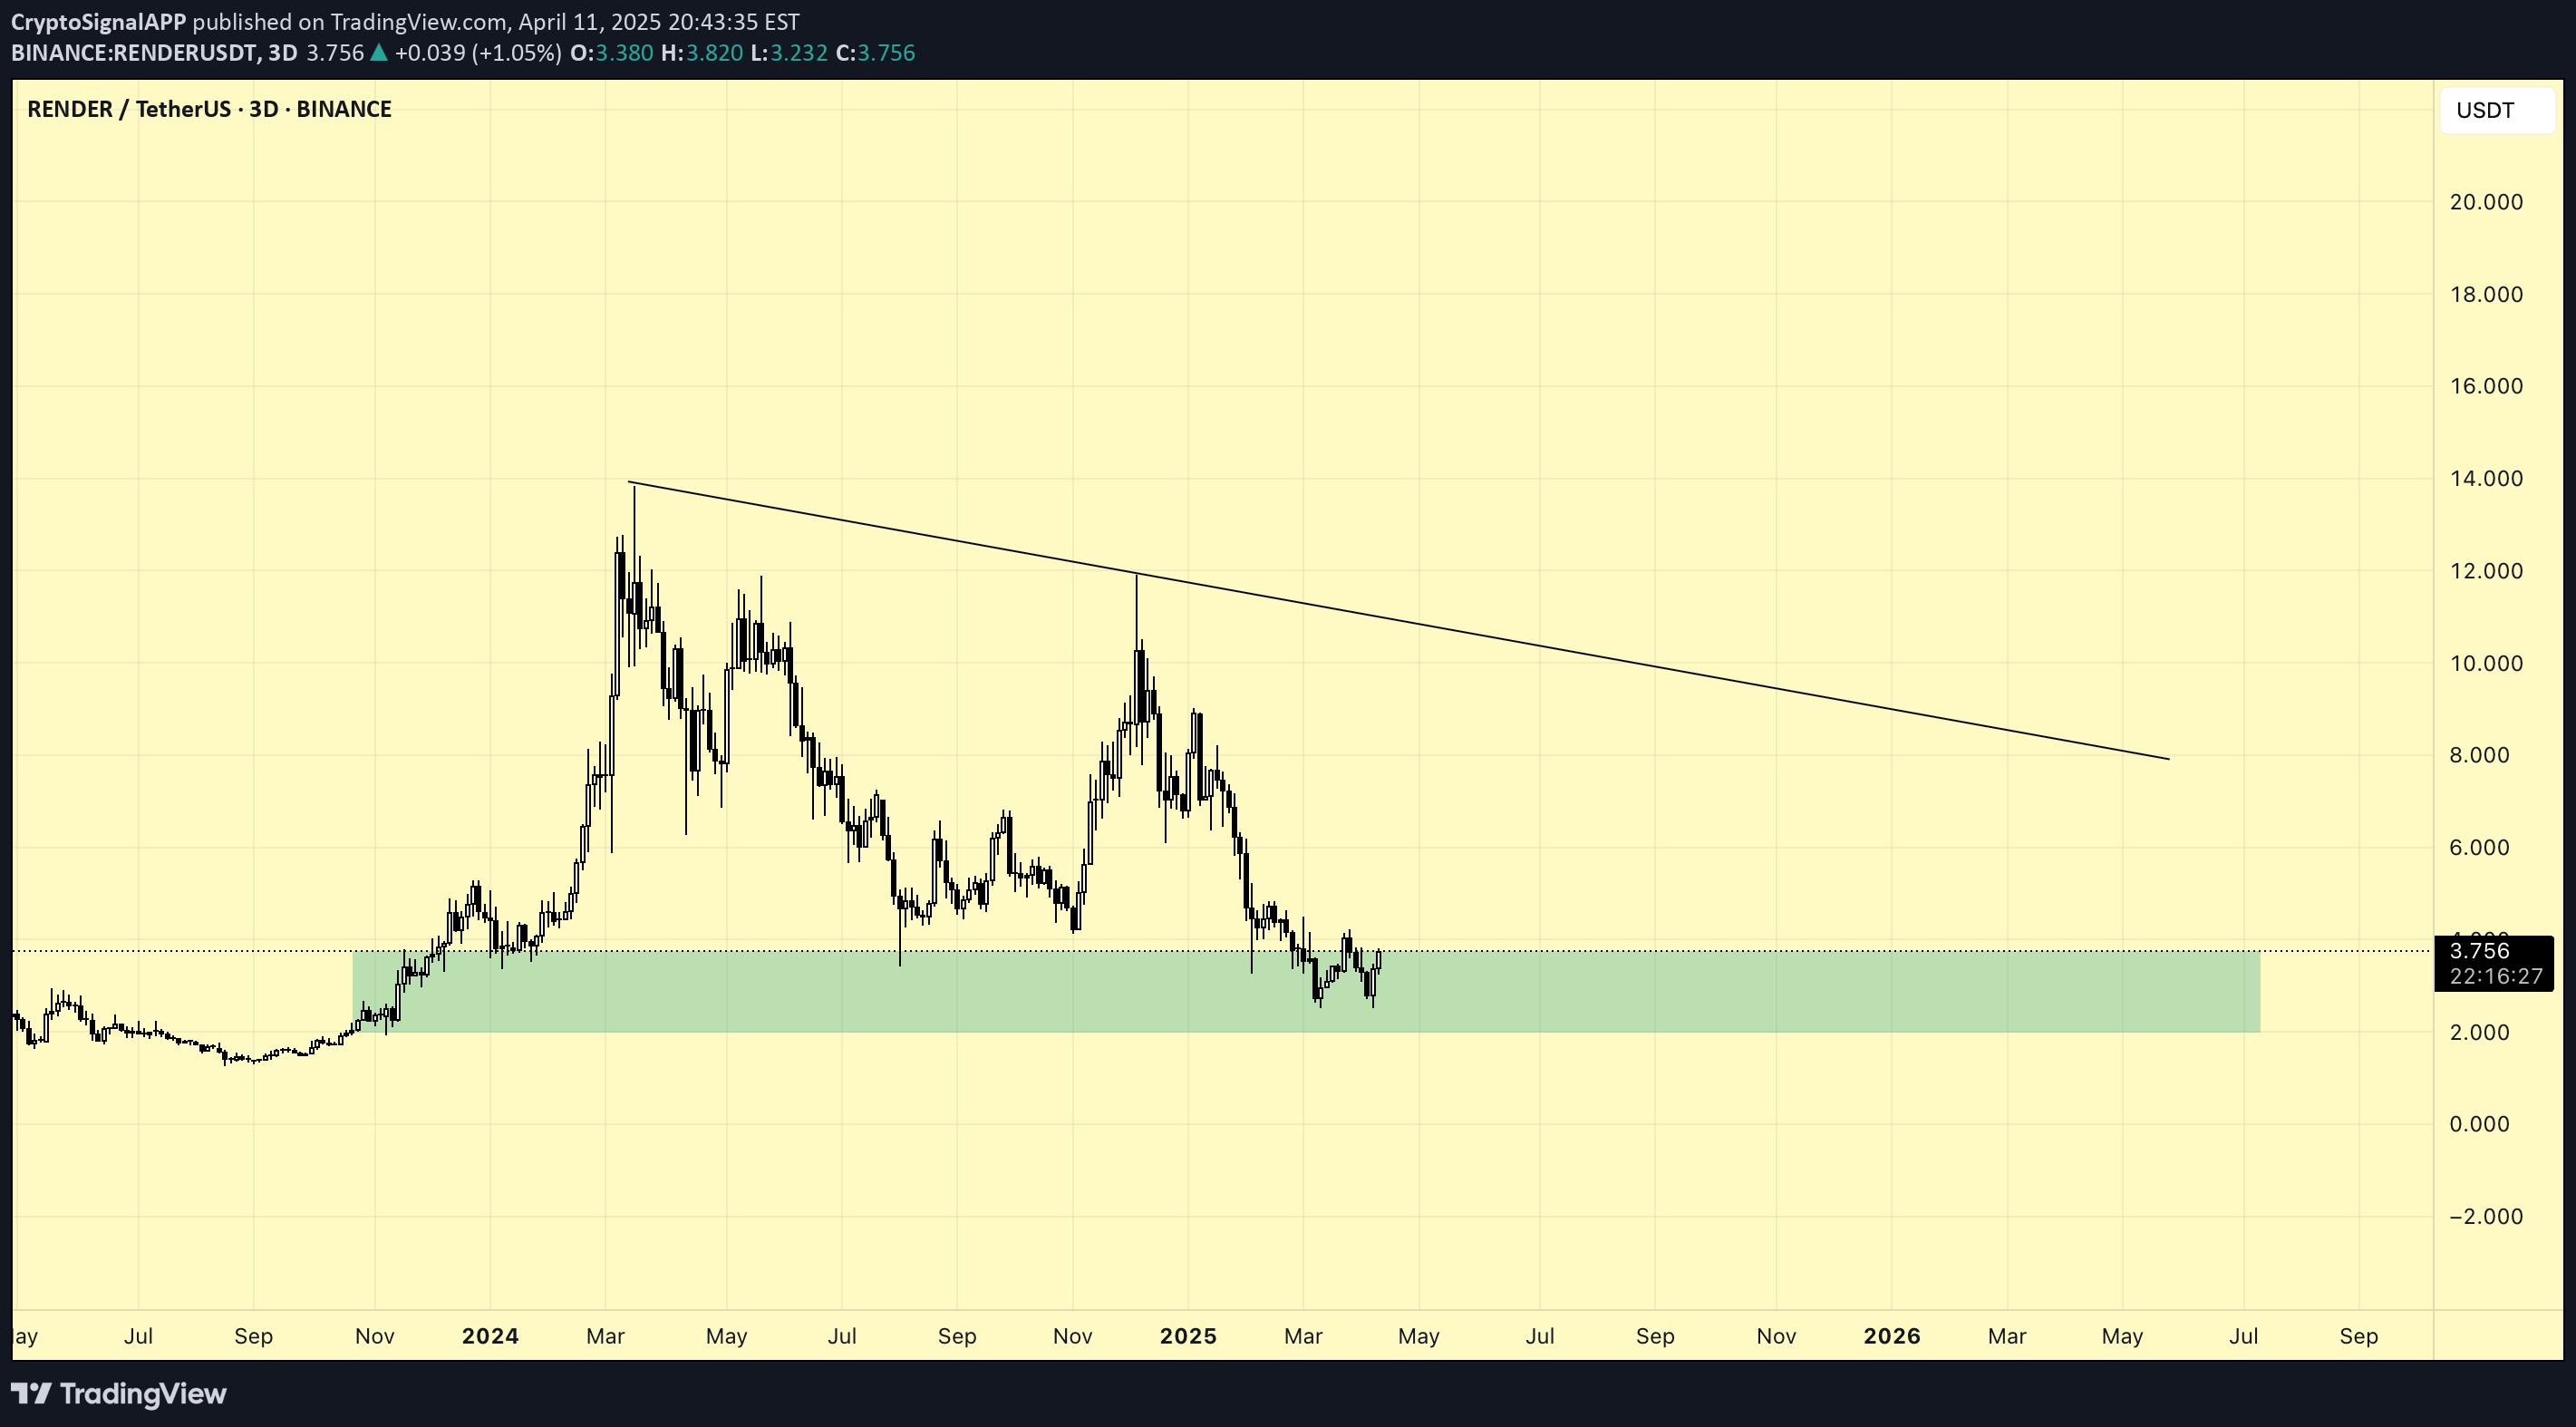
Render is in a very good condition for medium and long-term investment. Take your risk, make some profit.
CryptoSignalAPP
CHZ Mid Term

Chiliz (CHZ/USDT) Summary Analysis •Support Zone: $0.0430 - $0.0610 USDT (strong demand area). •Resistance Levels: $0.0704 → $0.0878 → $0.1111 → $0.1412 USDT. •Trend: After a downtrend, there is a potential for recovery from support. Scenarios: ✅ Bullish: If CHZ holds above $0.0610 USDT, the first target is $0.0704 USDT, followed by $0.0878 and $0.1111 USDT. ❌ Bearish: If CHZ falls below $0.0610 USDT, a drop to $0.0430 USDT is possible. 🔄 Neutral: Price may consolidate between $0.0610 - $0.0704 USDT. Strategy: 🔹 Entry: Buy within the $0.0611 - $0.0500 USDT range, with a stop loss below $0.0430 USDT. 🔹 Sell: A close below $0.0610 USDT may accelerate the downtrend. 📊 Conclusion: The $0.0610 USDT level is critical—if CHZ holds above it, a rally could follow. 🚀
CryptoSignalAPP
LINK Mid Term

Chainlink (LINK/USDT) Summary Analysis • Support Zone: $16.00 - $12.64 USDT (strong demand area). • Resistance Levels: $24.12 USDT (first target) and $35.40 USDT (main target). • Channel Structure: Price is near the lower band of a descending parallel channel, indicating a potential reversal signal. Scenarios: ✅ Bullish Scenario: If LINK bounces from $16.00 USDT, targets are $24.12 USDT and $35.40 USDT. ❌ Bearish Scenario: A close below $16.00 USDT could trigger a drop to $12.64 USDT. Strategy: 🔹 Entry: Buy within the $16.00 - $18.00 USDT range, with a stop loss below $12.64 USDT. 🔹 Breakout: A breakout above $24.12 USDT presents a buying opportunity. 🔹 Sell: A close below $16.00 USDT may accelerate the downtrend. If the channel breaks out, LINK has significant upside potential. 🚀Price now on support zone.
CryptoSignalAPP
AVAX MID TERM IDEA

Summary: Support Zone: $22.7 - $15.7 USDT (Demand Area). Resistance Levels: $30, $35, and $45 USDT. Short-Term: Downtrend continues, but signs of recovery can be monitored within the demand zone. Mid-Term: A breakout above $30 USDT signals a potential trend shift. Long-Term: If it recovers from the demand zone, the target range could extend to $45-$65 USDT. Strategy: Entry: Buy within the $22.7 - $15.7 USDT demand zone, with a stop loss below $15.5 USDT. Targets: $30, $35, and $45 USDT. Bearish Scenario: A drop below $15.7 USDT may increase selling pressure.Price now on support zone.
CryptoSignalAPP
Bitcoin Mid Term

First Impression: The BTC/USD pair appears to have dropped below the $95,000 level and is under selling pressure. Strong support levels are evident in lower regions. The price is retracing toward levels that previously acted as support during bullish moves. Volume Analysis: No notable increase in volume is observed on the chart. This could indicate that the current downward move is a low-volume correction or that the market is indecisive. However, if volume increases, the likelihood of the downtrend continuing may rise. Price Action: The price is trading around $94,000, showing downward movement. Below, key support levels are visible near $90,700, $88,000, and $85,000. These levels have historically been areas where strong buyers stepped in, making them potential zones for price reactions. Positive Scenario: If the price holds at $94,000 and starts a recovery move, it could climb back above $95,000. In this case, $97,500 would be the first target. Sustained movement above this level could push the price back toward the psychological resistance at $100,000. Negative Scenario: If the price drops below $94,000, a decline toward $90,700 becomes more likely. A break below this support level could lead to further declines to $88,000 and then $85,000. This scenario would indicate continued selling pressure. High Probability: Given current market conditions, it is highly probable that the price consolidates between $90,700 and $94,000 for some time. The balance of buyers and sellers in this zone will determine the direction of the next trend. Overall: The BTC/USD pair is trading near a critical support zone. The $94,000 level should be closely monitored; a drop below this level could drive the price toward lower supports. For upward recoveries, $95,000 and $97,500 are the first resistance levels to watch. Strategies should be adjusted based on volume and price action.
CryptoSignalAPP
SOL Mid Term Idea

Solana has reached a critical crossroads. The price is currently above a crucial SR Flip zone. Staying above this level could lead to targets of $140, $162, $175, and $202, and potentially a new all-time high (ATH). However, if it closes below this zone, we might see a pullback to the $70-$80 range.
CryptoSignalAPP
TON Coin Mid Term LONG Idea

TON coin is currently experiencing panic selling due to the founder’s arrest. However, we believe in the strength and potential of the TON ecosystem. Technically, it’s at levels that are suitable for buying, and long-term investors may consider adding it to their SPOT wallets using the DCA strategy. For those who prefer to avoid risk, they can wait to enter the trade after a deviation outside the range. Take your risk, make some profit !The price started moving towards our target of $7 after making the expected move. Those who do not want to take risks can take profit or set a stop entry.
Disclaimer
Any content and materials included in Sahmeto's website and official communication channels are a compilation of personal opinions and analyses and are not binding. They do not constitute any recommendation for buying, selling, entering or exiting the stock market and cryptocurrency market. Also, all news and analyses included in the website and channels are merely republished information from official and unofficial domestic and foreign sources, and it is obvious that users of the said content are responsible for following up and ensuring the authenticity and accuracy of the materials. Therefore, while disclaiming responsibility, it is declared that the responsibility for any decision-making, action, and potential profit and loss in the capital market and cryptocurrency market lies with the trader.