
CryptoObi
@t_CryptoObi

What symbols does the trader recommend buying?
Purchase History
پیام های تریدر
Filter
CryptoObi
آیا قیمت طلا به ۴۵۰۰ دلار میرسد؟ تحلیل تکنیکال و پیشبینی حرکت بعدی XAUUSD
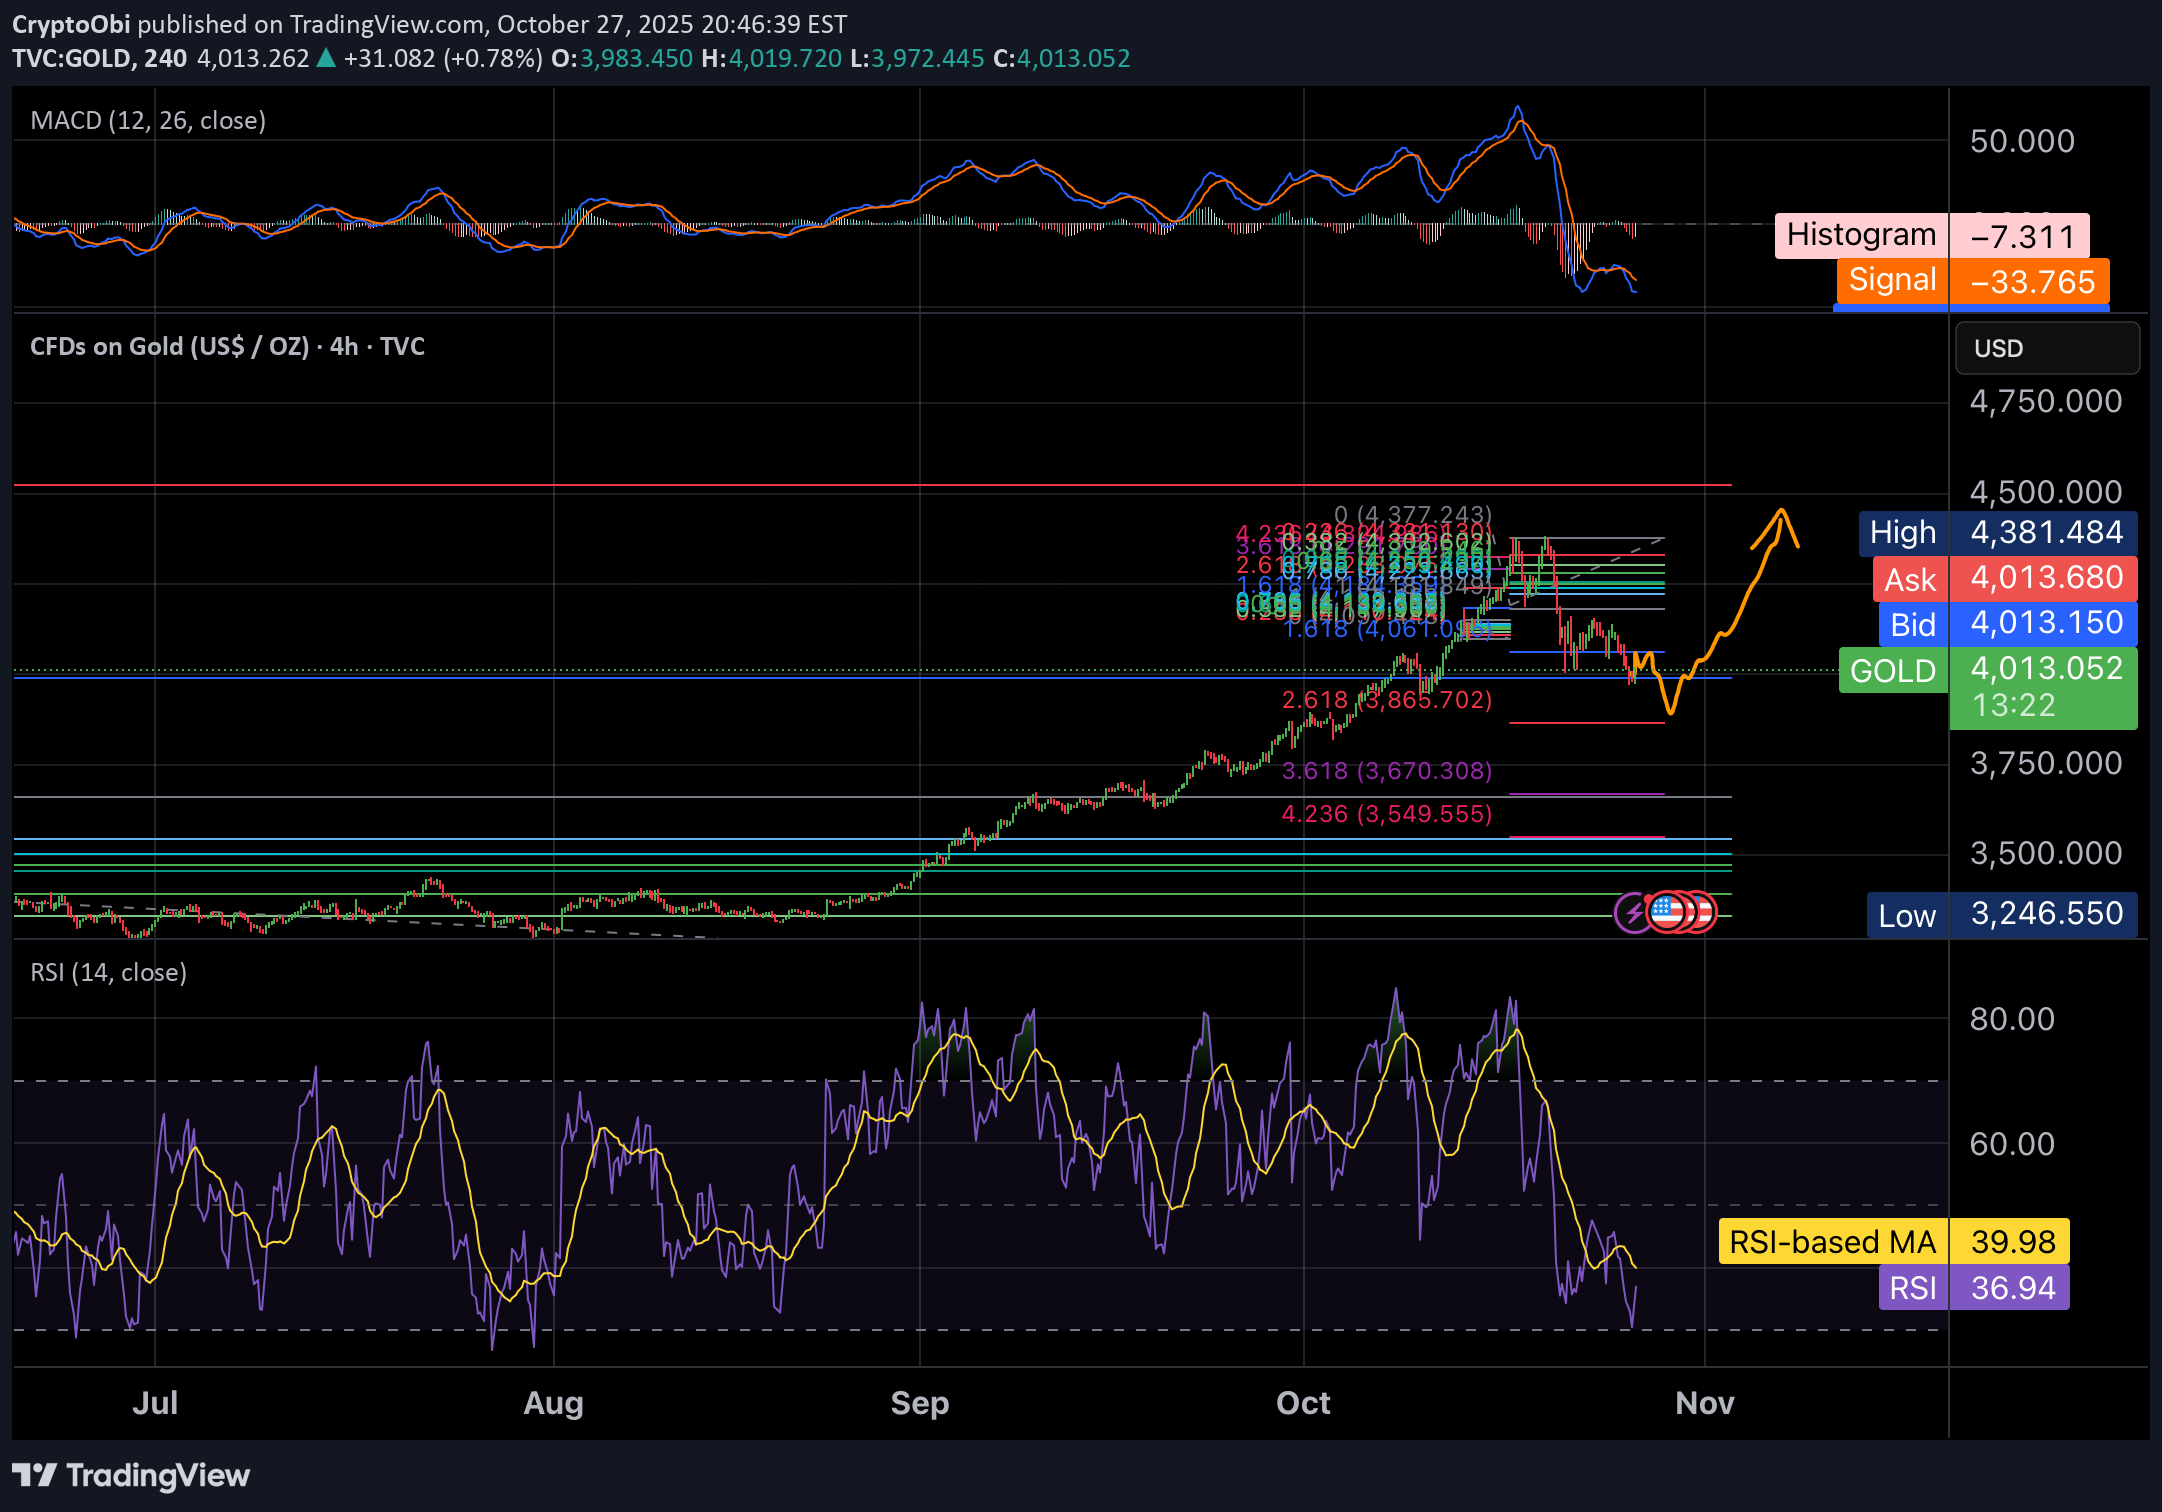
You’re looking at a 4-hour chart of Gold (XAUUSD) with a combination of Fibonacci extensions, RSI, and MACD indicators. 1. Price action & Fibonacci levels •Current price: around $4,008. •The chart shows retracement and extension levels, with key Fibonacci zones marked (0.618, 1.618, 2.618, etc.). •The price recently retraced to the 1.618 level (~$4,010) — a common Fibonacci support zone — and bounced slightly. •There’s also a 2.618 extension at $3,865, suggesting that if $4,000 fails as support, the next downside target could be around $3,865. 2. MACD (top indicator) •MACD Line (blue) is well below the Signal Line (orange) → strong bearish momentum. •Histogram is negative (–7.643), confirming the bearish trend. •However, the histogram bars are starting to shrink, which can often signal bearish exhaustion or a potential bullish reversal coming. 3. RSI (bottom indicator) •RSI = 35.93, with the RSI-based MA at 39.91. •This means Gold is nearing oversold territory (below 30) — it’s not extreme yet, but buyers might soon step in. •If RSI turns up and crosses the MA, it could confirm the beginning of a short-term reversal. 4. Projected path (orange line on chart) •The drawn orange curve shows a possible bounce scenario: •Gold could dip slightly below $4,000 or test $3,865 (2.618 level), •then begin a gradual recovery toward $4,380–$4,400. •That’s in line with a Fibonacci retracement to 1.0–1.618 area — a common recovery zone after a sharp drop. 5. Summary IndicatorCurrent BiasSignal Price ActionSlightly BearishApproaching support zone FibonacciKey support at $4,000, next at $3,865Possible bounce MACDBearish but flatteningEarly reversal potential RSINear oversoldCould trigger rebound soon Quick Take: Gold might dip slightly lower (possibly to $3,865), but technicals suggest a bullish reversal may follow in early November, targeting the $4,380–$4,400 area.
CryptoObi
Will $ETH remain bullish below $4,000?
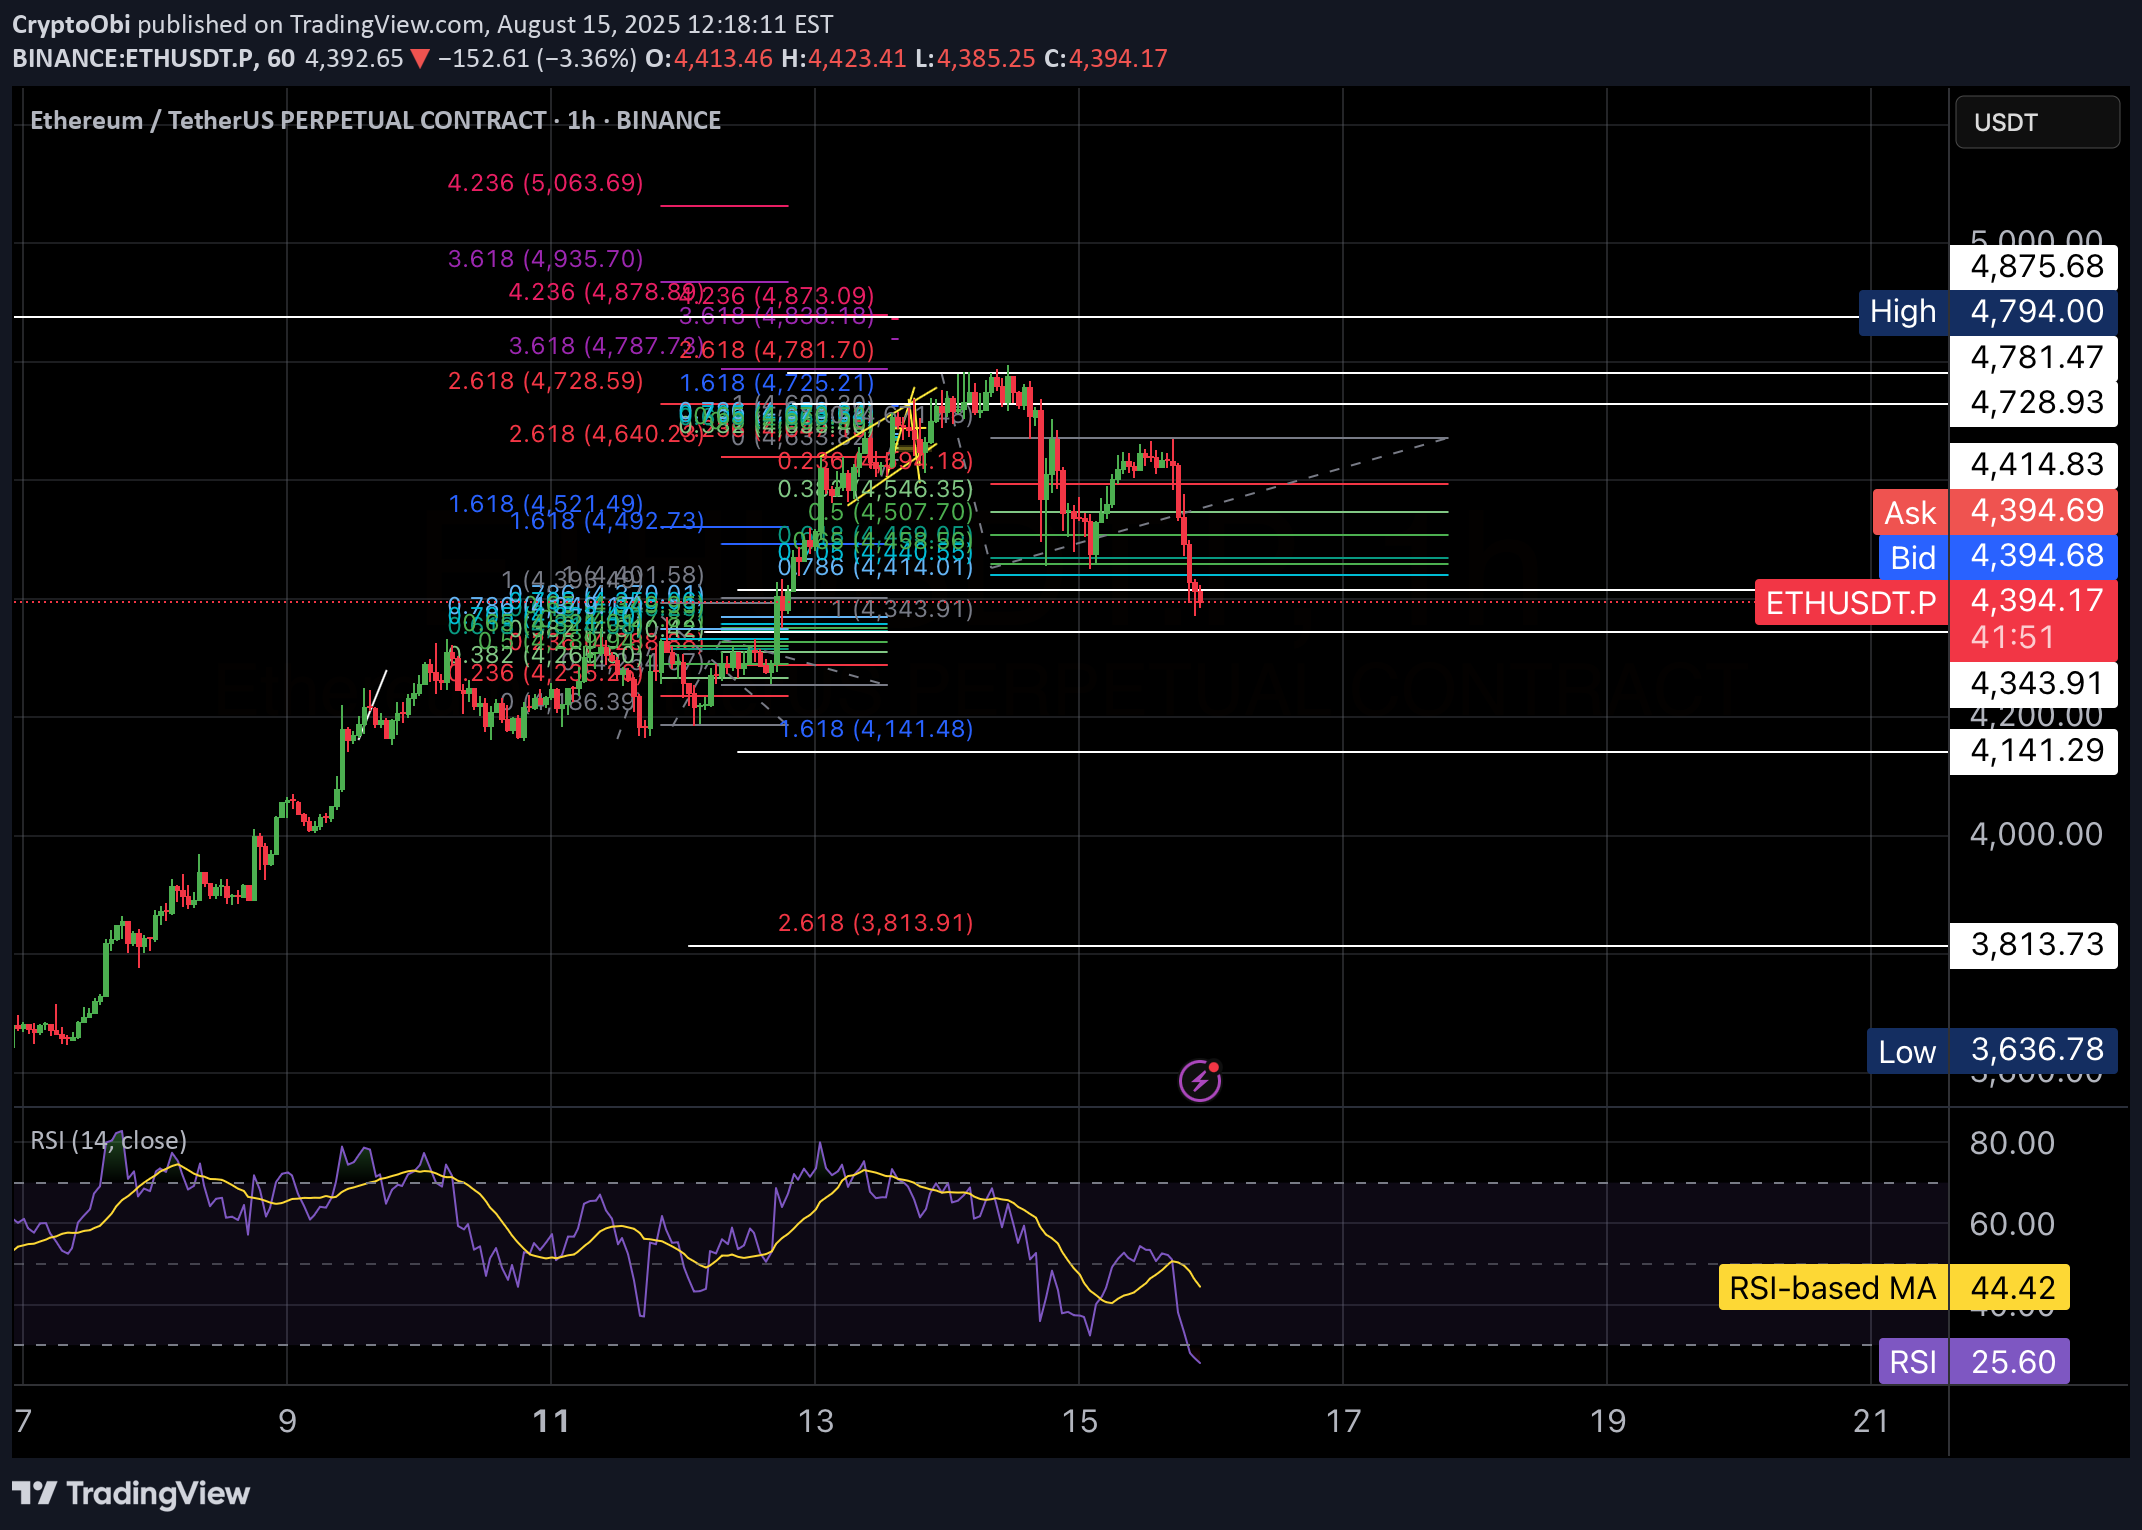
Ethereum hasn’t yet broken above its previous ATH. The colorful lines you see are mostly Fibonacci retracement & extension levels, tools traders use to identify potential support and resistance zones. •Support: a level where price might stop falling and bounce (e.g., $4,141, blue line). •Resistance: a level where price might struggle to go higher (e.g., $4,728 and $4,781, red lines). The RSI (Relative Strength Index) shows market momentum: •Above 70 = overbought (possible pullback). •Below 30 = oversold (possible bounce). Currently, RSI is at 25.82, indicating oversold conditions, which could lead to a bounce, though oversold doesn’t guarantee an immediate reversal.
CryptoObi
$6000 worth ETH?
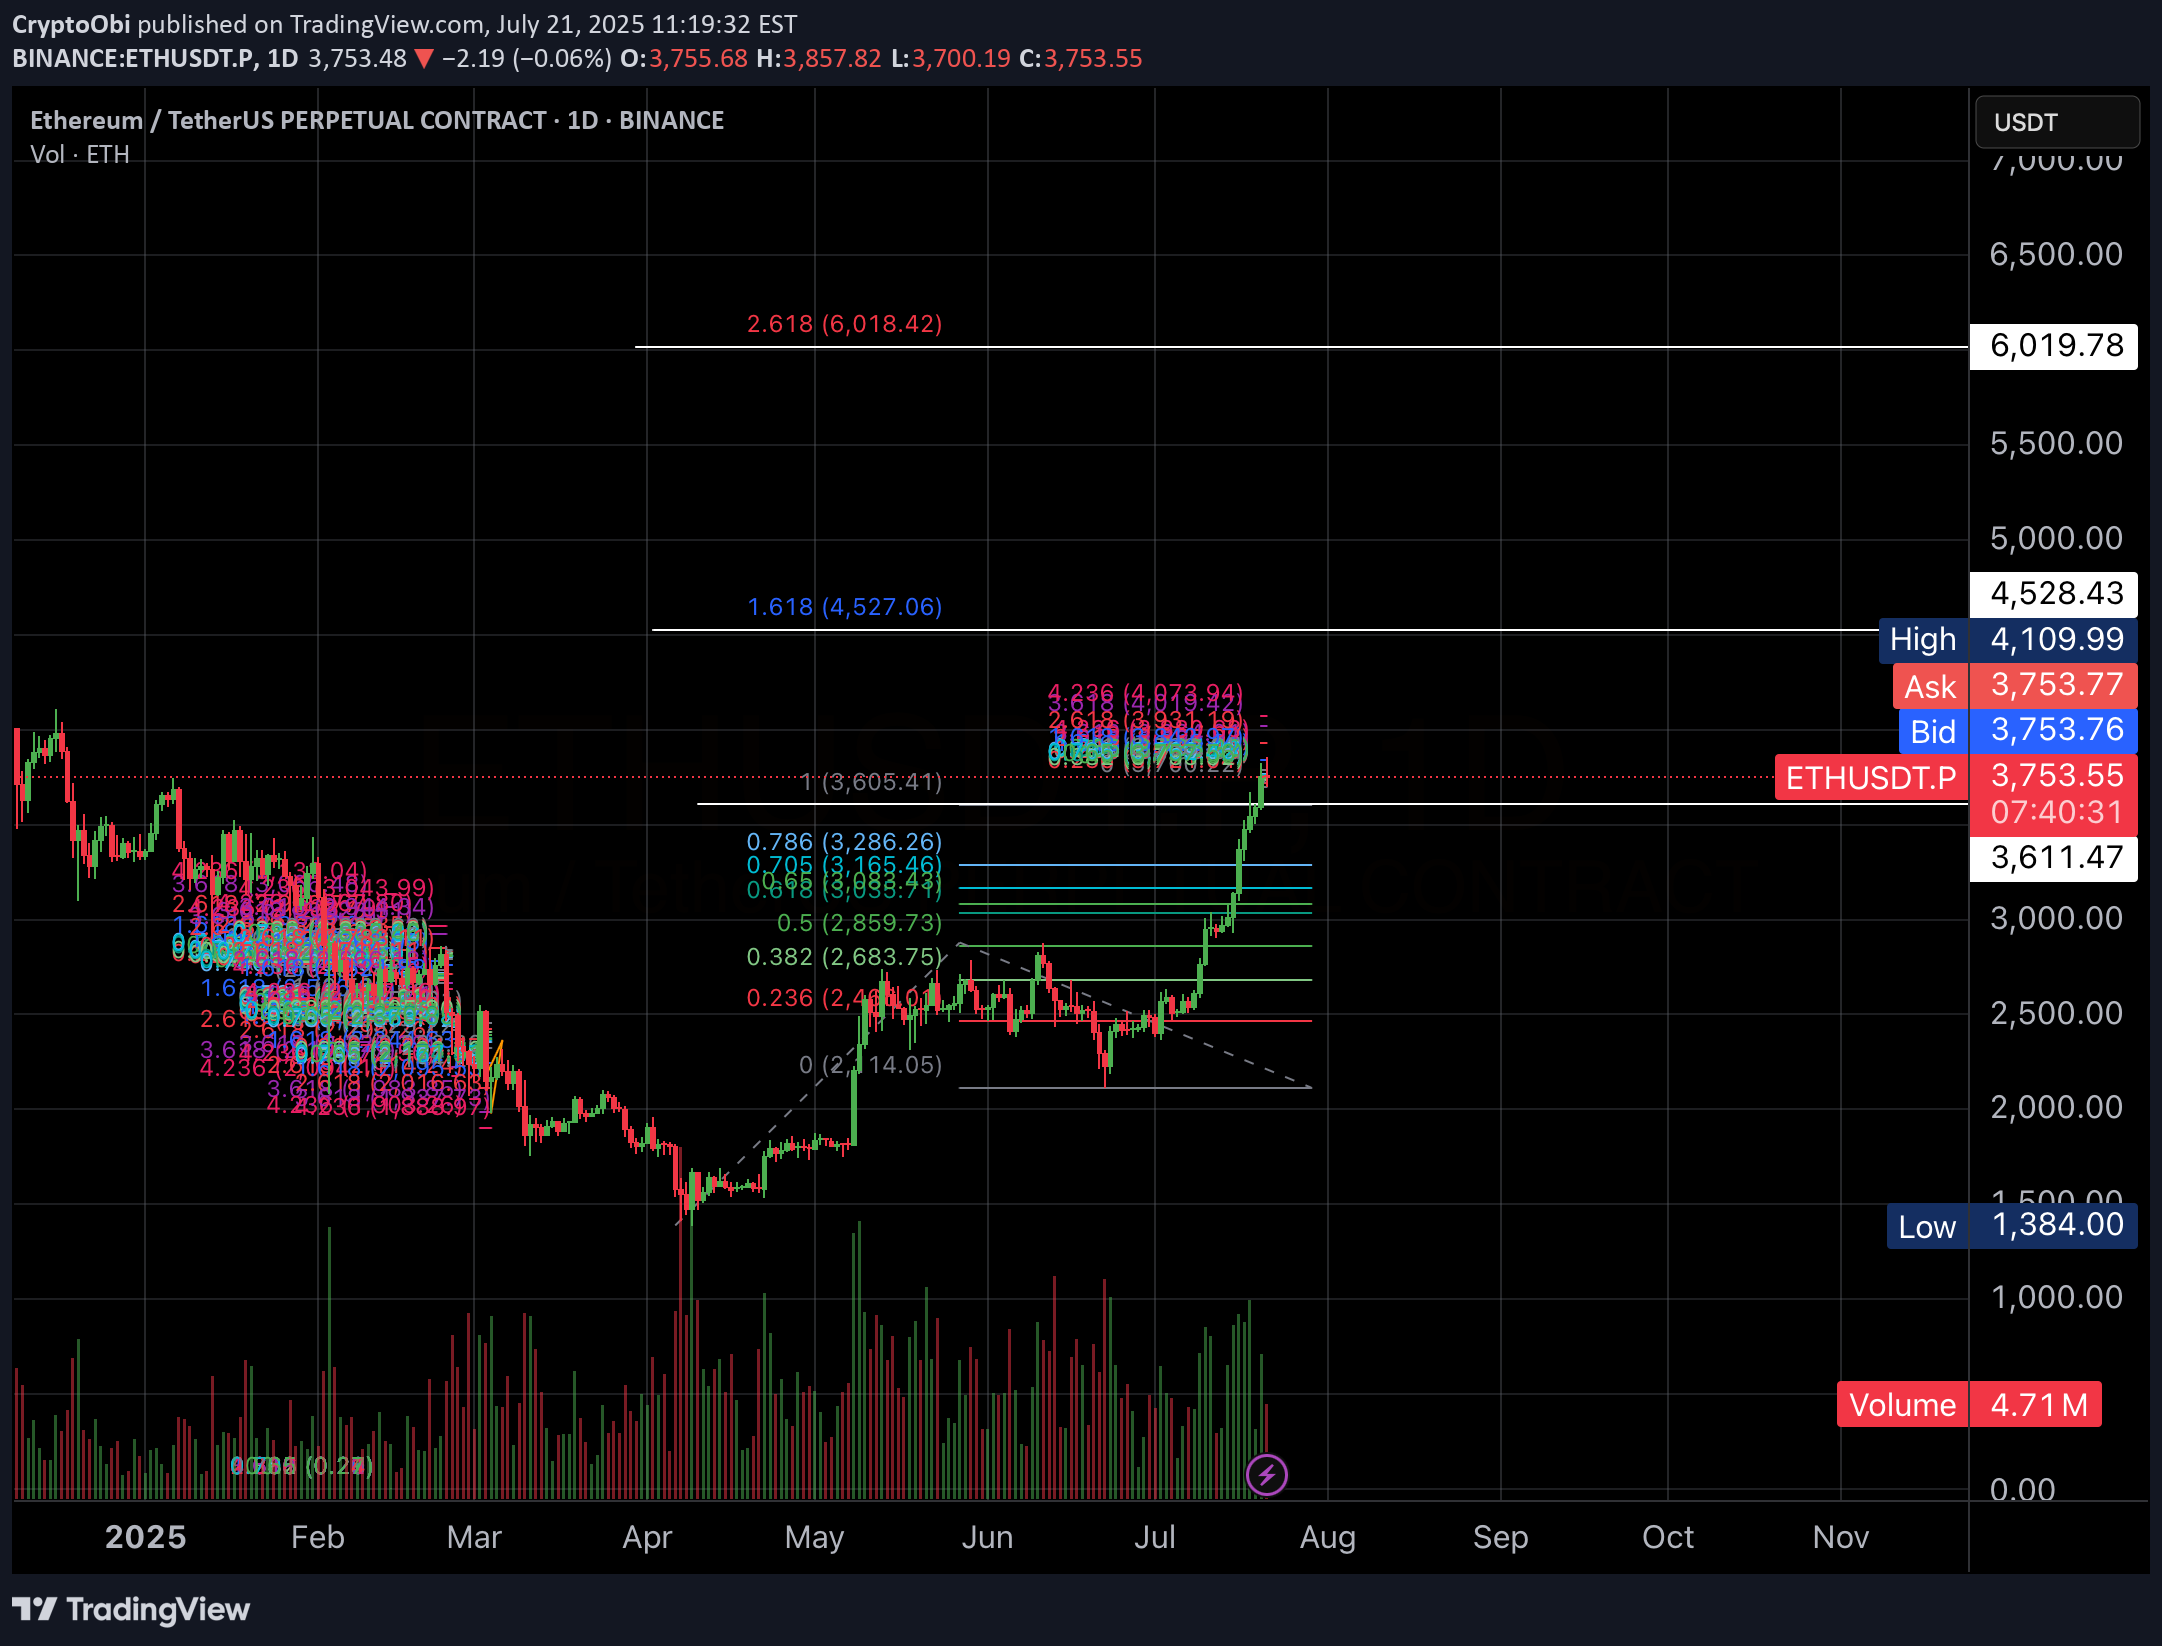
Hi Padawans, ETH is showing strong bullish momentum, currently trading around $3,766. If it breaks above the resistance near $4,500–$4,900, the 2.618 Fibonacci extension points to a potential target around $6,000. Best Regards, CryptoObi
CryptoObi
LINK to 30$ or more?
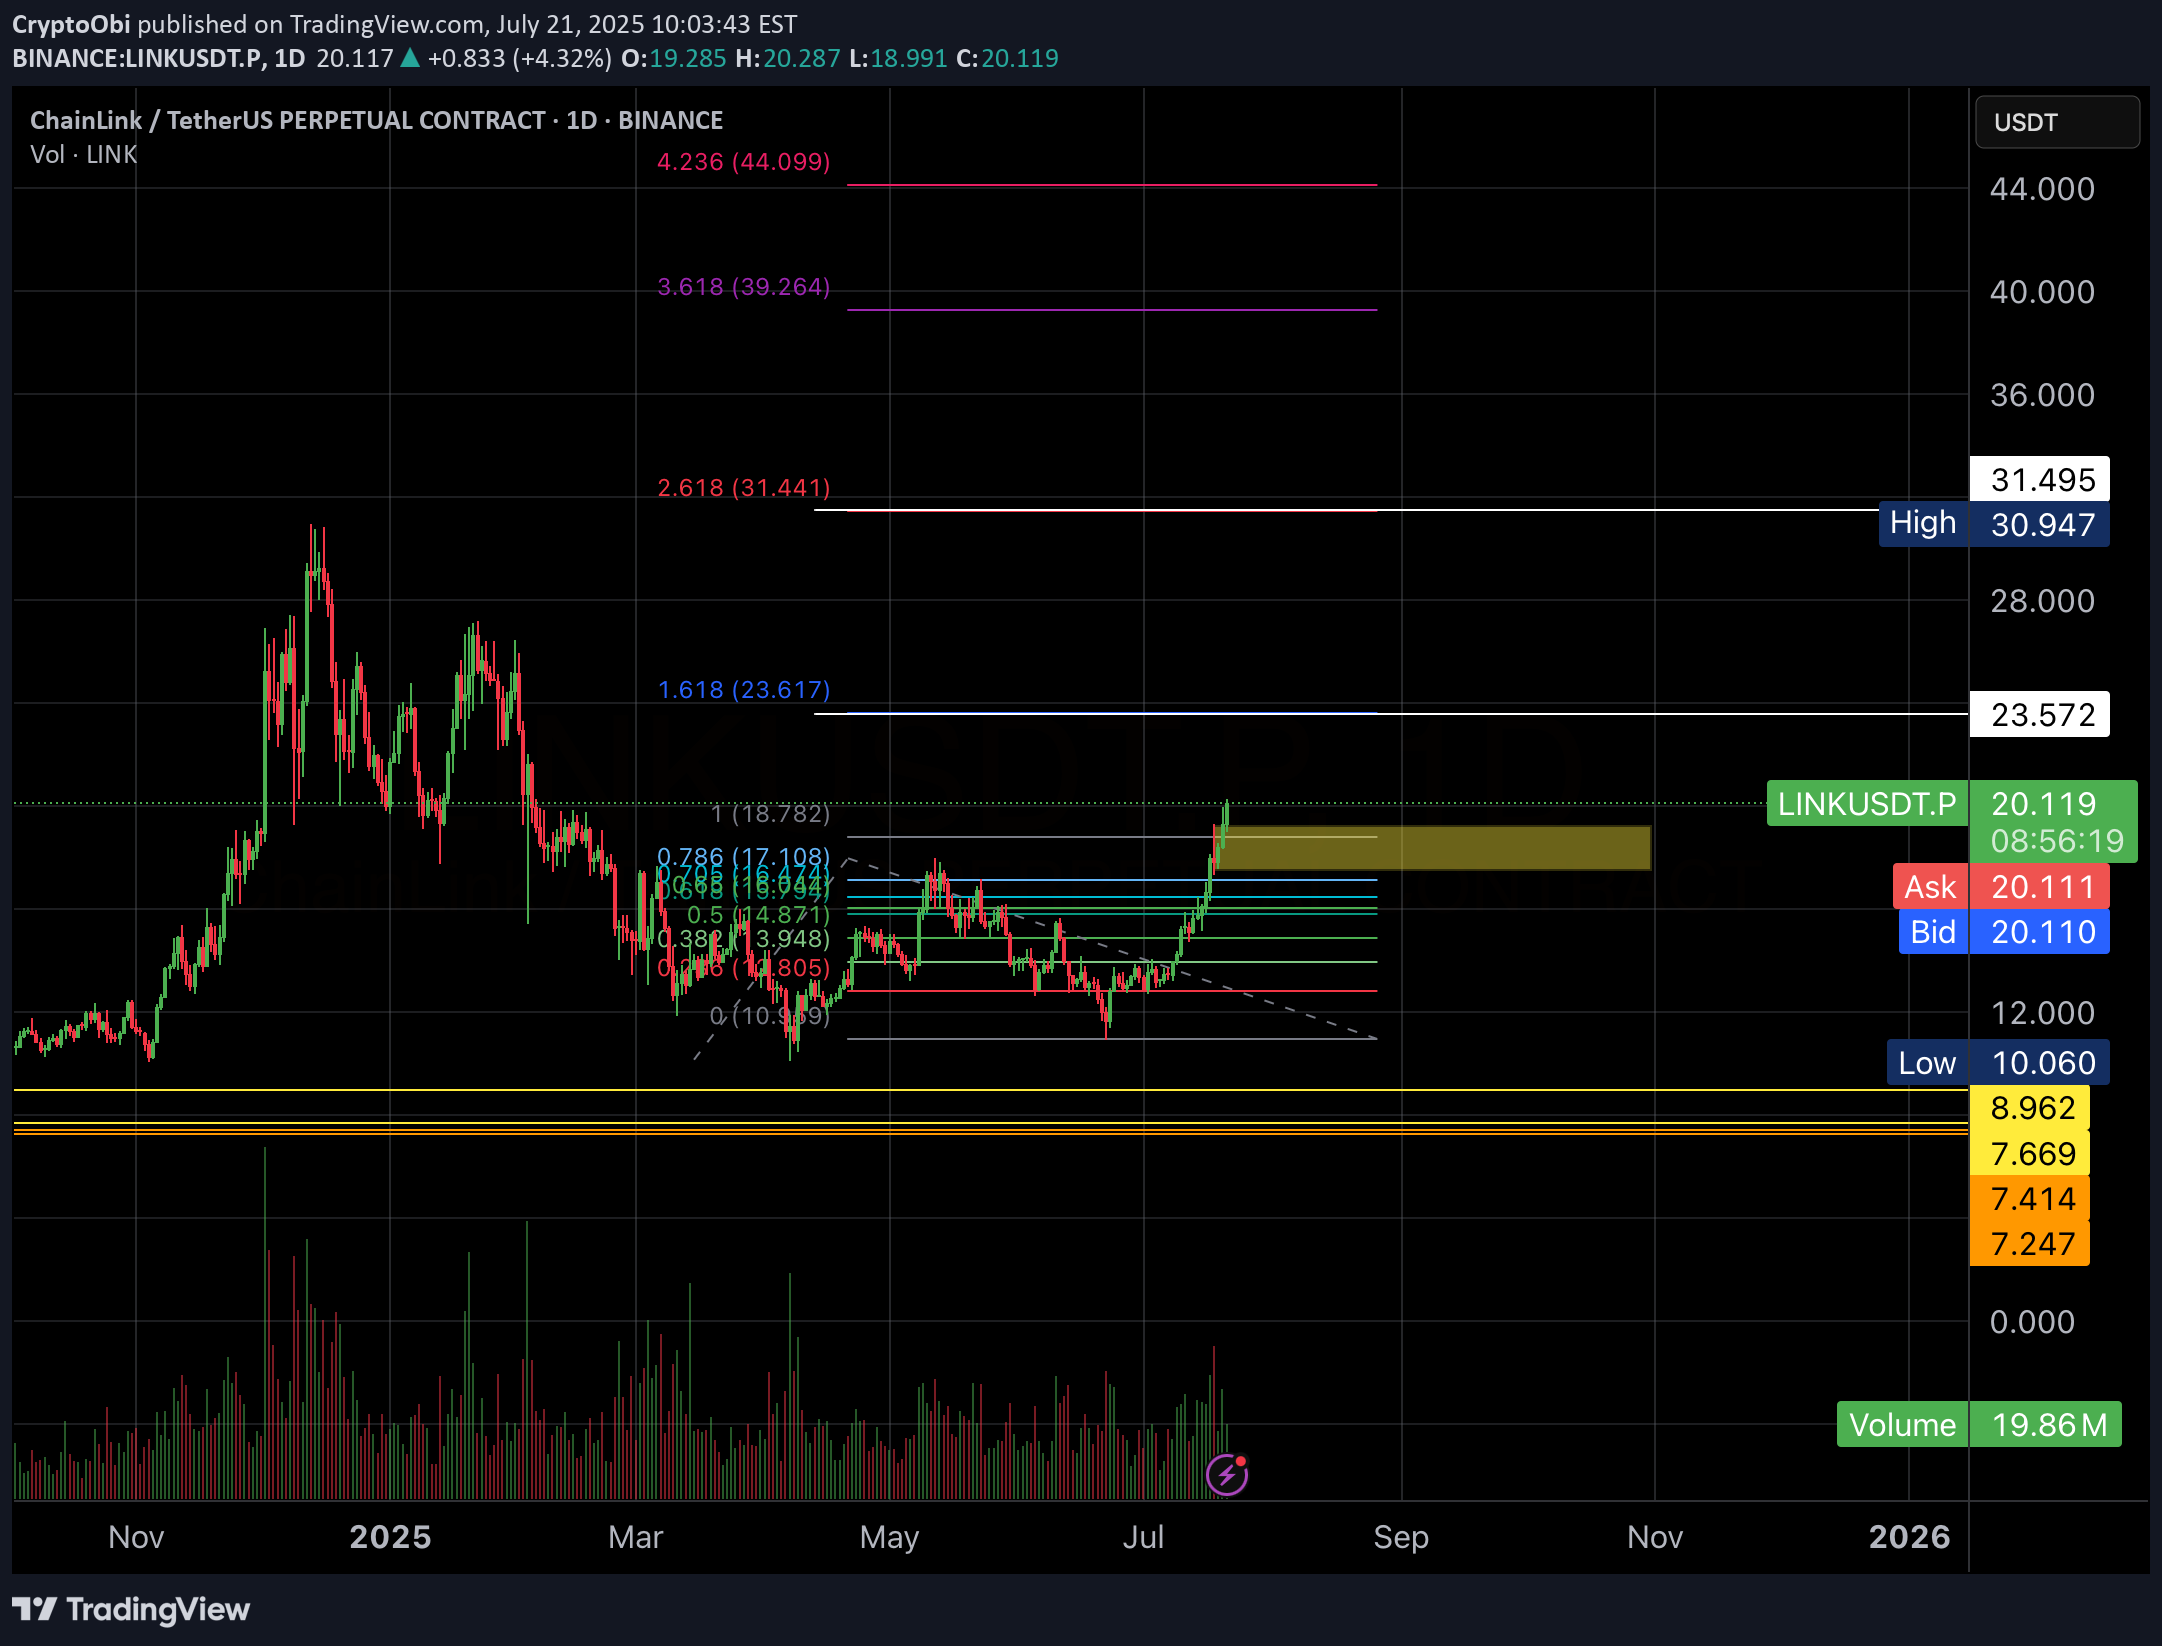
Hi Padawans, Hope you’re doing well. I’m anticipating some good short scalp opportunities around the levels marked in the chart. Do your own research padawans. Best regards, Crypto Obi
CryptoObi
#SOL for 367$?
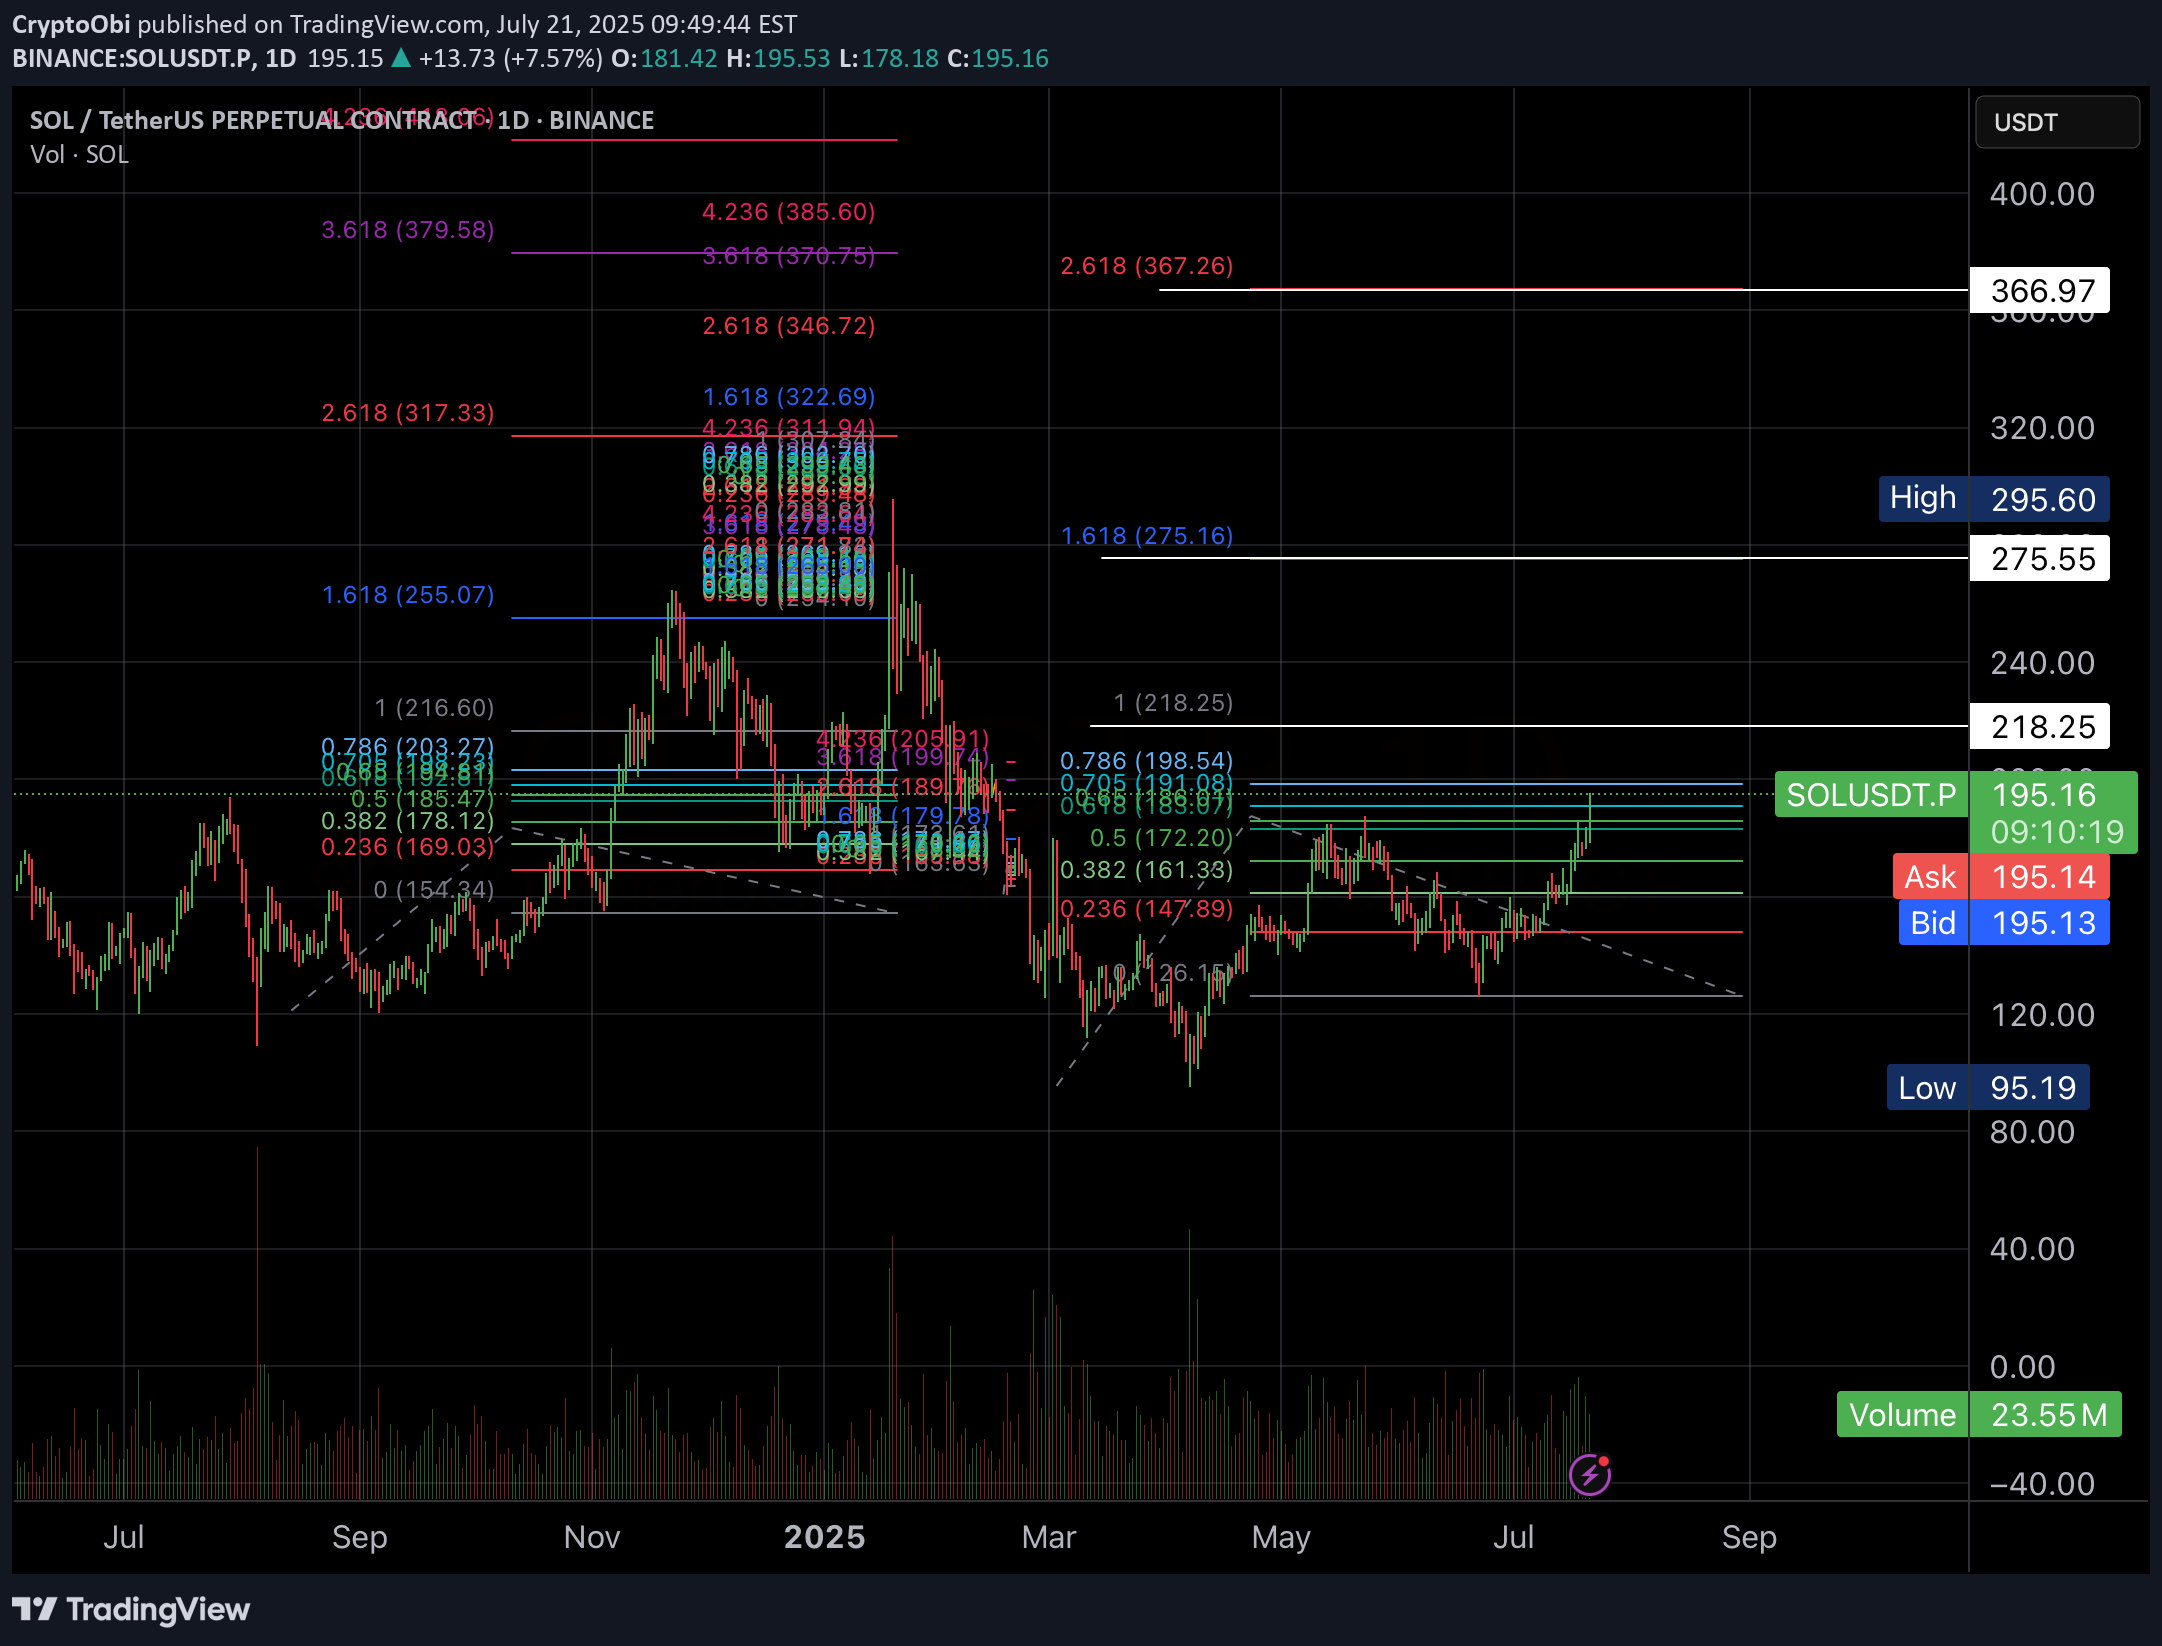
Hi Padawans, Hope you’re all doing well. The charts don’t lie — but remember, this isn’t financial advice. I’m currently eyeing long positions up to the levels highlighted in the chart. Best regards, CryptoObi
CryptoObi
CryptoObi
BTC to price exploring mode

Hi Padawas, What's happening? Cannot write more when charts speaks
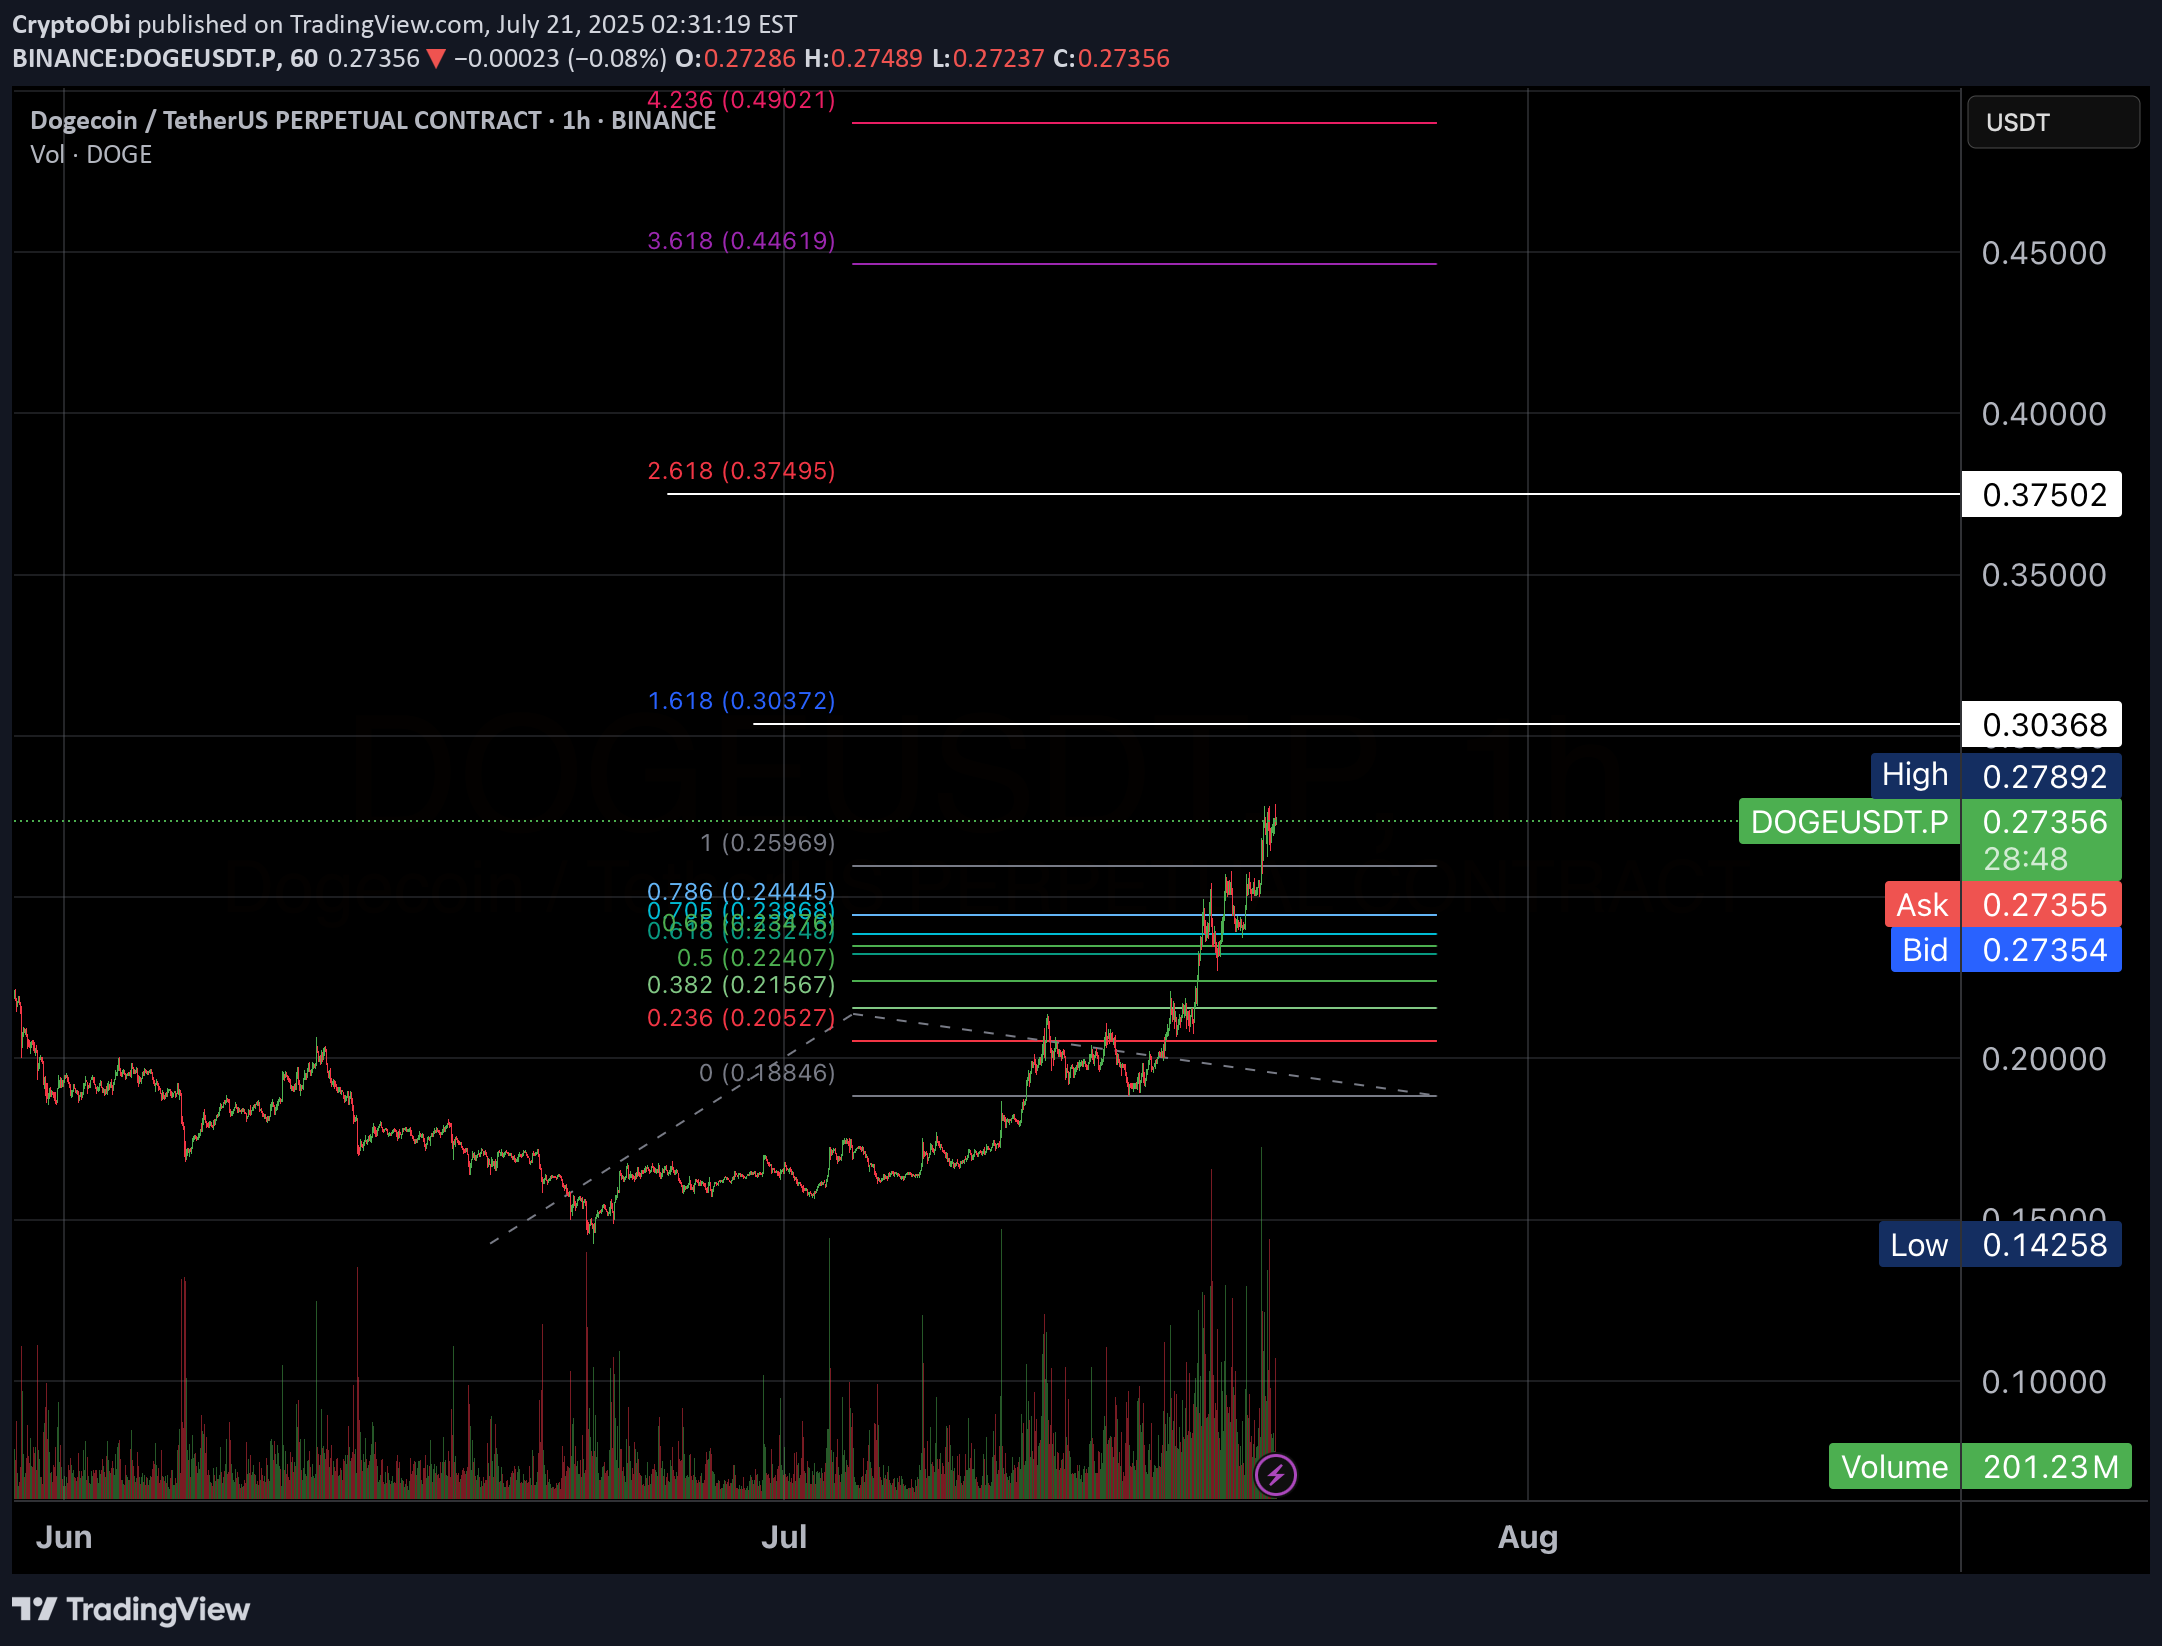
CryptoObi
Dogecoin (DOGE/USDT) Technical Analysis - February 2025

Overview: Dogecoin has shown a notable shift in its price dynamics, with significant retracements and key technical indicators suggesting potential upcoming moves. Analyzing the 4-hour chart on Binance, we observe critical support and resistance levels, along with key Fibonacci retracement zones. Price Action & Key Levels: Current Price: $0.24647 Key Support Levels: $0.24330 (1.618 Fib), $0.23188, $0.11269 Resistance Levels: $0.30 (psychological), $0.40, $0.48500 (recent high) The price is hovering near the 1.618 Fibonacci extension at $0.24330, acting as a critical support zone. A breakdown below this could push DOGE towards the next support at $0.23188 and potentially $0.14499 (2.618 Fib level). Indicators Analysis: MACD: The MACD line is slightly below the signal line with a histogram showing minimal bullish momentum. This indicates a potential for continued consolidation or bearish pressure unless a bullish crossover occurs. RSI: Currently at 37.85, the RSI indicates that DOGE is approaching the oversold territory. The RSI-based moving average at 38.72 suggests bearish sentiment but not yet in extreme conditions. Volume: A noticeable decrease in volume signals weakening buying interest, supporting the bearish outlook unless renewed demand emerges. Fibonacci Retracement Insights: The retracement from the recent high around $0.40236 shows DOGE struggling to maintain key Fibonacci levels. Failure to reclaim the 0.618 retracement zone could lead to deeper corrections towards the 2.618 and 3.618 extensions. Outlook & Trading Strategy: Bearish Scenario: A break below $0.24330 may trigger further declines towards $0.14499. Traders could consider short positions with tight stop losses above $0.25. Bullish Scenario: A rebound above $0.30 could reignite bullish momentum, targeting $0.40 and beyond. Conclusion: DOGE is at a crucial juncture. While bearish indicators dominate, the proximity to key support levels and oversold RSI conditions hint at a potential short-term bounce. Traders should monitor volume spikes and MACD crossovers for confirmation of trend reversals.
CryptoObi
Shorting Bitcoin at $105,000 would be an exciting play!

Hello Padawans, This chart shows a Bitcoin (BTC) price analysis with several Fibonacci retracement levels marked. Here are the key points in the image: 1. Price Levels and Fibonacci Extensions: - Key Fibonacci levels are drawn across the chart, including 0.236, 0.382, 0.5, 0.618, 0.786, and several extension levels (such as 1.618 and 2.618). - The 2.618 level, shown in red at around 104,827, represents a significant Fibonacci extension point, possibly indicating a strong resistance level for Bitcoin. 2. Price Action: - The Bitcoin price is currently at 75,050, as shown by the green label in the middle right of the chart. - The highest recent level on this chart is around 76,420, suggesting it might be a recent high or resistance level. 3. Volume Indicator: - A volume bar is visible at the bottom of the chart, indicating the trading activity, with recent volume levels shown around 30.106K. 4. Potential Resistance Levels: - There are several dashed lines indicating possible resistance levels, such as 82,800 and 87,216, with 104,827 being a significant upper target. This chart likely represents an analysis of potential retracement or resistance zones for a Bitcoin short or long setup around these key levels, with the 104,827 area being a focal point for a potential short opportunity if reached. Enjoy!
CryptoObi
Levels to watch if you are a GOLD Investor

Hello Padawans, Obi has returned! Please remember, I am not a financial advisor. Cheers, May the Force be with you.
Disclaimer
Any content and materials included in Sahmeto's website and official communication channels are a compilation of personal opinions and analyses and are not binding. They do not constitute any recommendation for buying, selling, entering or exiting the stock market and cryptocurrency market. Also, all news and analyses included in the website and channels are merely republished information from official and unofficial domestic and foreign sources, and it is obvious that users of the said content are responsible for following up and ensuring the authenticity and accuracy of the materials. Therefore, while disclaiming responsibility, it is declared that the responsibility for any decision-making, action, and potential profit and loss in the capital market and cryptocurrency market lies with the trader.