Technical analysis by CryptoObi about Symbol PAXG on 10/28/2025

CryptoObi
آیا قیمت طلا به ۴۵۰۰ دلار میرسد؟ تحلیل تکنیکال و پیشبینی حرکت بعدی XAUUSD
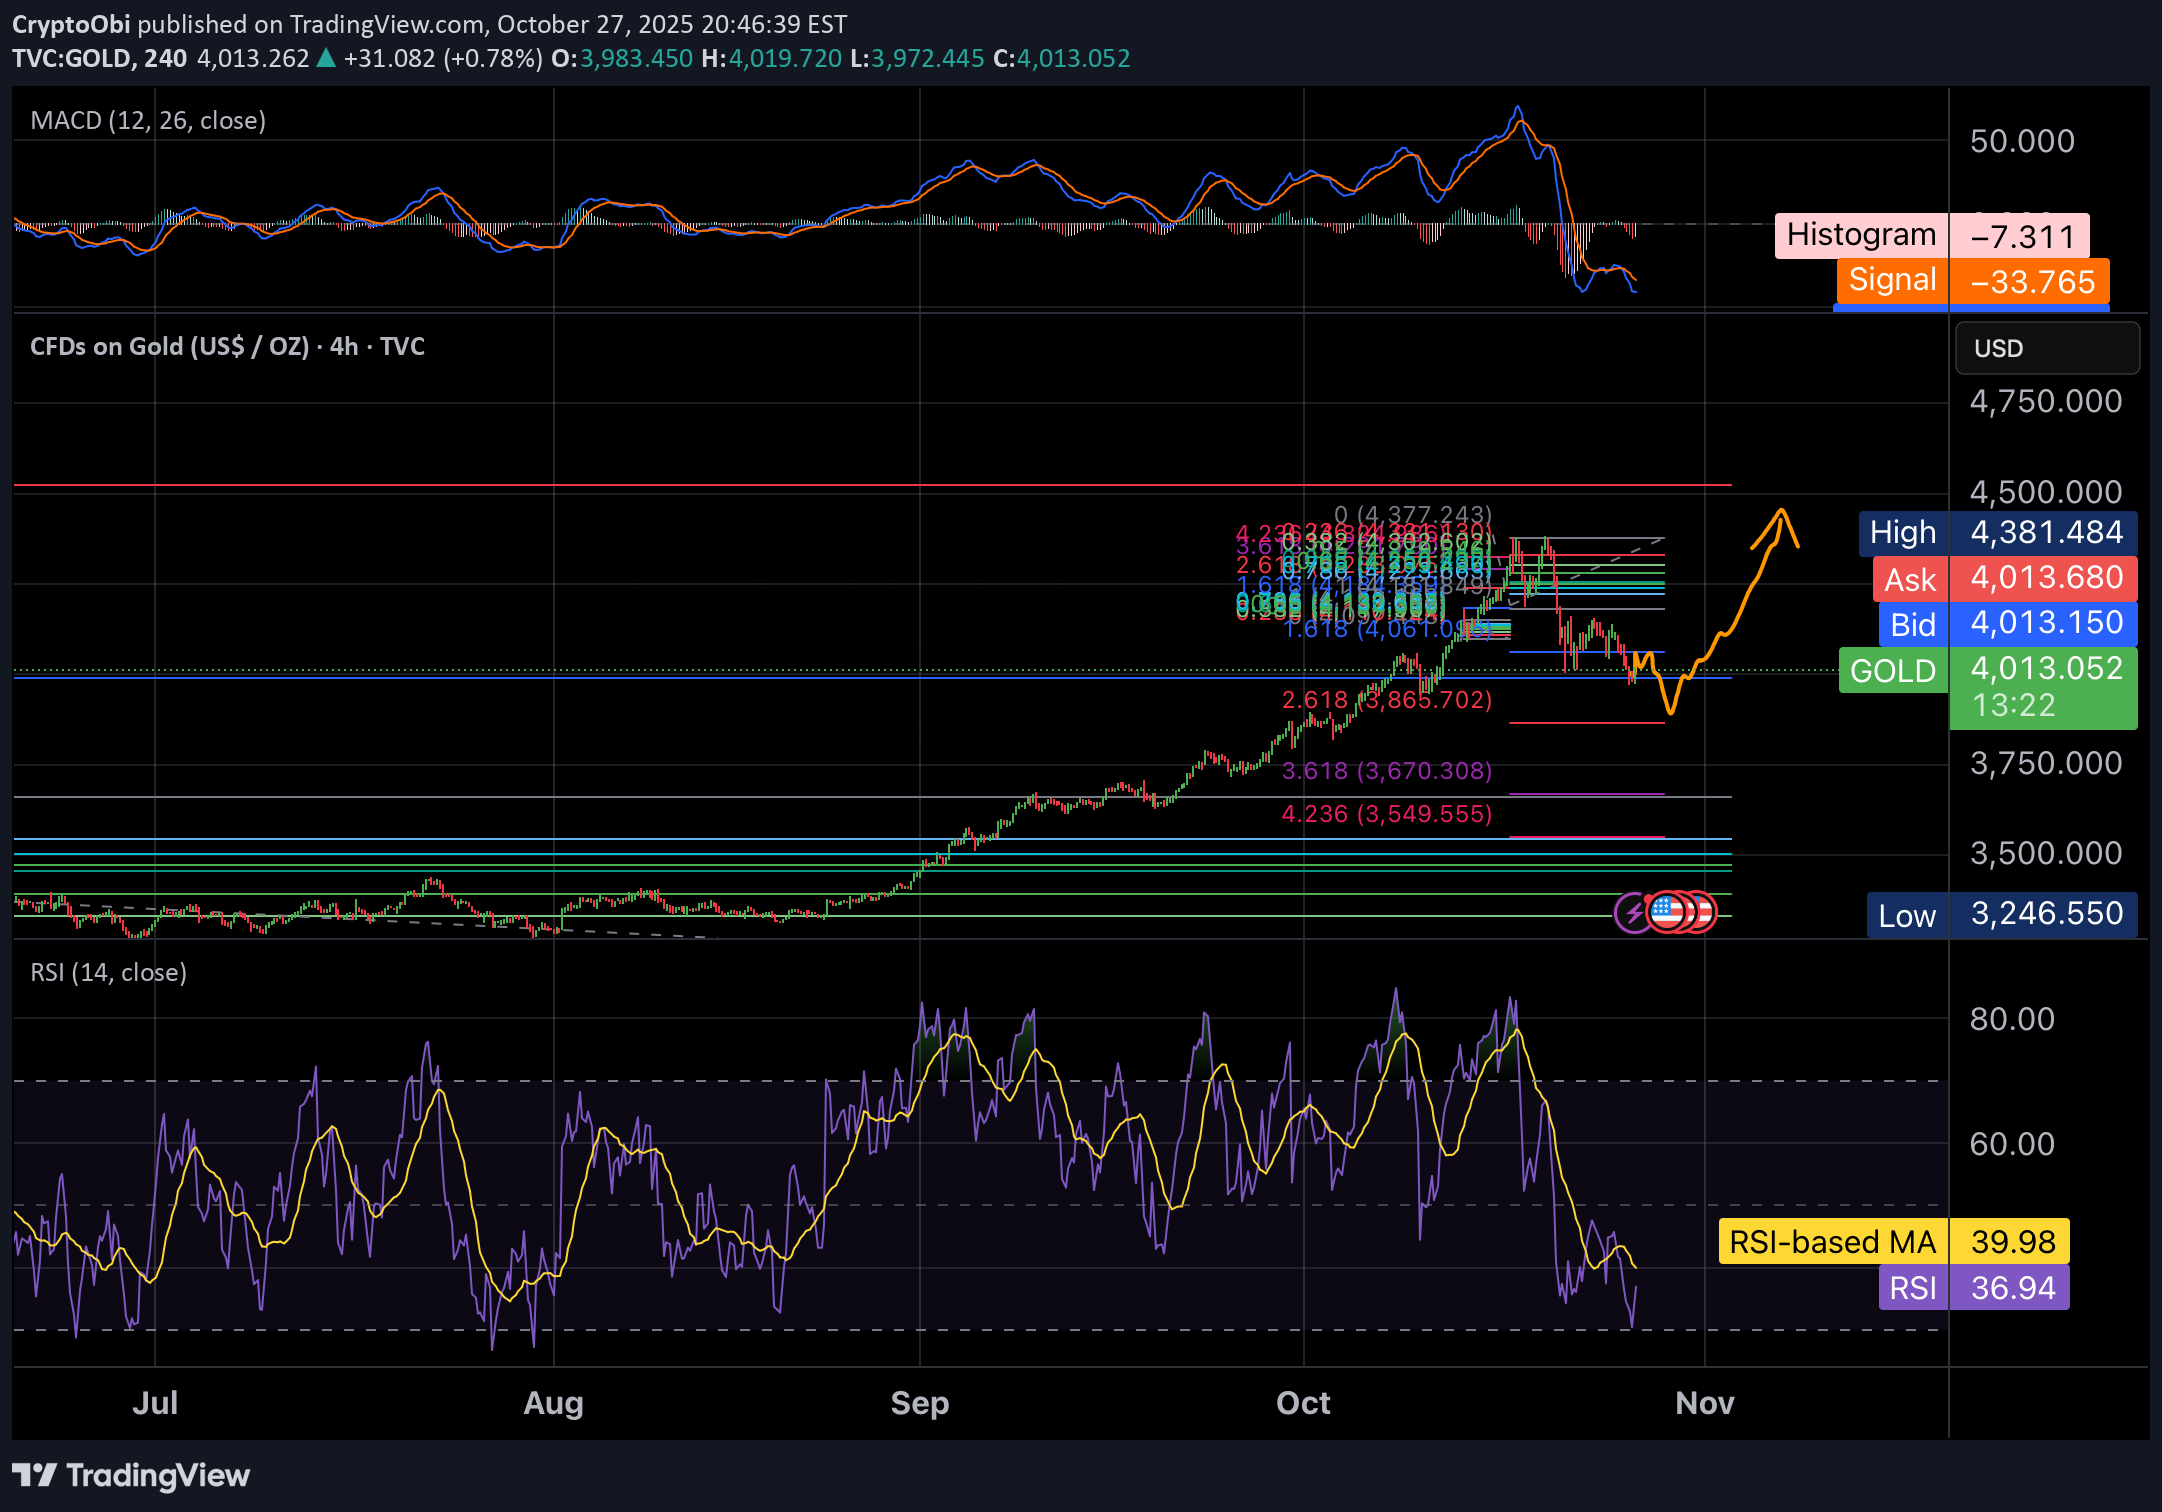
You’re looking at a 4-hour chart of Gold (XAUUSD) with a combination of Fibonacci extensions, RSI, and MACD indicators. 1. Price action & Fibonacci levels •Current price: around $4,008. •The chart shows retracement and extension levels, with key Fibonacci zones marked (0.618, 1.618, 2.618, etc.). •The price recently retraced to the 1.618 level (~$4,010) — a common Fibonacci support zone — and bounced slightly. •There’s also a 2.618 extension at $3,865, suggesting that if $4,000 fails as support, the next downside target could be around $3,865. 2. MACD (top indicator) •MACD Line (blue) is well below the Signal Line (orange) → strong bearish momentum. •Histogram is negative (–7.643), confirming the bearish trend. •However, the histogram bars are starting to shrink, which can often signal bearish exhaustion or a potential bullish reversal coming. 3. RSI (bottom indicator) •RSI = 35.93, with the RSI-based MA at 39.91. •This means Gold is nearing oversold territory (below 30) — it’s not extreme yet, but buyers might soon step in. •If RSI turns up and crosses the MA, it could confirm the beginning of a short-term reversal. 4. Projected path (orange line on chart) •The drawn orange curve shows a possible bounce scenario: •Gold could dip slightly below $4,000 or test $3,865 (2.618 level), •then begin a gradual recovery toward $4,380–$4,400. •That’s in line with a Fibonacci retracement to 1.0–1.618 area — a common recovery zone after a sharp drop. 5. Summary IndicatorCurrent BiasSignal Price ActionSlightly BearishApproaching support zone FibonacciKey support at $4,000, next at $3,865Possible bounce MACDBearish but flatteningEarly reversal potential RSINear oversoldCould trigger rebound soon Quick Take: Gold might dip slightly lower (possibly to $3,865), but technicals suggest a bullish reversal may follow in early November, targeting the $4,380–$4,400 area.