
CryptoFiboTrends
@t_CryptoFiboTrends

What symbols does the trader recommend buying?
Purchase History
پیام های تریدر
Filter
CryptoFiboTrends
فشار نزولی هدرا (HBAR): حمایت حیاتی در خطر است؛ سقوط یا جهش؟
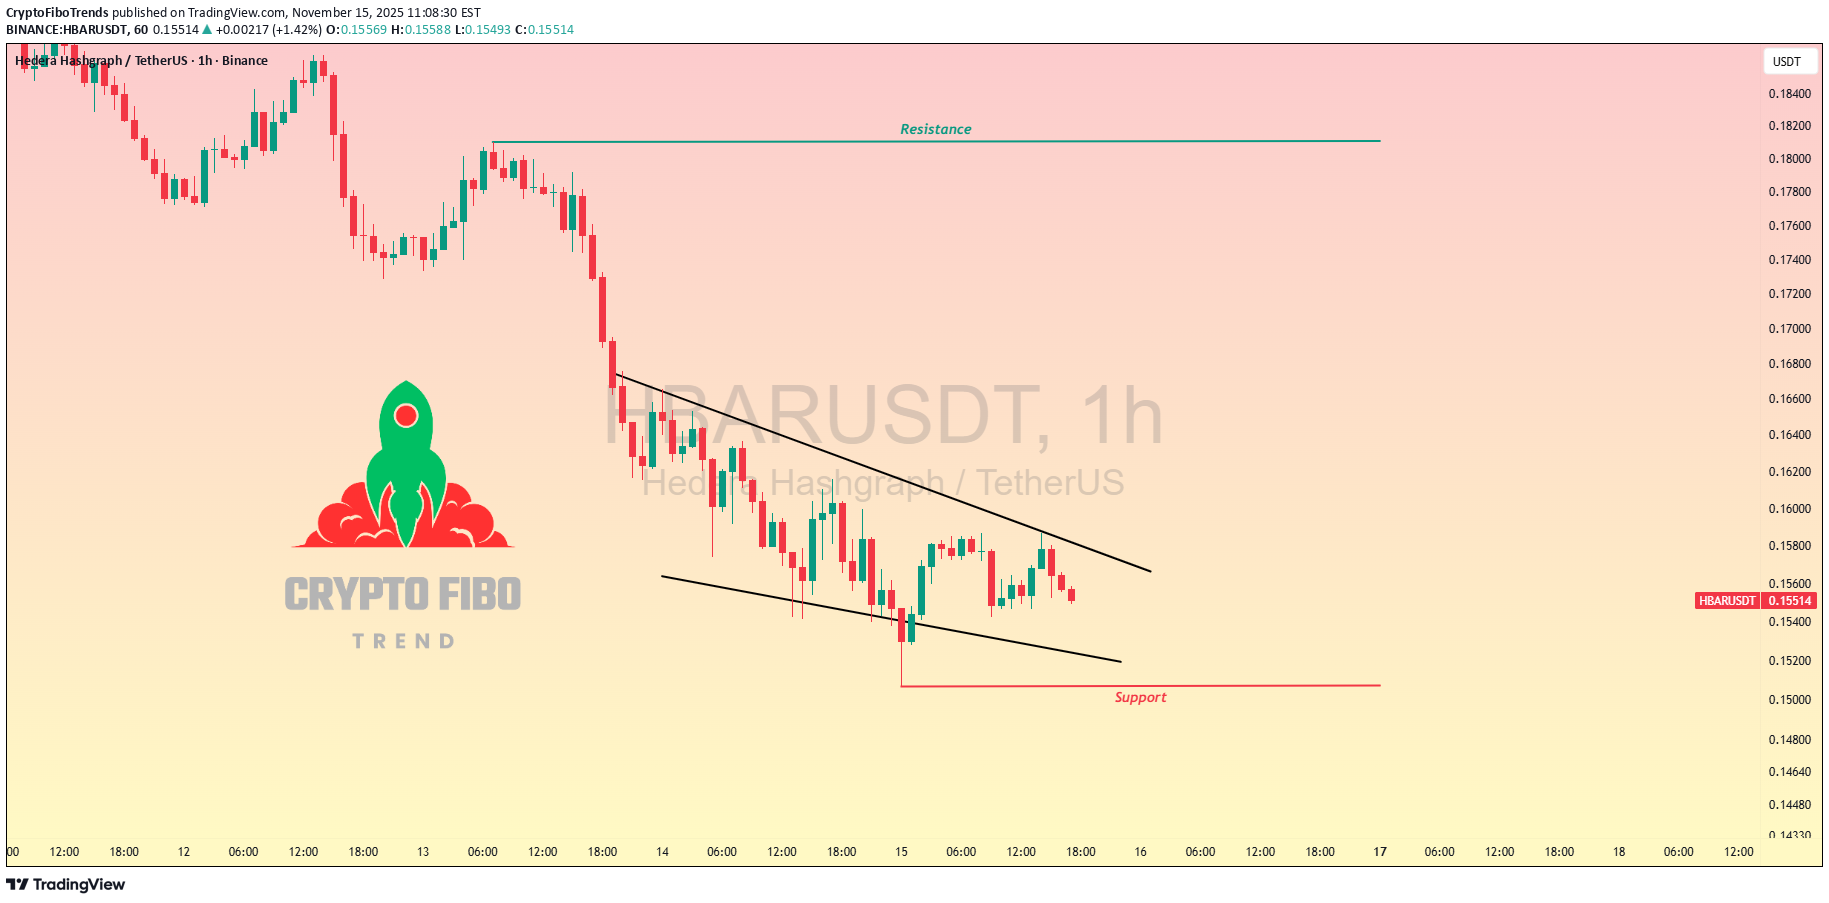
HBARUSDT HBAR Bearish Pressure Tests Crucial Support – Dip or Bounce Ahead? HBAR's 1H chart screams bearish vibes 📉, down ~6% in 24h to ~0.155 USDT, hugging major support at 0.155. It might hold for a quick bounce to 0.16-0.17 target if RSI stays oversold, but watch for deeper dip risk to 0.14 on break—no breakout above 0.18 resistance soon. Tracking 50 EMA crossover & volume spikes. Stay cautious! 🔴⚠️ #HBAR #CryptoTrends #AltcoinAnalysis
CryptoFiboTrends
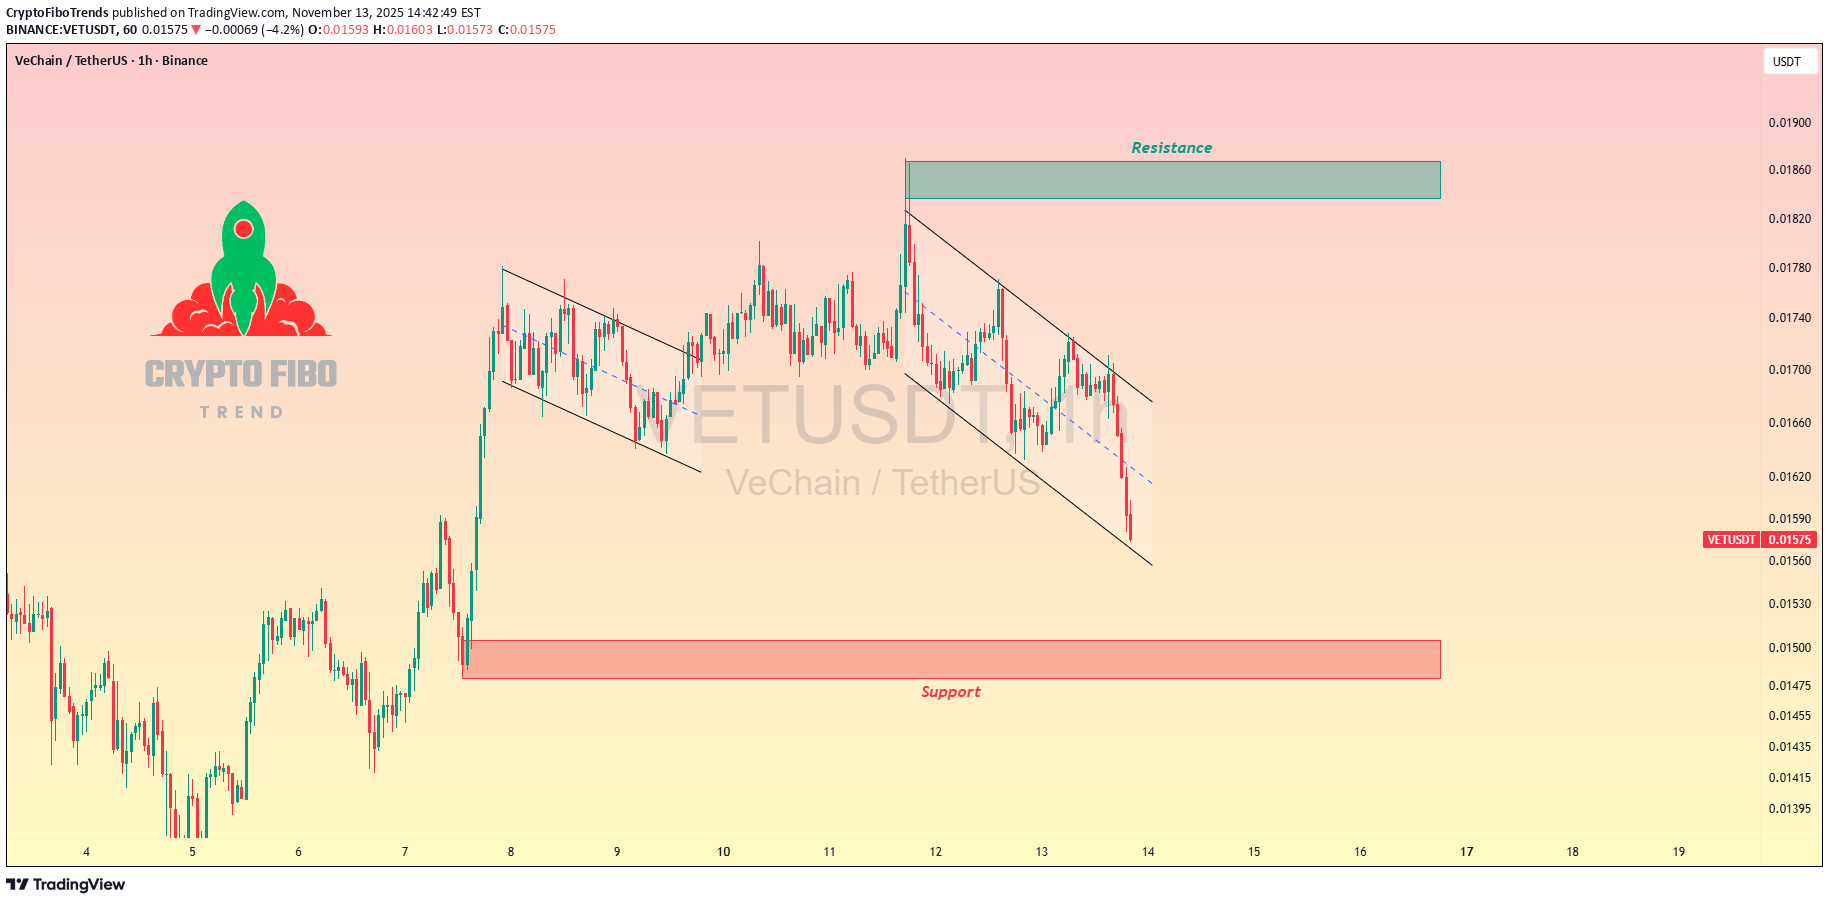
آیا حمایت VET در حال محکم شدن است؟ راز خروج از کانال نزولی!

VETUSDT VET Channel Fade – Support Test Tightens? Current trend: VET's in a persistent descending channel from 0.021 highs, now probing 0.0147 support after capping resistance—sellers grinding lower, but doji indecision hints at buyer ambush brewing 🛡️. Hold support? Likely yes; EMA confluence and volume dry-up could flip momentum for quick relief. Breakout above resistance? Bullish trigger over 0.019 close—potential 5-7% surge to 0.0205 on alt rotation 🚀. Dip risk? Moderate to 0.014 on crack, amplified by BTC correlation. Target: Upside 0.018 short-term; downside 0.0135 buffer. Indicators tracking: RSI (34, oversold zone), Channel lower bound, and MACD crossover watch 📊. #VETTrading #CryptoChannel #FiboTrendCrypto
CryptoFiboTrends
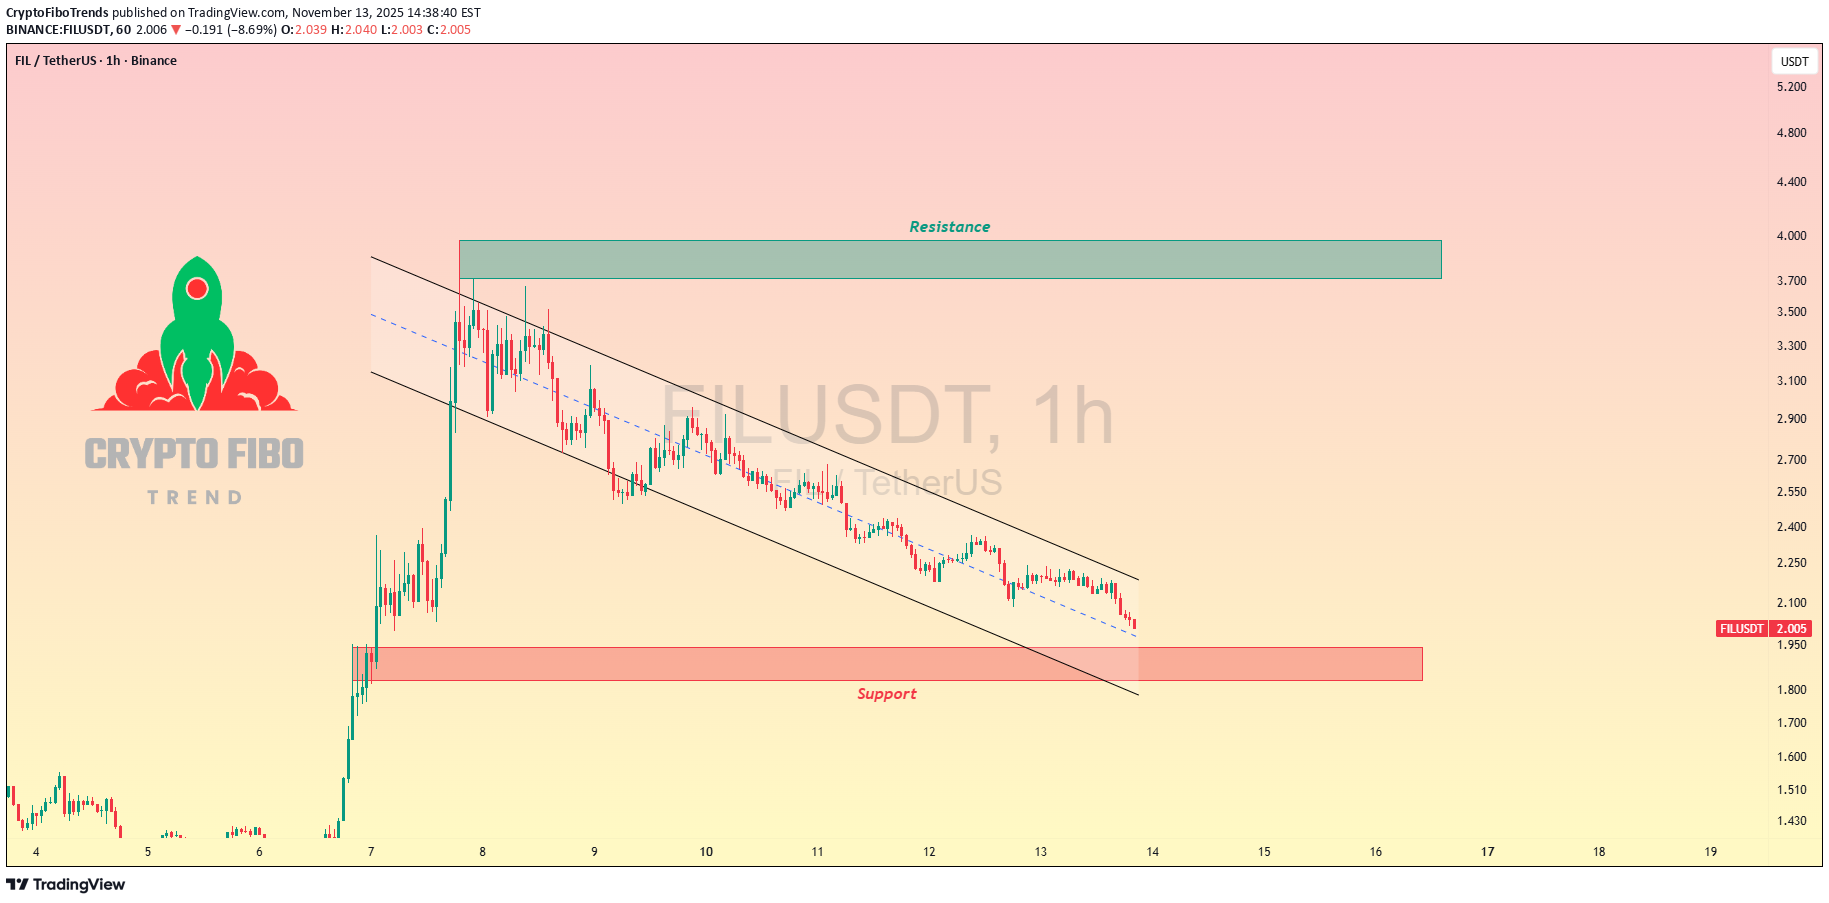
نبرد حیاتی فایل کوین (FIL) در آستانه فروپاشی؛ آیا کف حمایتی دوام میآورد؟

FILUSDT FIL Trendline Siege – Support Battle Rages? Current trend: FIL's in a steep channel descent from 5.5K highs, now scraping 1.96 support after sharp rejection—sellers relentless, but volume taper hints at capitulation nearing 🛡️. Hold support? Even odds yes; prior lows and EMA confluence could mount defense for quick snapback. Breakout above resistance? Setup if 2.50 closes above trendline—potential 6-8% rally to 2.70 on BTC mercy 🚀. Dip risk? Elevated to 1.80 on crack, liquidation clusters waiting to ignite. Target: Upside 2.30 on hold; downside 1.85 buffer. Indicators tracking: RSI (26, ultra-oversold), Trendline violation watch, MACD death cross 📉. #FILTrading #CryptoDip #FiboTrendCrypto
CryptoFiboTrends
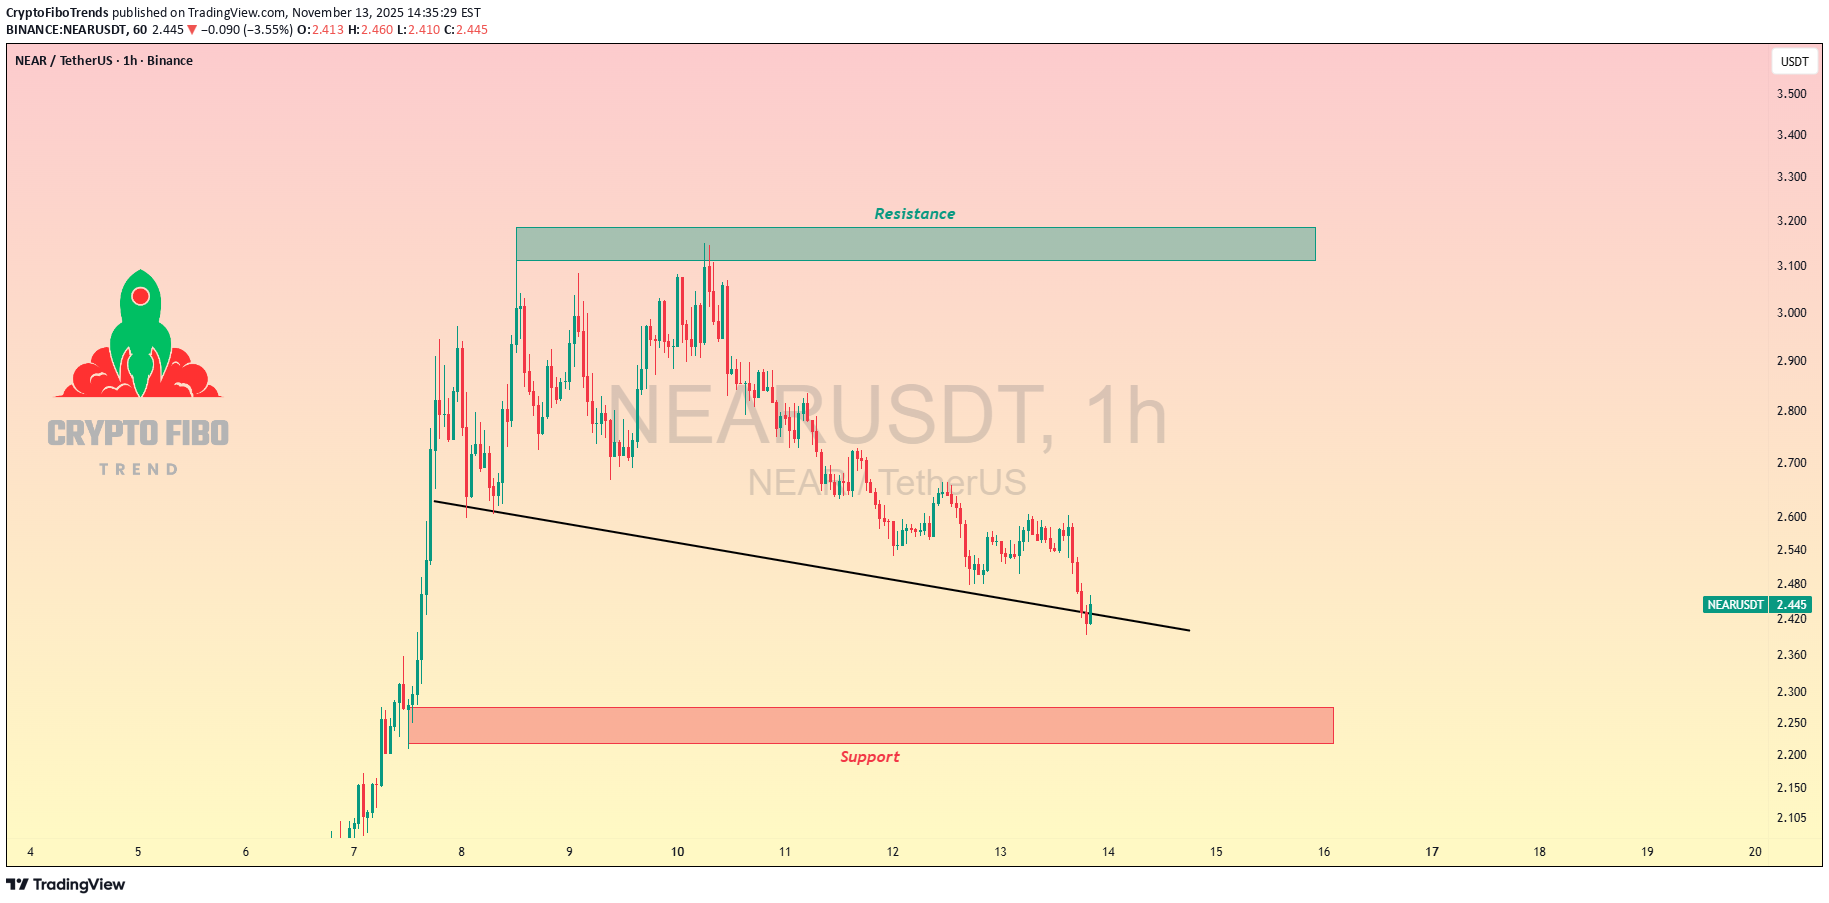
فشردگی حمایتی NEAR: آیا قیمت بازمیگردد یا سقوط میکند؟

NEARUSDT NEAR Support Squeeze – Reversal or Rejection? Current trend: NEAR's pinned at the 2.39 support in a bearish channel descent from 3.5 highs—wicks absorbing sells, volume thinning for potential alt relief rally 🛡️. Hold support? Strong yes; EMA confluence and prior lows scream buyer defense, low risk of immediate crack. Breakout above resistance? Imminent if 3.0 closes above—could rocket 8-10% to 3.20 on BTC bounce 🚀. Dip risk? Mild to 2.30 if macro weighs, but oversold prevents deep flush. Target: Upside 2.80 short-term; downside 2.25 buffer. Indicators tracking: RSI (28, oversold alert), Channel lower bound, MACD divergence 📊. #NEARTrading #CryptoSupport #FiboTrendCrypto
CryptoFiboTrends
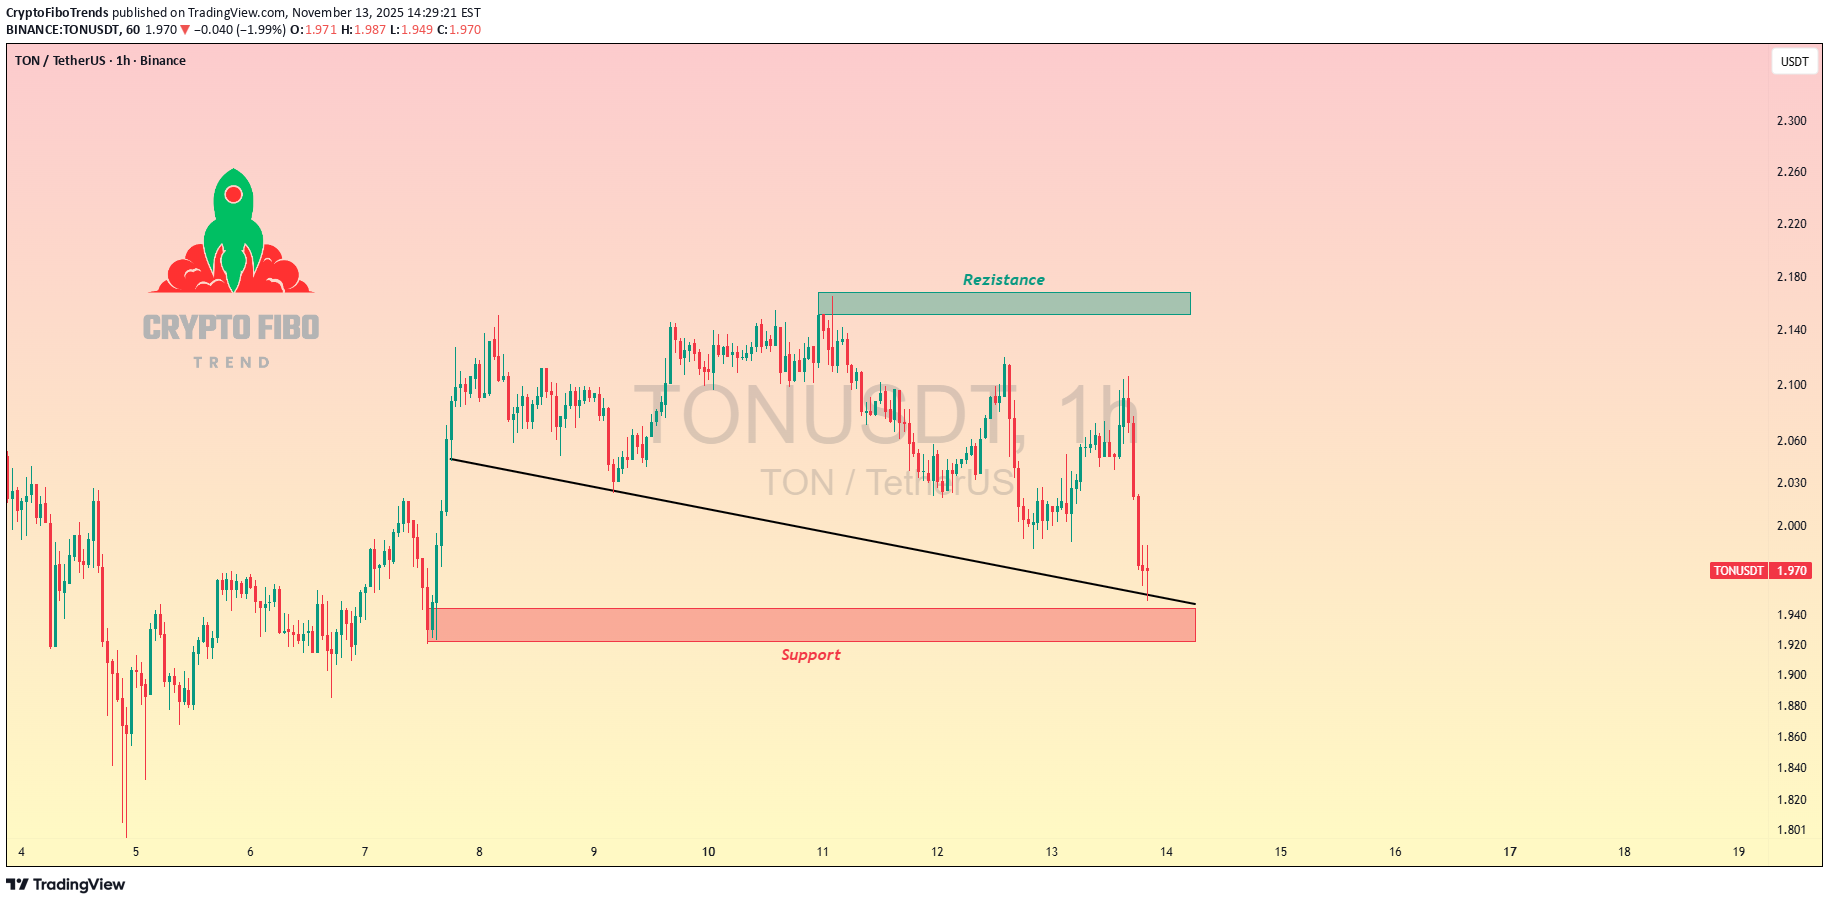
تحلیل تکنیکال TON: خط روند حیاتی است؛ آیا حمایت حفظ میشود یا ریزش ادامه دارد؟
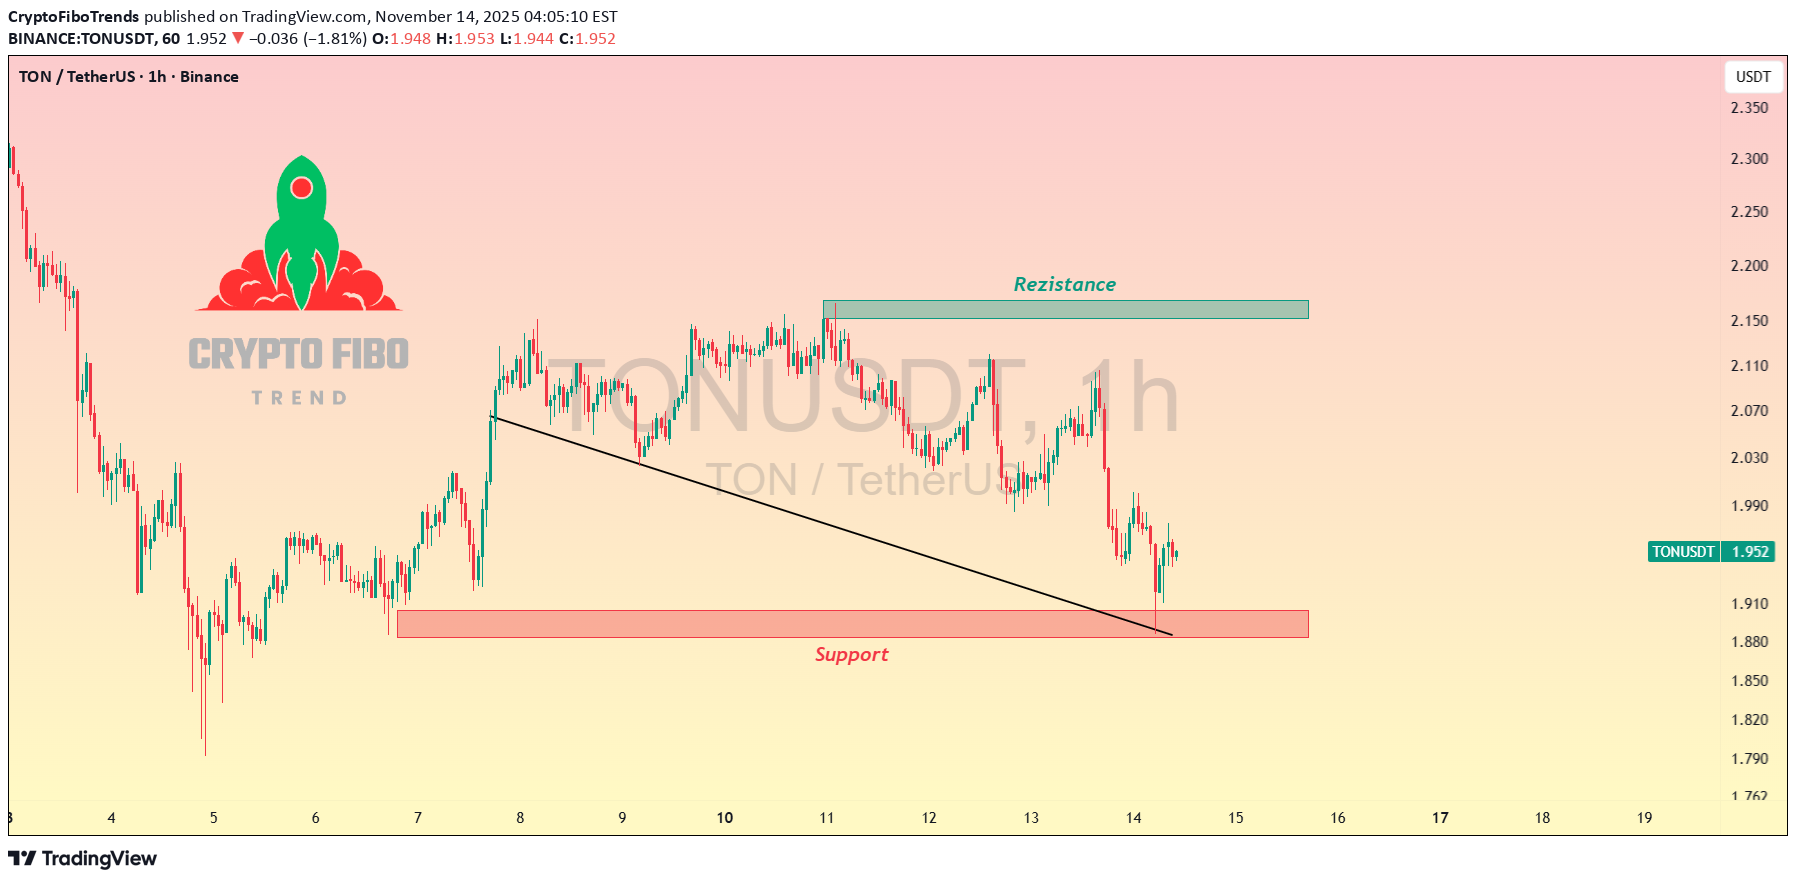
TONUSDT TON Trendline Probe – Support Hold or Further Fade? Current trend: TON's grinding along the descending trendline from 2.50 peaks, now hugging 1.90 support amid alt bleed—sellers probing, but low-volume wicks signal potential buyer trap 🛡️. Hold support? Yes probable; EMA stack and prior lows confluence could spark a clean rejection. Breakout above resistance? Bullish if 2.30 clears on close—unleashing 5-7% rally to trendline top 🚀. Dip risk? Moderate to 1.85 on breach, tied to BTC drag. Target: Short-term 2.10 bounce; downside 1.80 buffer. Indicators tracking: RSI (42, neutral zone), Trendline slope, and MACD histogram fade 📊. #TONTrading #CryptoSupport #FiboTrendCrypto
CryptoFiboTrends
هشدار سقوط هدرا (HBAR): آیا خط روند شکسته شد؟ تست وحشتناک حمایت!
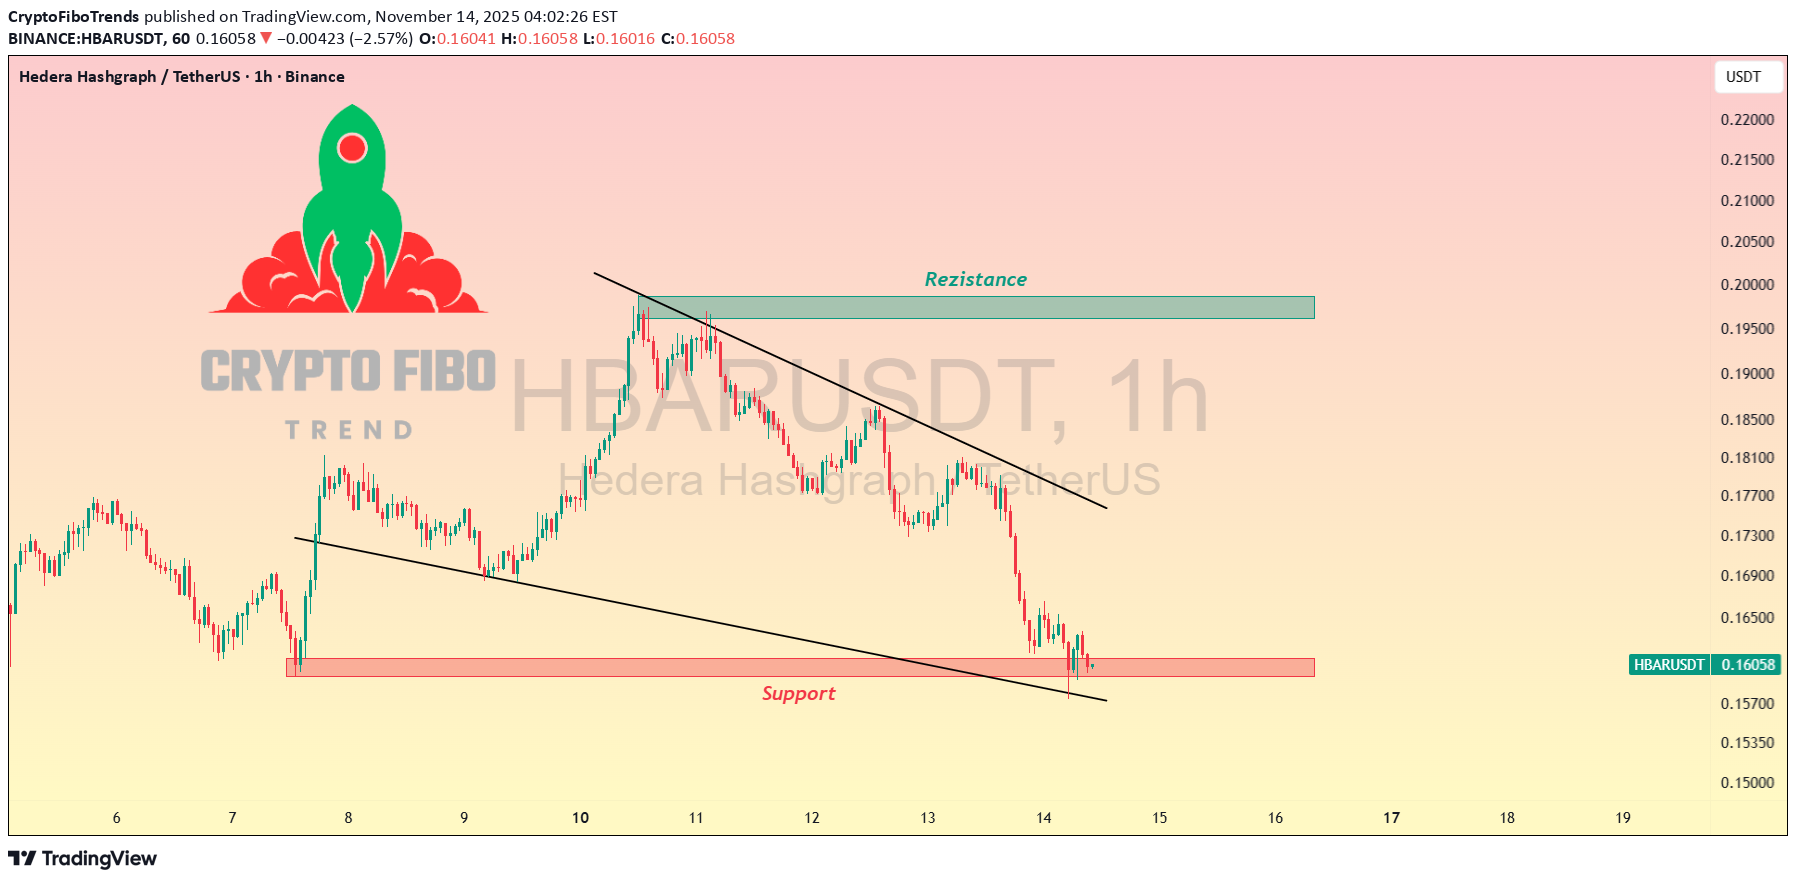
HBARUSDT HBAR Trendline Breach – Support Panic Test? Current trend: HBAR's broken below the descending trendline from 0.23 peaks, now slamming the 0.166 support amid BTC flush—aggressive sells, but hammer wicks hint at exhaustion 🛡️. Hold support? 50/50 call; volume spike on dip could flush further, or buyers defend for V-reversal if RSI bounces. Breakout above resistance? Remote without 0.20 reclaim—needs macro lift for any upside flip 🚀. Dip risk? High to 0.15 on crack, liquidation fuel adding speed. Target: Downside 0.16 test; rebound cap 0.18 if holds. Indicators tracking: RSI (22, ultra-oversold), Trendline violation, and MACD death cross 📉. #HBARTrading #CryptoDip #AltcoinPioneers
CryptoFiboTrends
نبرد حمایت و مقاومت در نمودار VET: آیا وقت انفجار قیمت فرا رسیده است؟
VETUSDT VET VeChain Channel Squeeze – Support Battle? Current trend: VET's coiling in a narrowing descending channel, defending the 0.015 support after capping 0.019 resistance—fading downside volume hints at bullish divergence brewing 🛡️. Hold support? Solid yes; prior bounces and trendline confluence could fuel a clean rejection. Breakout above resistance? Imminent on 0.019 close—unlocking 6-8% pop toward channel extension 🚀. Dip risk? Mild to 0.0145 if weakens, but oversold metrics limit it. Target: Short-term 0.020 on flip; stretch 0.022 with conviction. Indicators tracking: RSI (36, rebound zone), Channel convergence, and MACD histogram lift 📊. #VETTrading #CryptoChannel #FiboTrendCrypto
CryptoFiboTrends
تحلیل فیلی کوین (FIL): حمایت ۱.۹۵ حفظ میشود یا سقوط در کانال نزولی ادامه دارد؟
FILUSDT FIL Trendline Test – Support Hold or Channel Break? Current trend: FIL's in a steep descending channel, slamming into the 1.95 support after rejection from 5.20 resistance—volume spike on the dip shows buyers scrambling 🛡️. Hold support? Probable yes; channel base and prior lows aligning for a potential hammer bounce. Breakout above resistance? Tough without 5.20 clear—needs strong close for 6-8% reversal pump 🚀. Dip risk? High to 1.80 if breaches, accelerating the downtrend. Target: Rebound to 2.30 on defense; downside 1.70 floor. Indicators tracking: RSI (29, extreme oversold), Trendline slope, and MACD divergence 📉. #FILTrading #CryptoChannel #FiboTrendCrypto
CryptoFiboTrends
آیا کف حمایتی NEAR در کانال نزولی میشکند؟ پیشبینی قیمت و نقاط کلیدی خرید و فروش
NEARUSDT NEAR Channel Descent – Support Crucial? Current trend: NEAR's sliding in a bearish channel, hugging the 2.36 support after capping 3.50 resistance—volume taper on downside suggests fading seller power 🛡️. Hold support? High probability yes; prior bounces and channel floor confluence could ignite reversal if holds. Breakout above resistance? Needs 3.50 close for bull flip—potential 8-10% rally to channel upper 🚀. Dip risk? Real to 2.20 if breaches, amplified by BTC correlation. Target: Bounce to 2.80 short-term; downside 2.15 buffer. Indicators watching: RSI (35, oversold alert), Trendline slope, and MACD crossover 📉. #NEARTrading #CryptoChannel #FiboTrendCrypto
CryptoFiboTrends
فشار فروش تون (TON): آیا خط حمایت جان او را نجات میدهد؟
TONUSDT TON Downtrend Pressure – Support Lifeline? Current trend: TON's riding a descending channel, bouncing off the 1.84 support after capping at 2.36 resistance—fading volume on reds points to weakening bear control 🛡️. Hold support? Yes likely; hammer patterns and channel base confluence drawing buyers for a potential stall. Breakout above resistance? Setup for 2.36 flip on strong close—could propel 7-9% upside to channel top 🚀. Dip risk? Moderate to 1.80 if trendline accelerates, but oversold signals curb it. Target: Rebound to 2.20 short-term; deeper 2.40 on momentum. Indicators tracking: RSI (42, neutral bounce zone), Channel slope for breaks, and VWAP pivot 📉. #TONTrading #CryptoChannel #FiboTrendCrypto
Disclaimer
Any content and materials included in Sahmeto's website and official communication channels are a compilation of personal opinions and analyses and are not binding. They do not constitute any recommendation for buying, selling, entering or exiting the stock market and cryptocurrency market. Also, all news and analyses included in the website and channels are merely republished information from official and unofficial domestic and foreign sources, and it is obvious that users of the said content are responsible for following up and ensuring the authenticity and accuracy of the materials. Therefore, while disclaiming responsibility, it is declared that the responsibility for any decision-making, action, and potential profit and loss in the capital market and cryptocurrency market lies with the trader.