
CryptoCheck-
@t_CryptoCheck-

What symbols does the trader recommend buying?
Purchase History
پیام های تریدر
Filter
CryptoCheck-
CryptoCheck-
XAUUSD | UNPRESIDENTED GOLD RALLY : Where to Next?
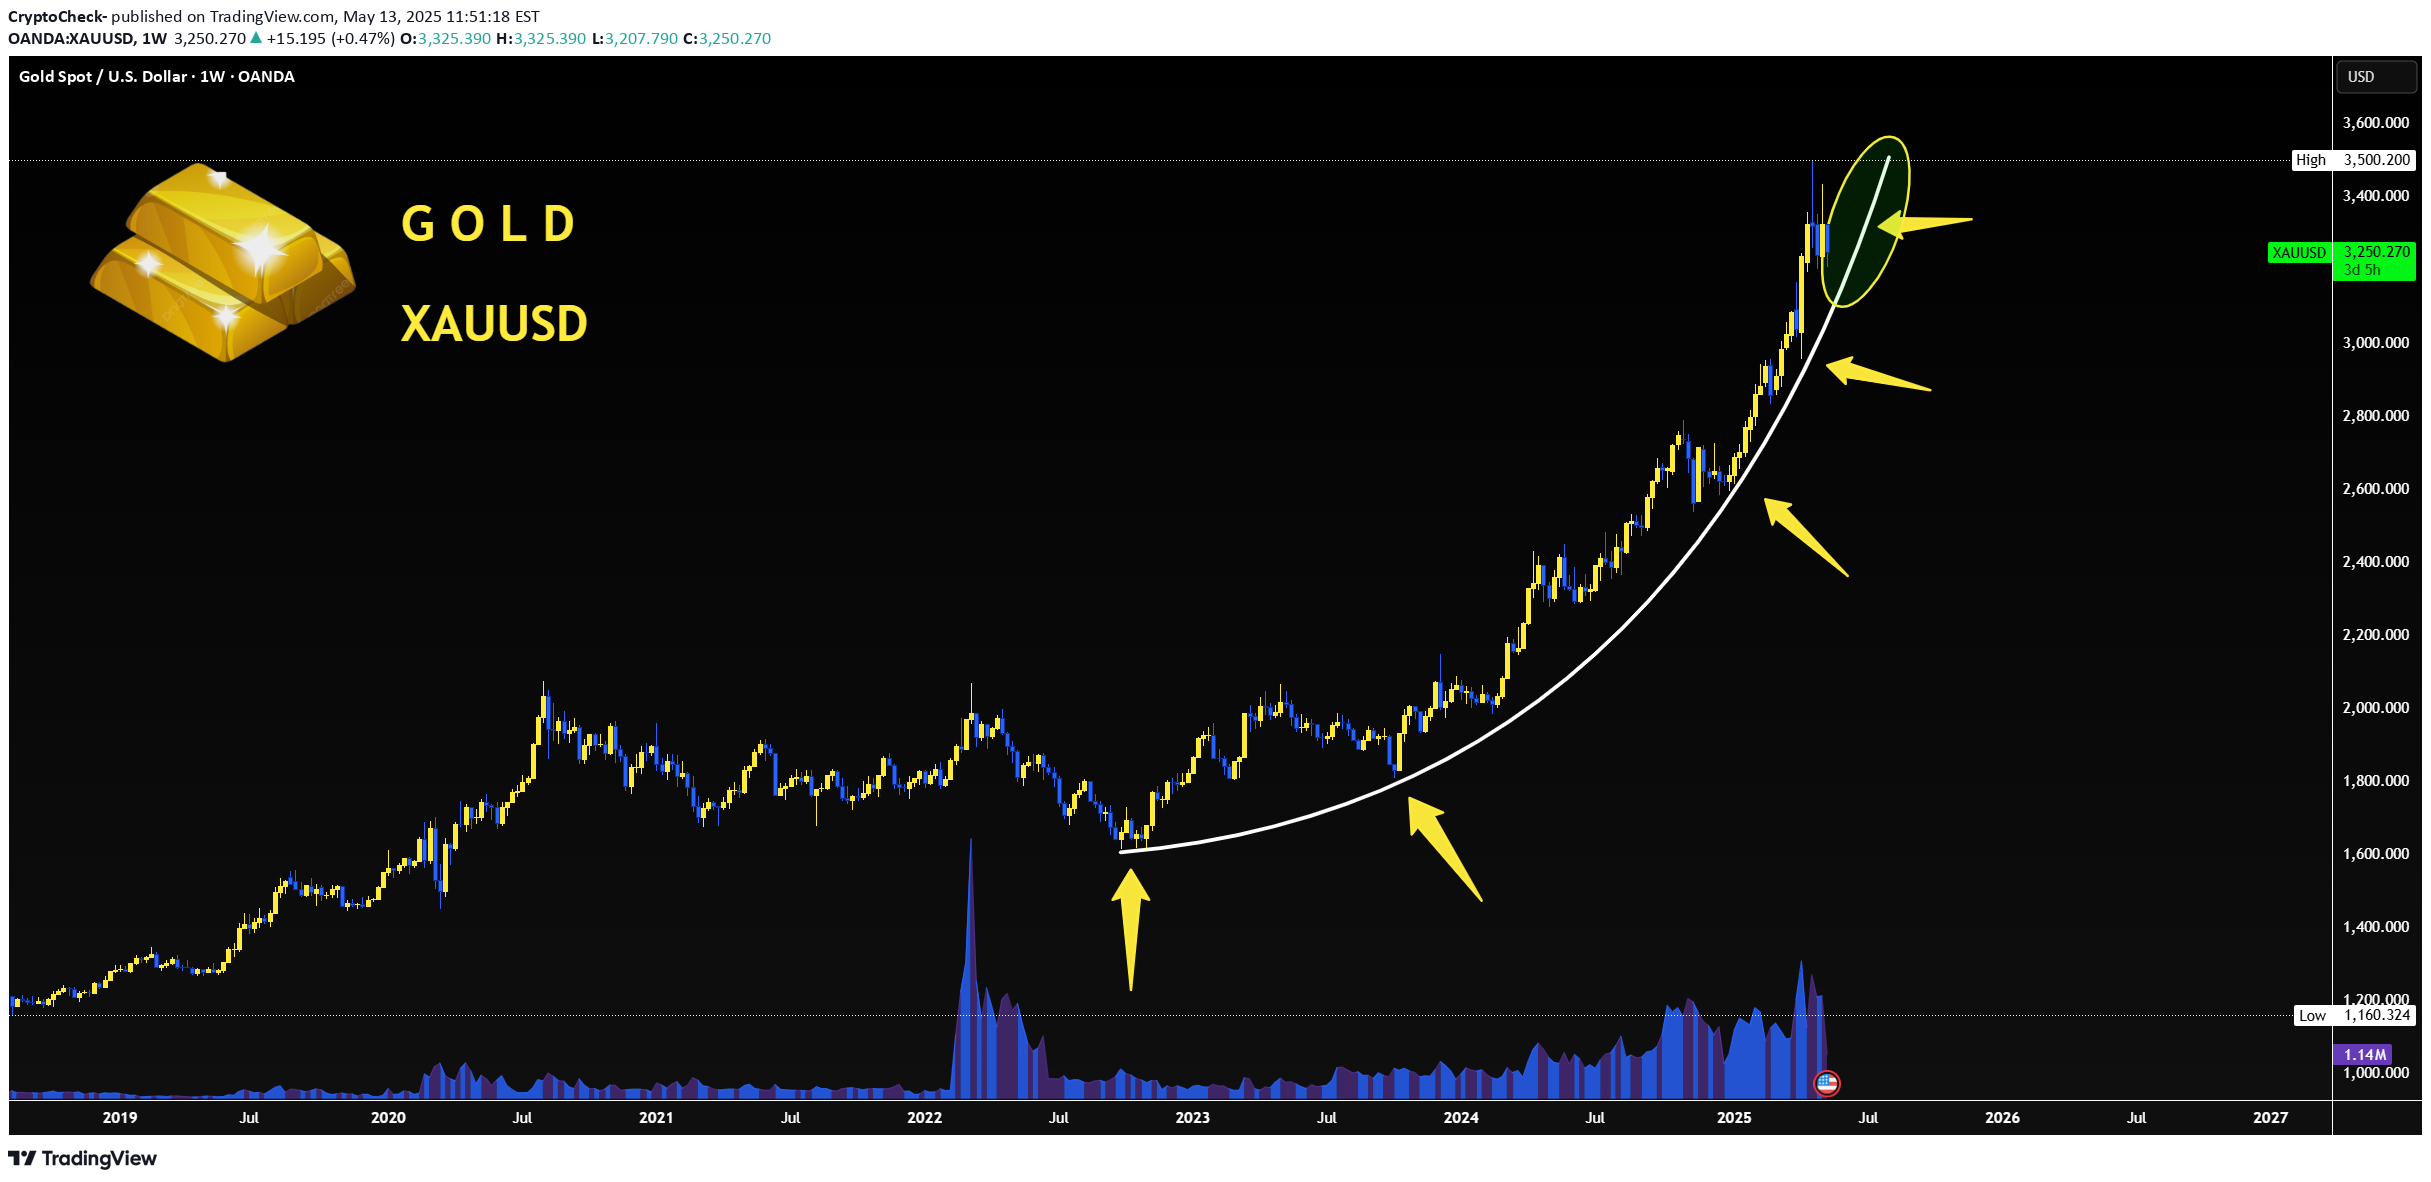
GOLD has been trading extremely bullish over the past year, with high volume indicating lots of interest and movement in this commodity's market:Is this where we should be getting worried?Rapid surges in gold prices have historically been followed by sharp corrections as markets adjust. Three key examples illustrate this; 🧨 the 1980 spike to $850 due to global instability, followed by a 65% drop; 🧨 the 2011 peak near $1,900 driven by economic anxieties, leading to a 40% decline by 2015; 🧨and the 2020 high above $2,075 amid pandemic fears and stimulus, which subsequently settled into a lower range.Noticing how gold has been trading in a parabolic curve, first corrections are likely to be down the curve (as it has been, historically):Across past gold peaks ( 1980, 2011, and 2020) and recent record highs, markets share four core similarities: 🎈elevated inflationary expectations,🎈low or negative real interest‐rate environments, 🎈heightened geopolitical and trade‐war tensions, 🎈aggressive central‐bank and ETF buying.Today’s gold rally mirrors these patterns, driven by persistent inflation concerns and renewed safe‑haven demand amid Middle East conflicts and Ukraine risk. Aggressive central‑bank and ETF purchases have also replicated past behavior. Emerging‑market central banks have accelerated gold reserves diversification since 2022, just as they did after the 2008 crisis and the Euro‑debt peak in 2011.Historically, swift peaks have been followed by multi‑year corrections as external conditions normalize. After January 1980’s peak, gold fell by two‑thirds over two years; following 2011’s high, it dropped 40% by 2013. If inflation cools or central banks signal genuine rate normalization, this rally may likewise give way to a sustained consolidation or correction.Did the BBC just signal the peak??Recently the BBC warned that while current trade‑war and market volatility parallels past booms, overreliance on gold alone risks miss-timing the eventual downturn when macro fears realize.Therefore, if the curve breaks, it's likely the beginning of the hard correction. __________________________ XAUUSD
CryptoCheck-
BTC | WHY Bitcoin is BULLISH | 2021 Fractal

5 reasons why I say BTC is on it's way to a new ATH (All Time High):✅1️⃣ Support zone reclaimedBTC has successfully reclaimed the support zone ABOVE the neckline resistance, a topic that I've been discussing over the past two weeks. If you'll recall, I pointed out either 70k or 90k. We have our answer: ✅2️⃣ TrendlinesTrendlines are BULLISH as BTC continues to make highger lows, a key indication of bullish sentiment even when a pullback is present:✅3️⃣ Moving AveragesBTC has reclaimed ALL moving averages in the daily, a bullish indication:✅4️⃣ Trend Based IndicatorsA bullish flash in the weekly is a strong sign:✅5️⃣ FractalIt's possible that BTC plays out similarly to the previous ATH fractal from 2021:________________________BTCUSDT
CryptoCheck-
BTC | New ATH Incoming | + 135% ??

A very interesting fractal from 2021 lead to a 135% increase - and a new all time high.Bitcoin has been following similar patterns to the bullish twin-peaks in 2021. After a multi-month correction, the price proceeded to increase another 135% over the next few months. Some weeks fast, and some weeks sideways. Is it possible that BTC follows a similar pattern - and increase another 135%, all the way to 170k?Hec, I'd even be happy with just a 100% ! That would lead us up to around 149k, which can also be considered a phycological resistance zone.While you're here! Check out this post on PEPE:_________________ BTCUSDT
CryptoCheck-
XRP | Second Wind or PUMP AND DUMP !!

XRP is on another bullish leg at the current moment, moving strongly towards the next resistance zone.I would however trade with much caution, considering the extreme pump and dump nature of the coin. With high gains in short timeframes, but also massive losses in sort timeframes.A sharp wick towards the 50d moving averages already shows the buying pressure has likely peaked, even if the price can push higher the XRPUSDT test of the 50d MA is an early sign that bullish pressure is on its last leg:I will say this: short term, if you look at the chart, you simply must be bullish. But I still won't touch XRP with a ten foot pole at this price. Other altcoins such as TIA present much better, lower risk entries._____________________ XRPUSDT
CryptoCheck-
PEPE | BULLSH | ALT can +150%

PEPE seems to have bottomed out after flashing bullish signs on the chart.Once we close ABOVE the 50 day moving averages (green line) in the weekly timeframe, that's when we'll know the bullish action is full steam:Make sure you don't miss the update on BTC here:______________________ PEPEUSDTIt is crucial for PEPE to hold the current support zone:
CryptoCheck-
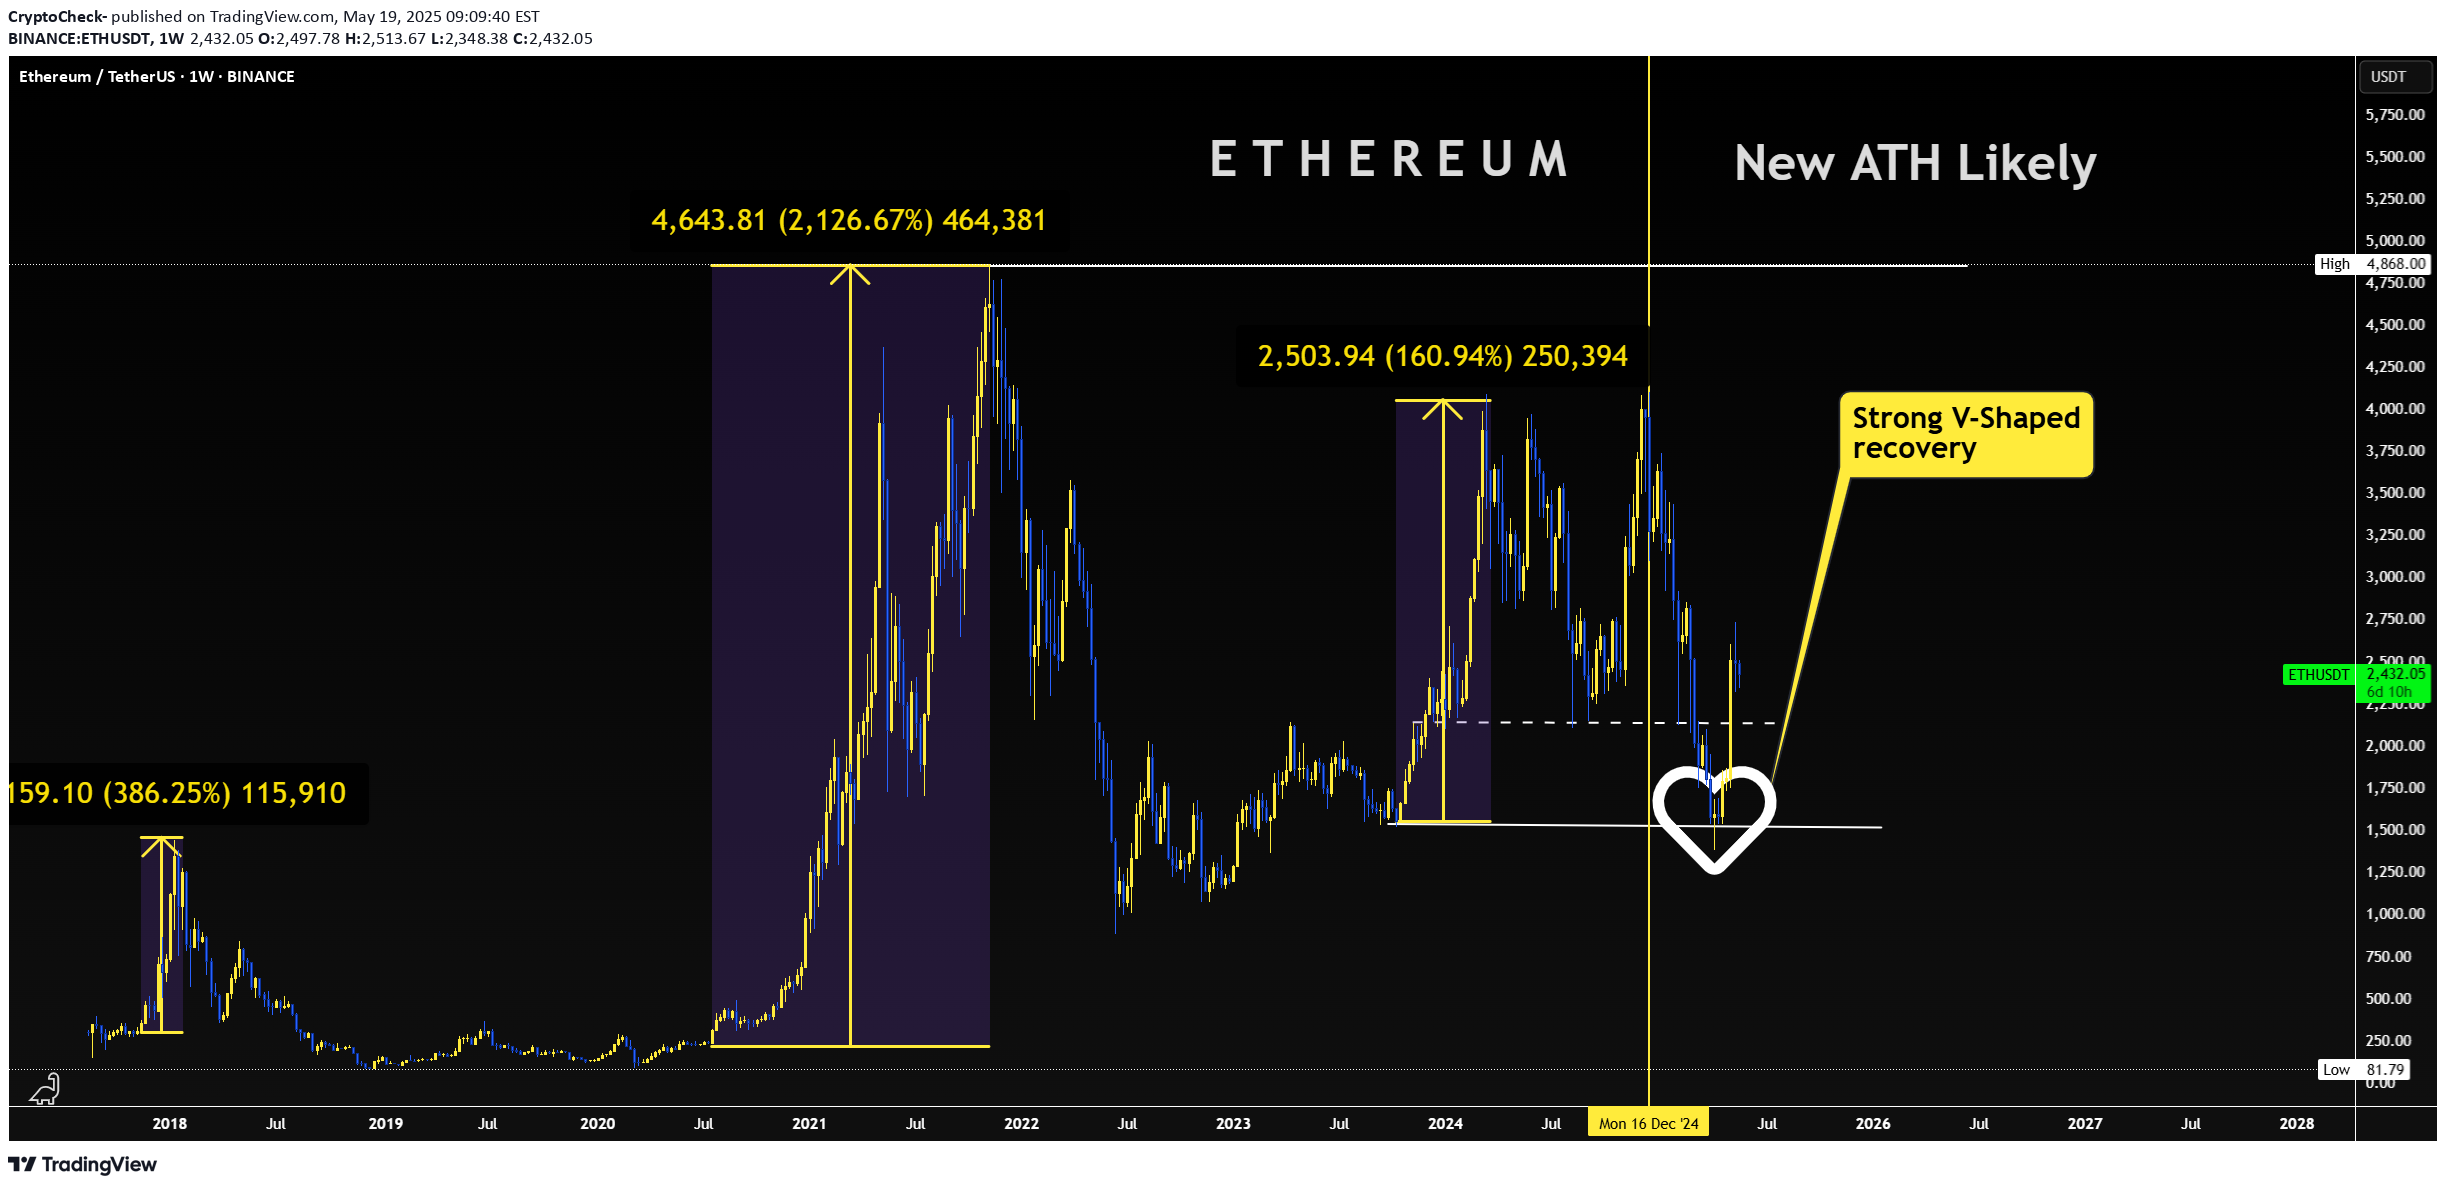
ETH - New ATH Approaching?

Bitcoin has been full of surprises over the past few days, and this will most definitely affect Ethereum as well - which has not made a previous ATH when BTC did, a point we should not be forgetting.This would also bring about the beginning of a new ALTSEASON.But before we get too excited about all of the above - let's first see if Bitcoin can continue to CLOSE daily candles above the key support zone, as pointed out in the video._______________ ETHUSDT BTCUSDT
CryptoCheck-
ALTSEASON | ALTS | BUY Zones Summary
Over the past few weeks I've been gradually analyzing the alts that I believe have great potential for the next cycle.These include:✅ ATOM✅ Litecoin✅ Fantom✅ Doge✅ SUI✅ SHIB✅ DOT✅ PEPE✅ BNB✅ Tron✅ The Graph✅ Render✅ Maker✅ AAVEHere's your quick video summary on ideal buying zones for the above altcoins. Enjoy!____________________________
CryptoCheck-
ETH | Ethereum Hits 2 YEAR LOW - What's Next?
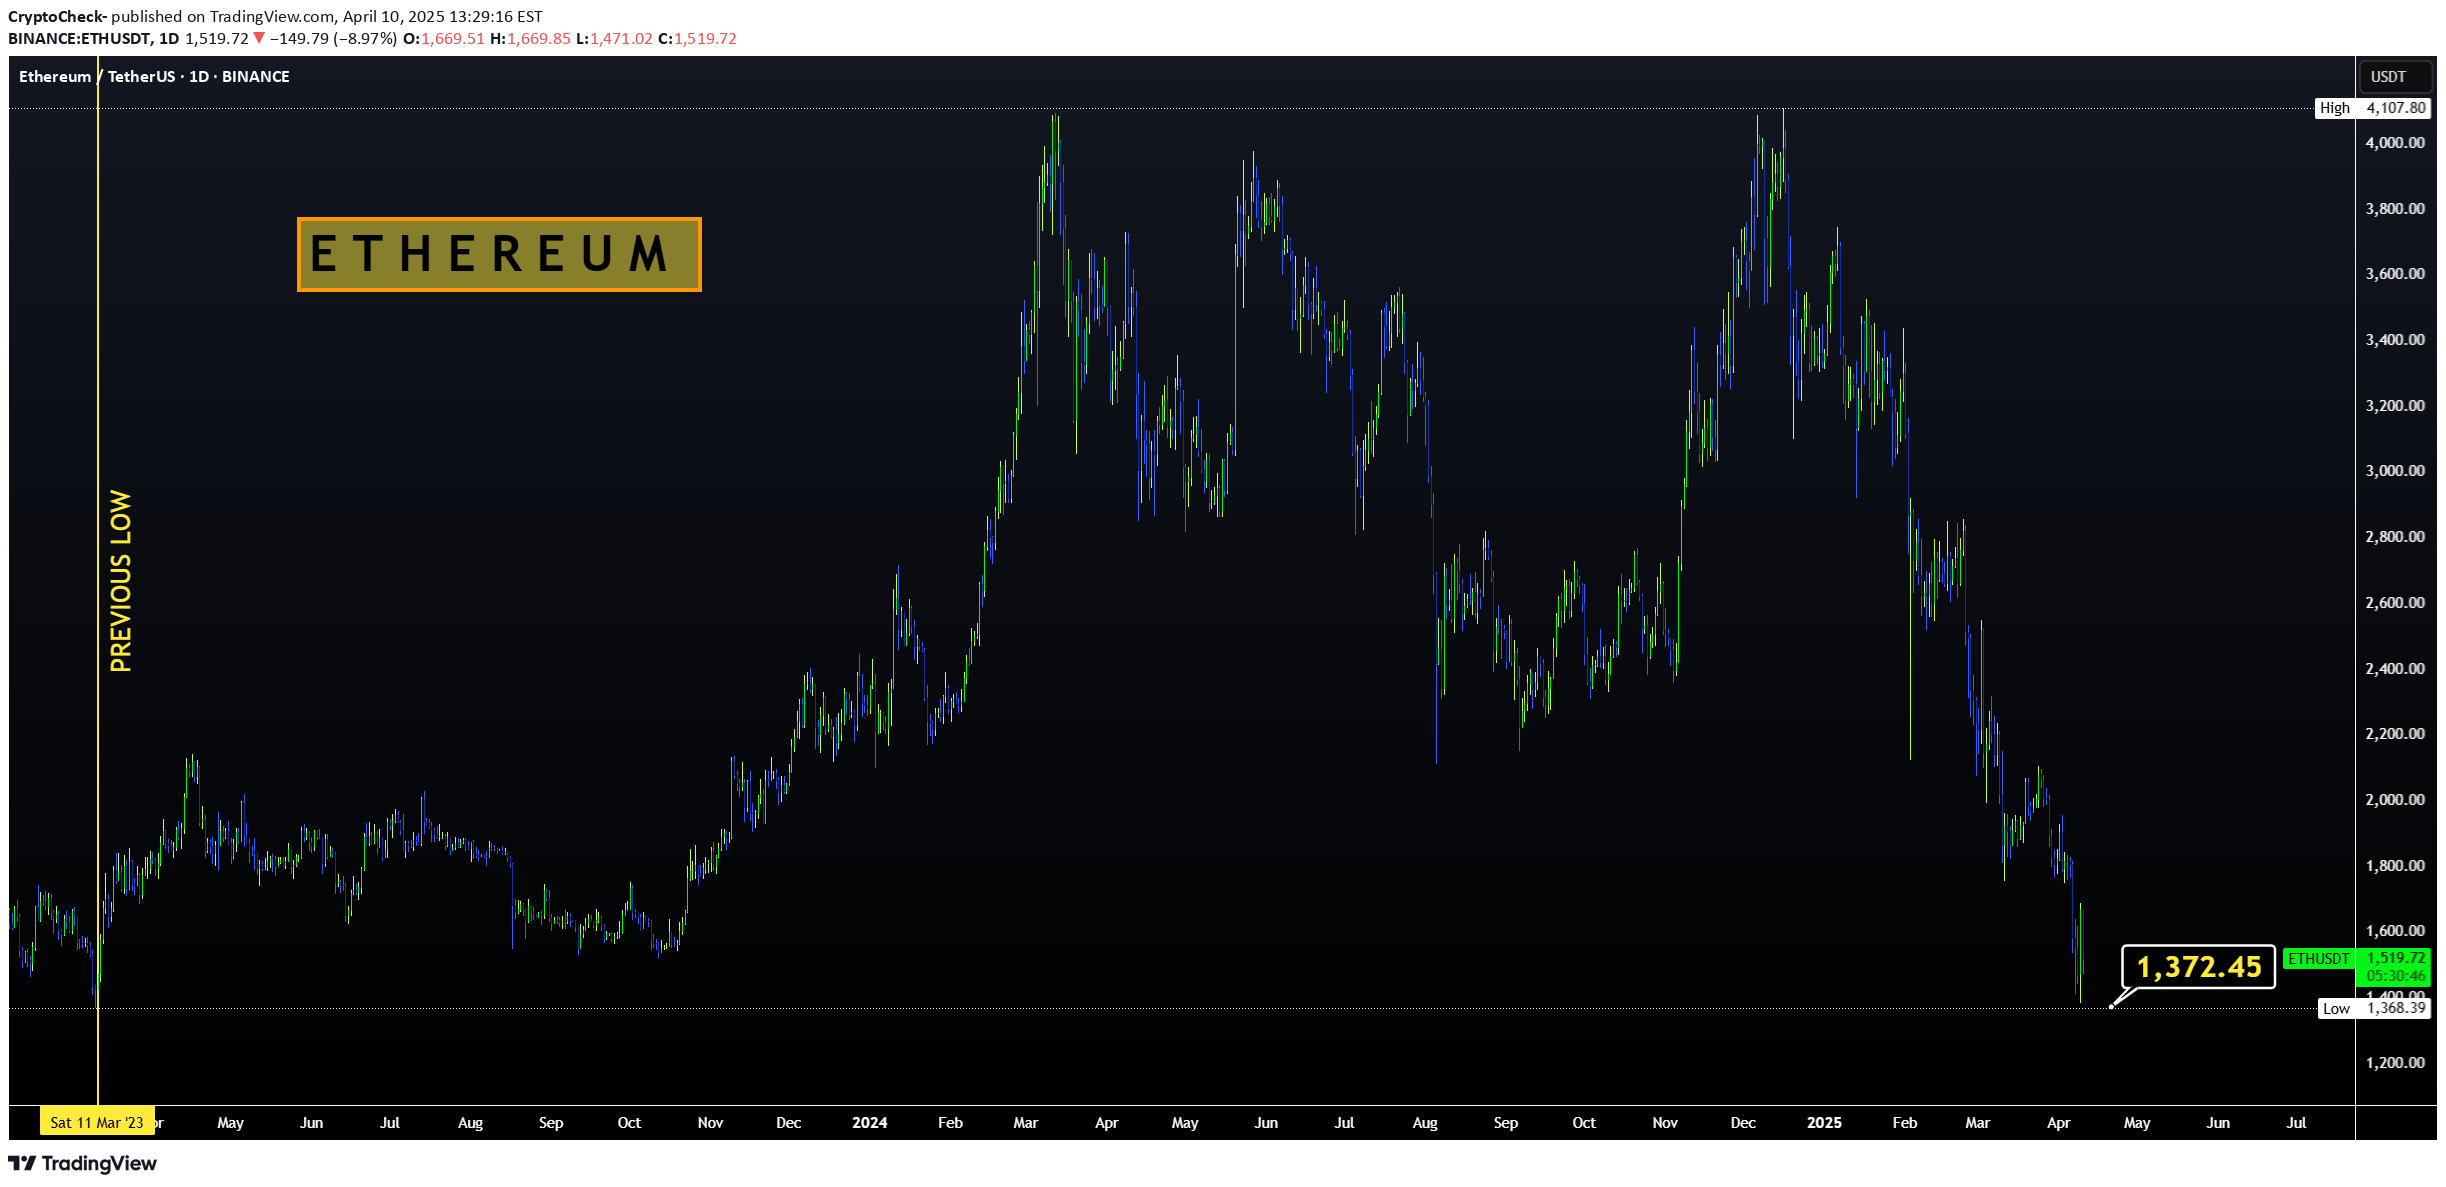
Could it be that ETH bottoms out here?Low from March 2023:Interestingly enough, it could be said that it was the previous cycle's accumulation zone. Considering the previous cycle's price action, this isn't a ad zone to load up - for the longer term.From here, although the price bounced high, and low, it was the 8-month price action before the next bullish cycle started. This gives us perspective in terms of time___________________ ETHUSDT
CryptoCheck-
ETH | Either OR Scenario | ALTSEASON

The previous update was on the current low that ETH hit a couple of days ago, and what happened the previous time we hit that price:POTUS Donald Trump signed a bill that exempts DeFi platforms from reporting on their clients' taxes, unlike traditional brokers. This may explain the bullish sentiment we're observing across the market currently.💥ALTS Part 1 and 2 below, stay tuned for Part 3 ! 💥____________ ETHUSDT
Disclaimer
Any content and materials included in Sahmeto's website and official communication channels are a compilation of personal opinions and analyses and are not binding. They do not constitute any recommendation for buying, selling, entering or exiting the stock market and cryptocurrency market. Also, all news and analyses included in the website and channels are merely republished information from official and unofficial domestic and foreign sources, and it is obvious that users of the said content are responsible for following up and ensuring the authenticity and accuracy of the materials. Therefore, while disclaiming responsibility, it is declared that the responsibility for any decision-making, action, and potential profit and loss in the capital market and cryptocurrency market lies with the trader.