
Crypto-Check-
@t_Crypto-Check-

What symbols does the trader recommend buying?
Purchase History
پیام های تریدر
Filter
New Court Case DISASTEROUS for SOLANA?

Quite silently, Solana may be heading into one of the most consequential legal challenges it has faced to date. The implications reach far beyond short-term market of SOL -it will likely affect MANY more crypto's and projects. A US federal judge has recently (past few days) approved a class action lawsuit to proceed against several parties tied to the Solana ecosystem, including Solana Labs and entities connected to PumpFun. This isn’t speculative rumors; the court has ruled that the claims presented are substantial enough to warrant deeper examination. The argument of the case is an allegation that cuts directly into Solana’s technical design. Plaintiffs argue that certain insiders benefited from preferential access created by the network’s validator structure and transaction-ordering mechanisms. In practice, this allegedly allowed privileged actors to enter positions earlier, exit faster, and systematically offload risk onto retail participants. The court’s decision suggests regulators and judges are increasingly willing to scrutinize not just token issuers or apps, but the underlying blockchain infrastructure itself when assessing fairness and market access. Therefore, it could be consequential for the rest of the crypto market as well in the near to long term. That framing introduces a serious existential risk.
TOP 5 Low Cap ALTCOINS 2026

Here's a quick glance at my TOP 5 alts of choice for 2026, and why. 💭 Injective (INJ) Fast, interoperable DeFi infrastructure. Active development and a clear use-case in scaling decentralized trading. INJUSDT 💭 Theta Fuel (TFUEL) Utility token for Theta’s decentralized streaming network, with demand linked directly to real network usage. TFUELUSDT 💭 Illuvium (ILV) Prioritizes high-quality gameplay and steady development, backed by a solid revenue model. ILVUSDT 💭 Origin Protocol (OGN) Focuses on tokenized commerce and NFT marketplaces, making it easy for creators and brands to build decentralized storefronts. OGNUSDT 💭 Audius (AUDIO) Decentralized music-streaming platform giving artists more control and growing consistently in real-world adoption. AUDIOUSDT Which alts are you watching in 2026?
Solana ~ TRADE The CHOP: 3 Ways to Make ATLEAST +15%
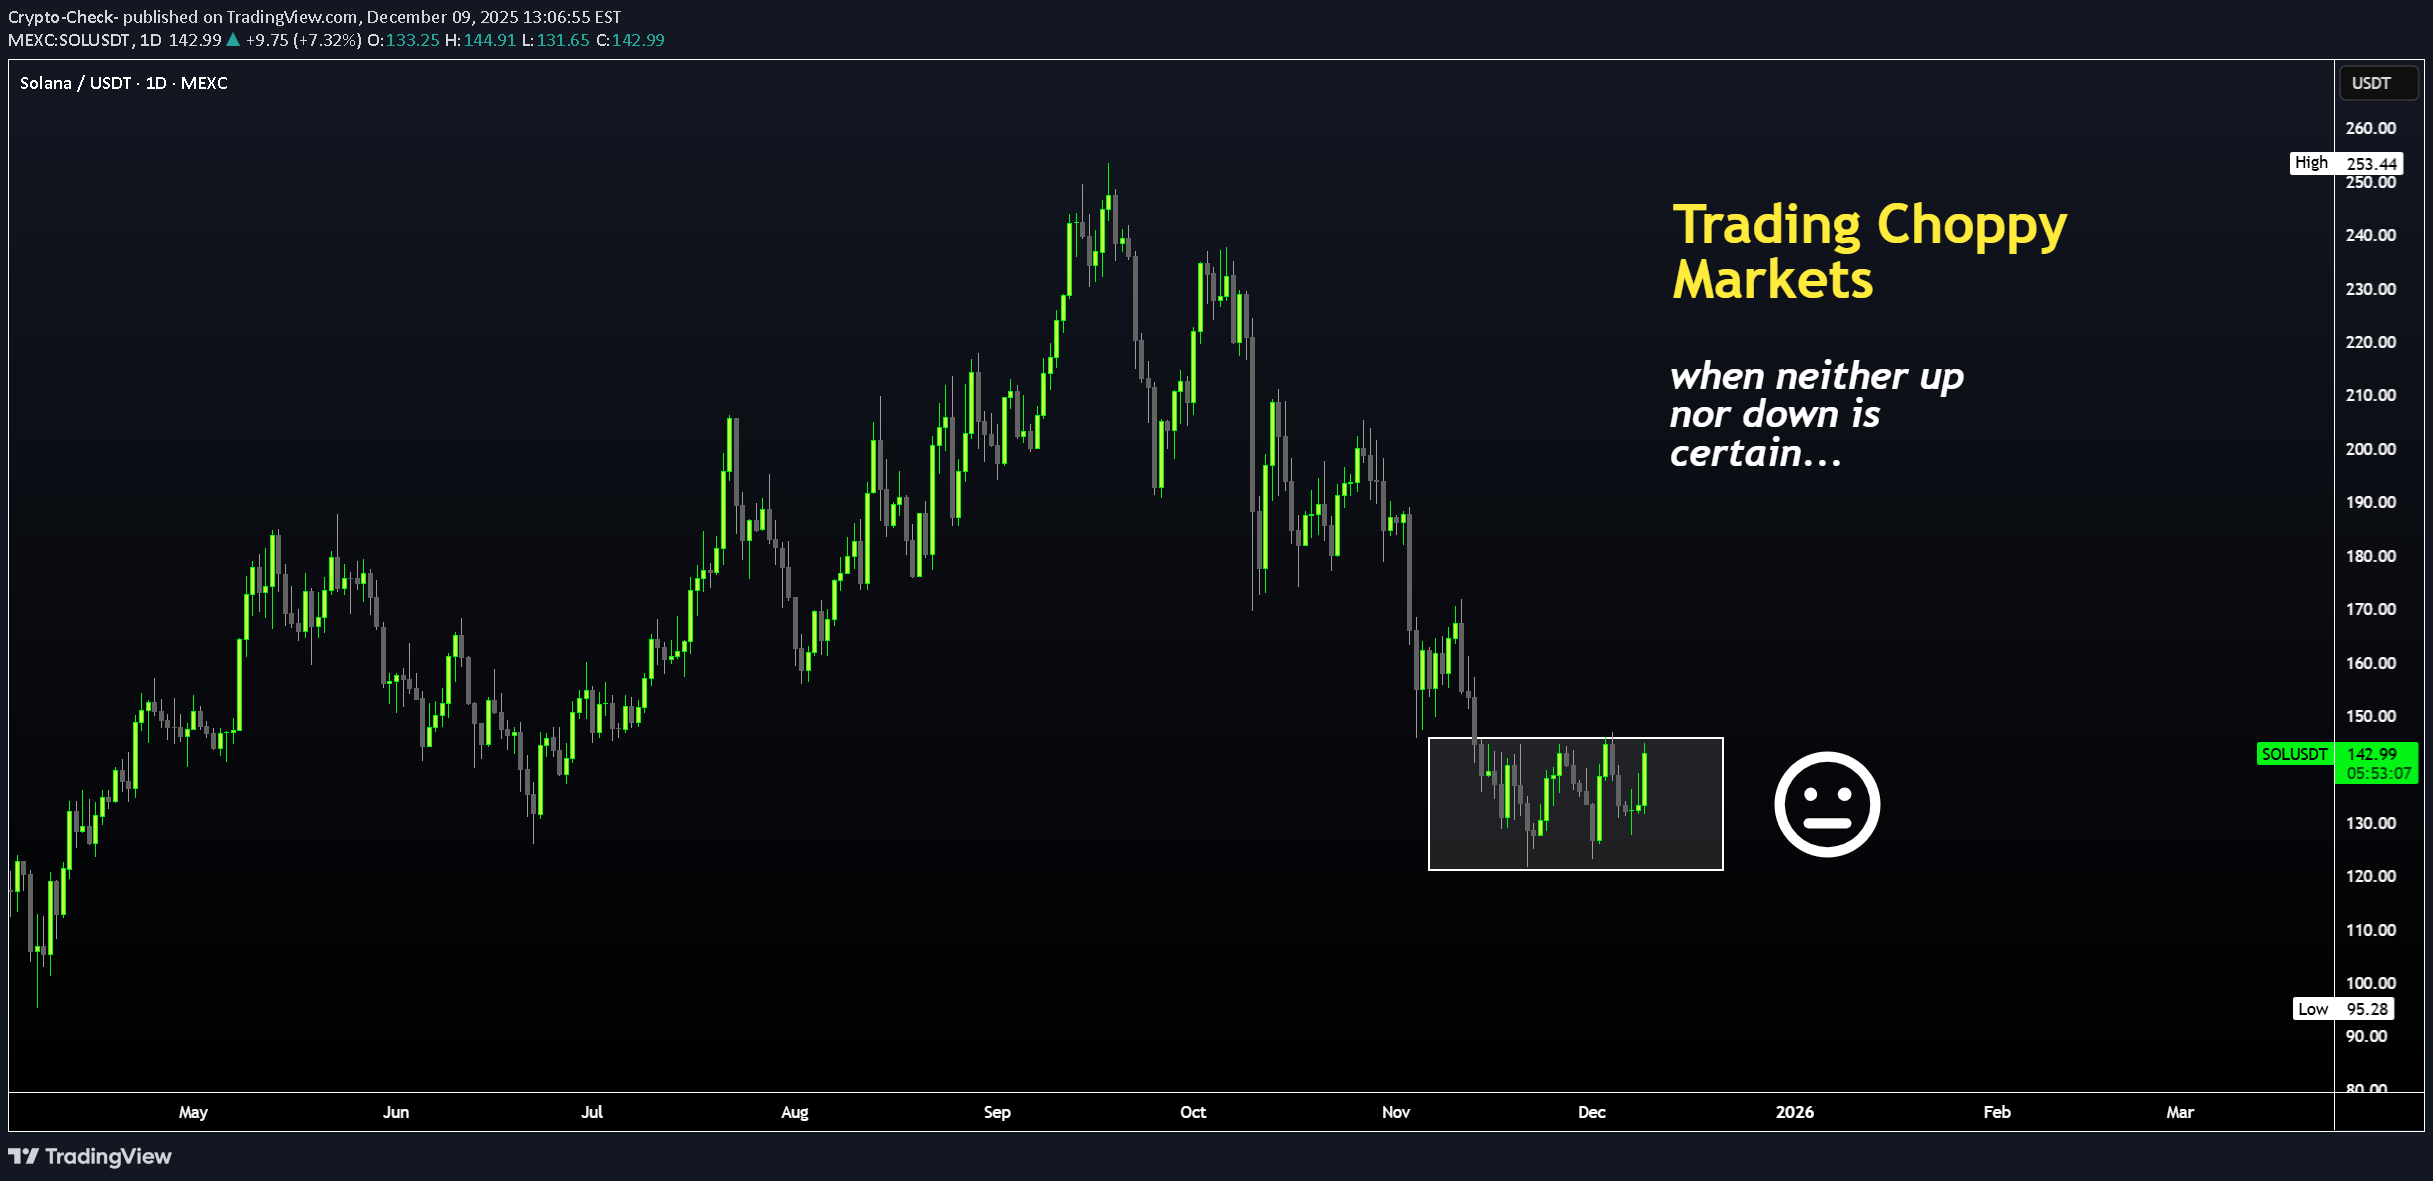
Choppy markets are identified by low volume and sideways trading / range trading. It seems uninteresting in most cases, but you don't have to sit around and wait for the next big impulse wave! Here are three plays YOU can take during choppy markets: 1) 4H : Short Resistance Chop trading can be a blessing - the price often touches the same support zone and the same resistance zone 2 - 3 times, before breaking out either way. This means that if you spot your zone early, you could take a short timeframe swing trade. Another way to find a trade is to look for gaps in the candles, for example: 2) 4H : Long Support South Africa is in a time of turbulence, and the Rand is unpredictable as the effects of G20 settle in. During these times, and this counts for all markets, placing a low risk leveraged long on support is a way to trade the chop: 3) Daily : SPOT Hold to TP Zone Nothing like a classic low risk trade - but you may need some patience with it! If you're not willing to look at charts all day, or have alarms wake you up at 2:30am to take a trade then this is your style., for example: What do you do during choppy markets?Don't miss my latest TOP 5 Altcoins for 2026 update:This post will help you understand the dynamics between BTC and Altcoins:
بیت کوین در ۹۰ هزار دلار: آیا قیمت بالا میرود یا سقوط در انتظار است؟ (تحلیل فنی)
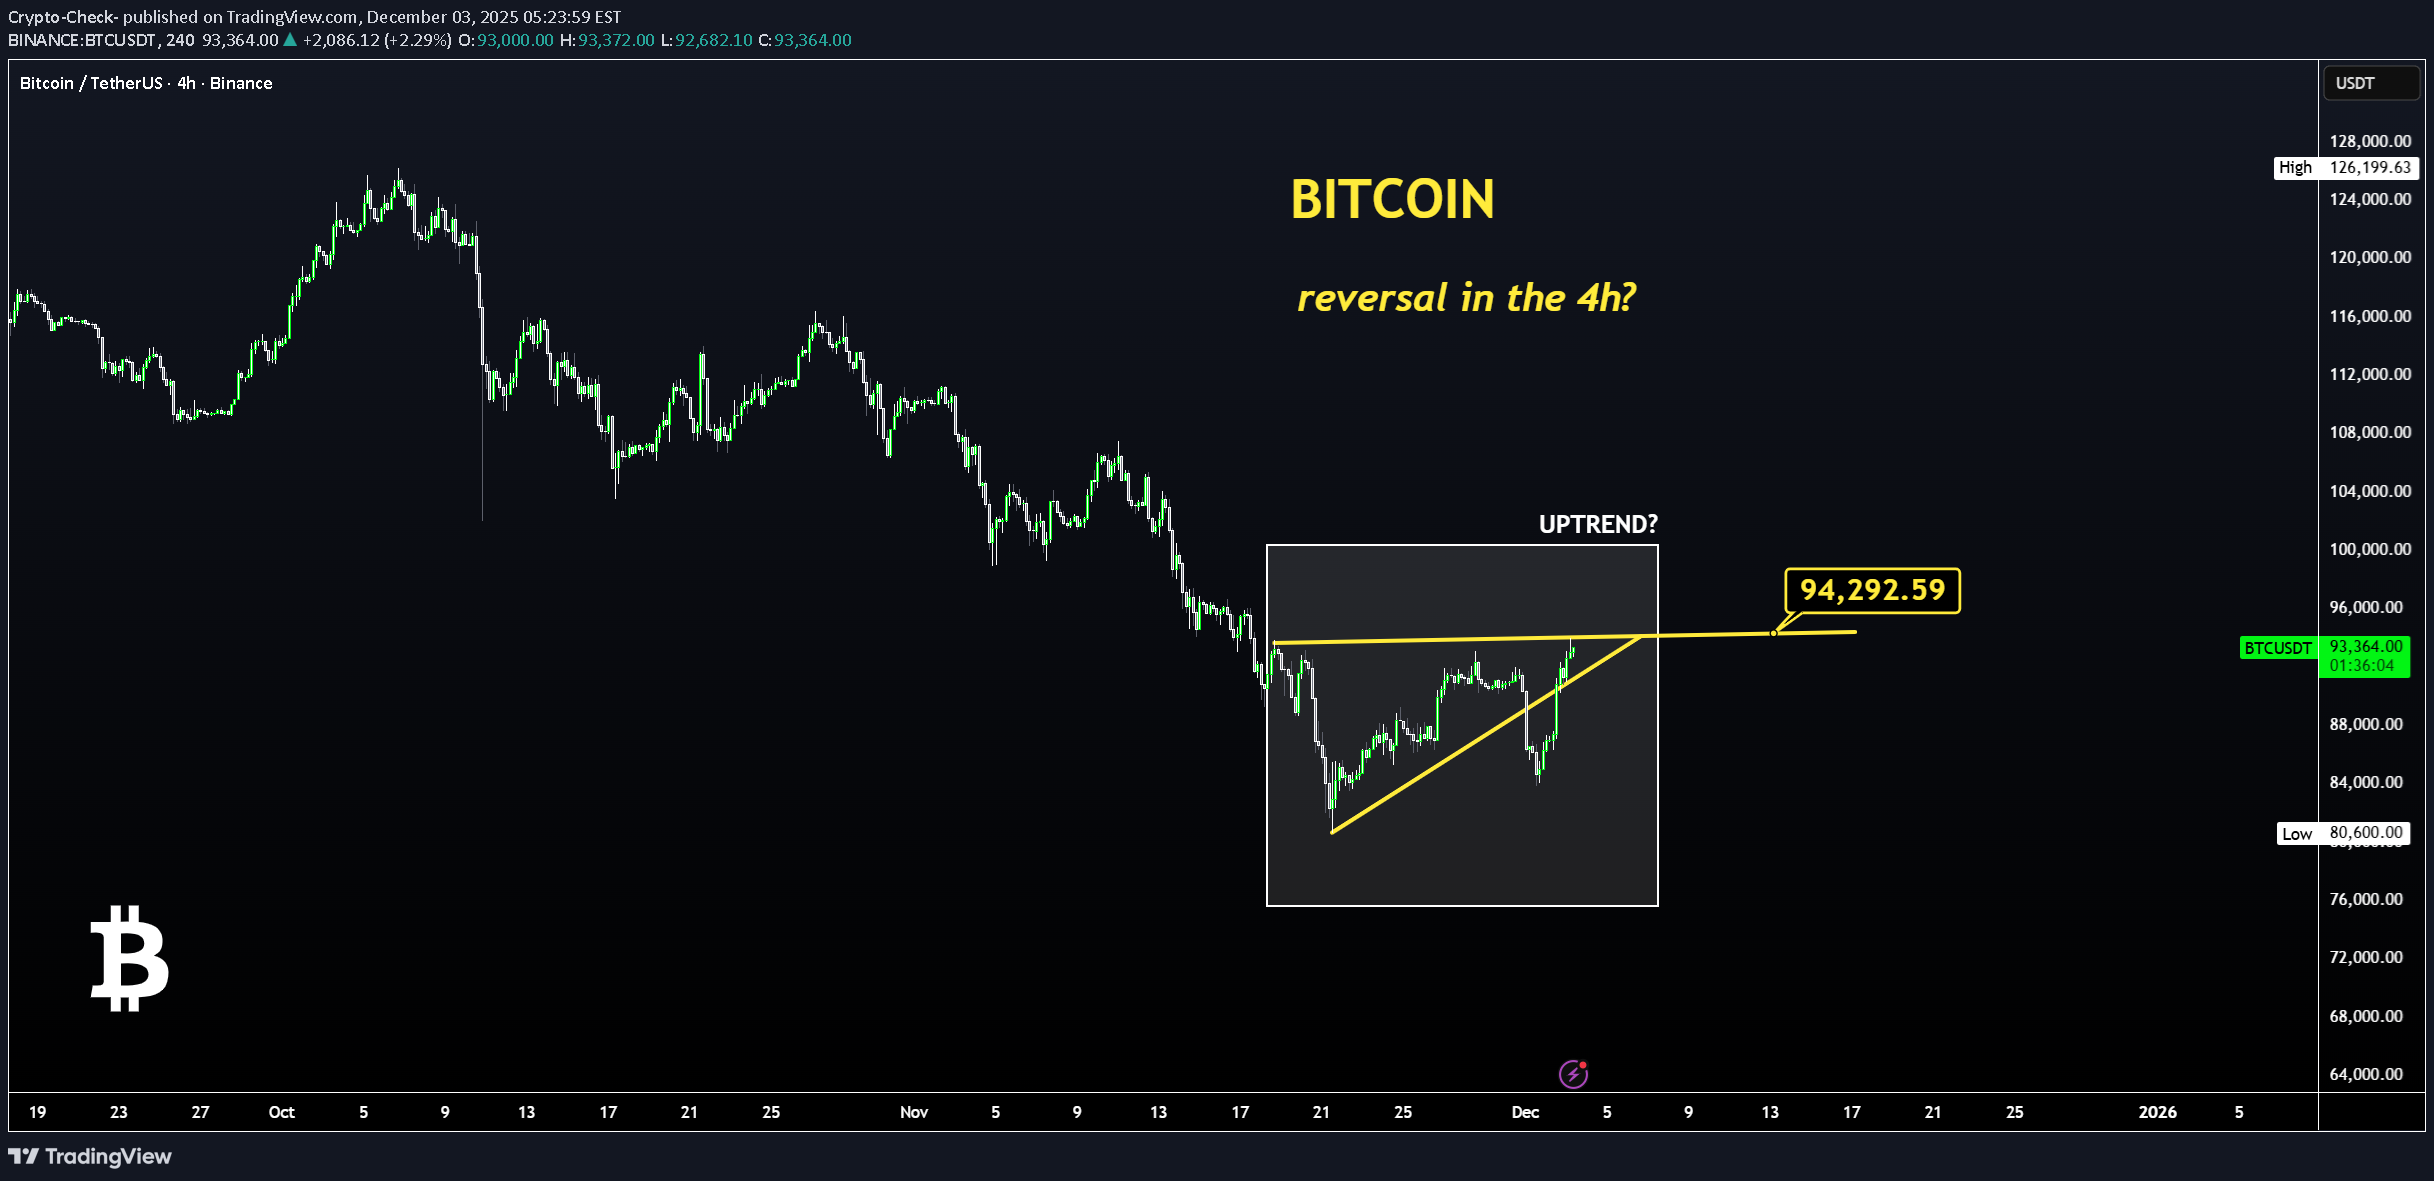
Hello Bitcoin Watchers 📈 BTC is looking promising with a price recovery towards the upside, currently trading just over $90k. 📢But let's not forget, a higher high was observed here as well. A further -30% drop followed after this pullback to the upside: If we have to follow a similar trend, over the next two months we could end up at around $65K: Conclusion - I'm leaning towards more drop to follow after a period of sideways trading here. We could see this zone hold for two or three weeks up until after Xmas, at which point longs could be liquidated again if the optimism goes too high. If you've been following my previous BTC updates, you would have seen that it's not uncommon for the price to recover to the basis of the Bollinger bands, or mid-level moving average. And the only way that can be considered a reversal, is if the WEEKLY starts closing above the 50day moving average, which we are no where near close to seeing. BTCUSDTAnd just as expected, the price is breaking below the trendline:And BTC Resistance line is pushed lower by sellers, indicating more bearish pressure for the short term:
راز گردش پول در بازار رمزارز: بیت کوین، آلت کوینها و سلطه (دامیننس)
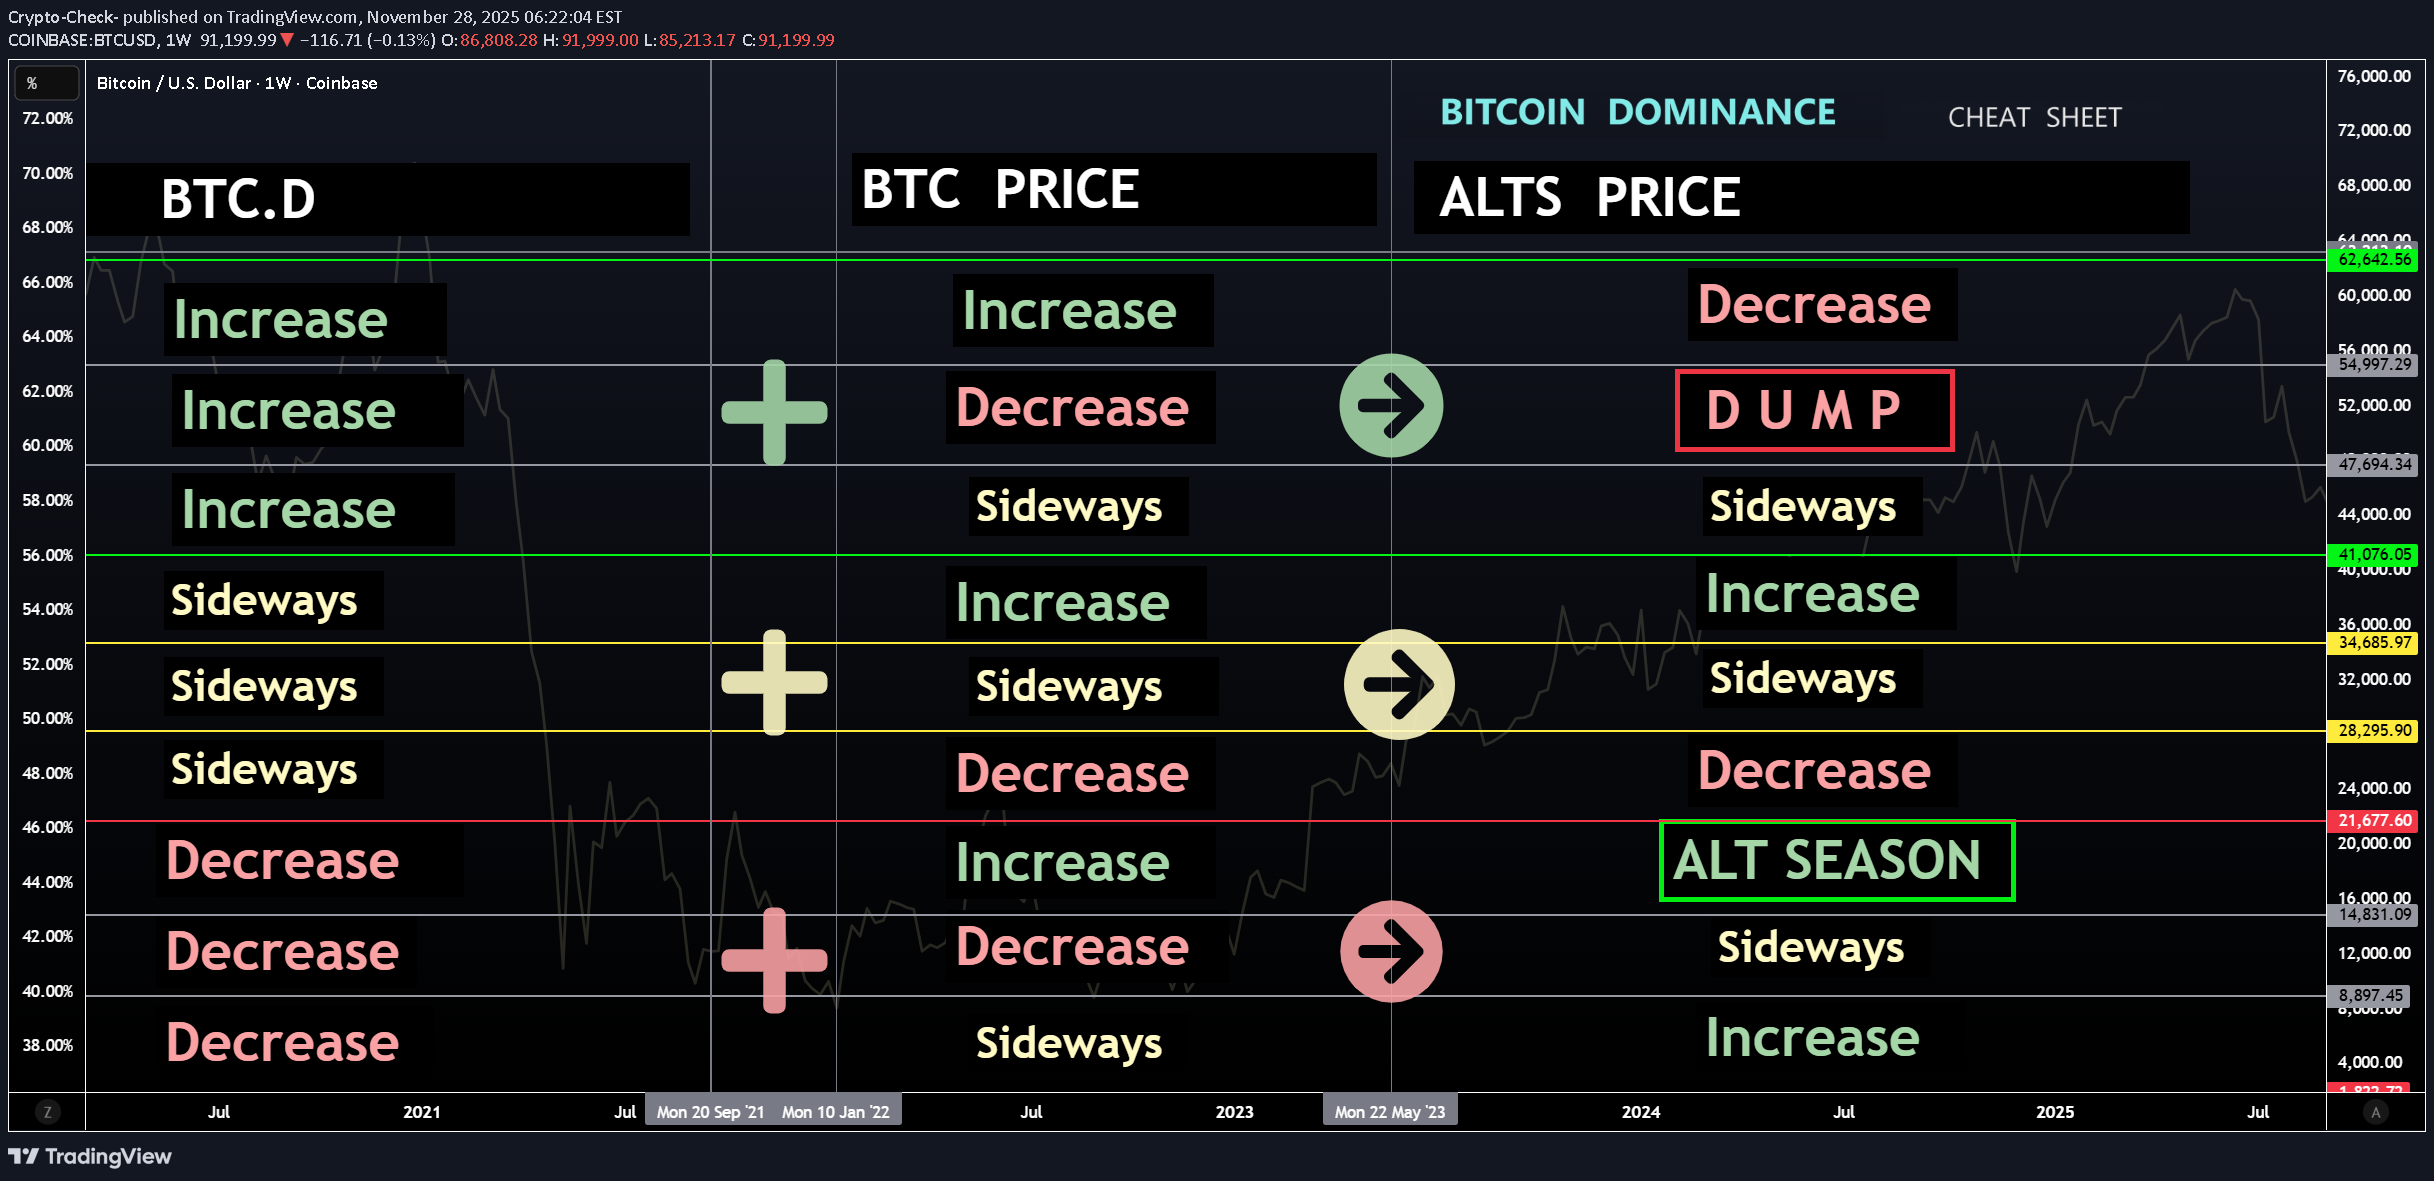
✅Bitcoin Dominance, BTC, Altcoins✅ Today, We're talking about the rotation of cash between Bitcoin and altcoins. Imagine a pie where each slice represents a different cryptocurrency. The pie here indicates the total cryptocurrency market cap of both Bitcoin and altcoins, which can increase or decrease at any given time. In other words the TOTAL chart. - If BTC market cap increases but altcoin market cap shrinks (relative), the pie stays the same size. - If BTC market cap increase and altcoin market cap increases, the pie size increase and so forth. Total Market Cap and BTC.D At most of the key moments, we see a clear inverse relationship here. Alts drop harder than BTC, as this clearly shows. But during the cycle, investors hop on and off, injecting money into the ride (buying) and taking it out (selling). This constant movement is what keeps the crypto markets going. Let's break it down with visuals: Chart 1: Bitcoin This rollercoaster represents Bitcoin's price action, and also my view on where we are in the current cycle. (I believe we're in a multimonth correction, followed by the last impulse wave up probably close to XMAS 2025 as usual). You'll need this to know where we are in the cycle right now: Chart 2: Bitcoin & Bitcoin Dominance This chart shows Bitcoin's dominance, which is basically its share of the total crypto market capitalization (market cap = total value of all cryptocurrencies). When Bitcoin's dominance goes up (higher on the chart), it means investors are putting more money into Bitcoin, potentially at the expense of altcoins. Conversely, when dominance goes down, it suggests capital is flowing towards altcoins. The difference is clear: Chart 3: BTC.D vs TOTAL3 In this chart, we overlay the Total 3 Priceline (BLUE) on top of the Bitcoin Dominance chart. TOTAL3 shows us all alts except ETH. The Bitcoin Rollercoaster and the S&P 500: When Bitcoin surges (line goes up), it can sometimes lead to increased investor risk appetite. This might entice some investors to move funds from the S&P 500 into riskier assets like Bitcoin, potentially causing a slight dip in the S&P 500. Conversely, when Bitcoin experiences a price drop, investors might flock back to the perceived stability of the stock market, potentially causing a rise in the S&P 500. So, is there a guaranteed CORRECTION? All the signs are proving this may be the case. By understanding the relationship between Bitcoin, altcoin prices and dominance, you can get a better sense of where the money merry-go-round might be headed.At the moment, BTC has already recovered to the 20d moving average (which is the basis of the Bollinger Bands) and is now likely wicking to the lower 70's zone next.
آیا بیت کوین در دسامبر سقف جدید میزند یا سقوط میکند؟ تحلیل تکنیکال و ماکرو
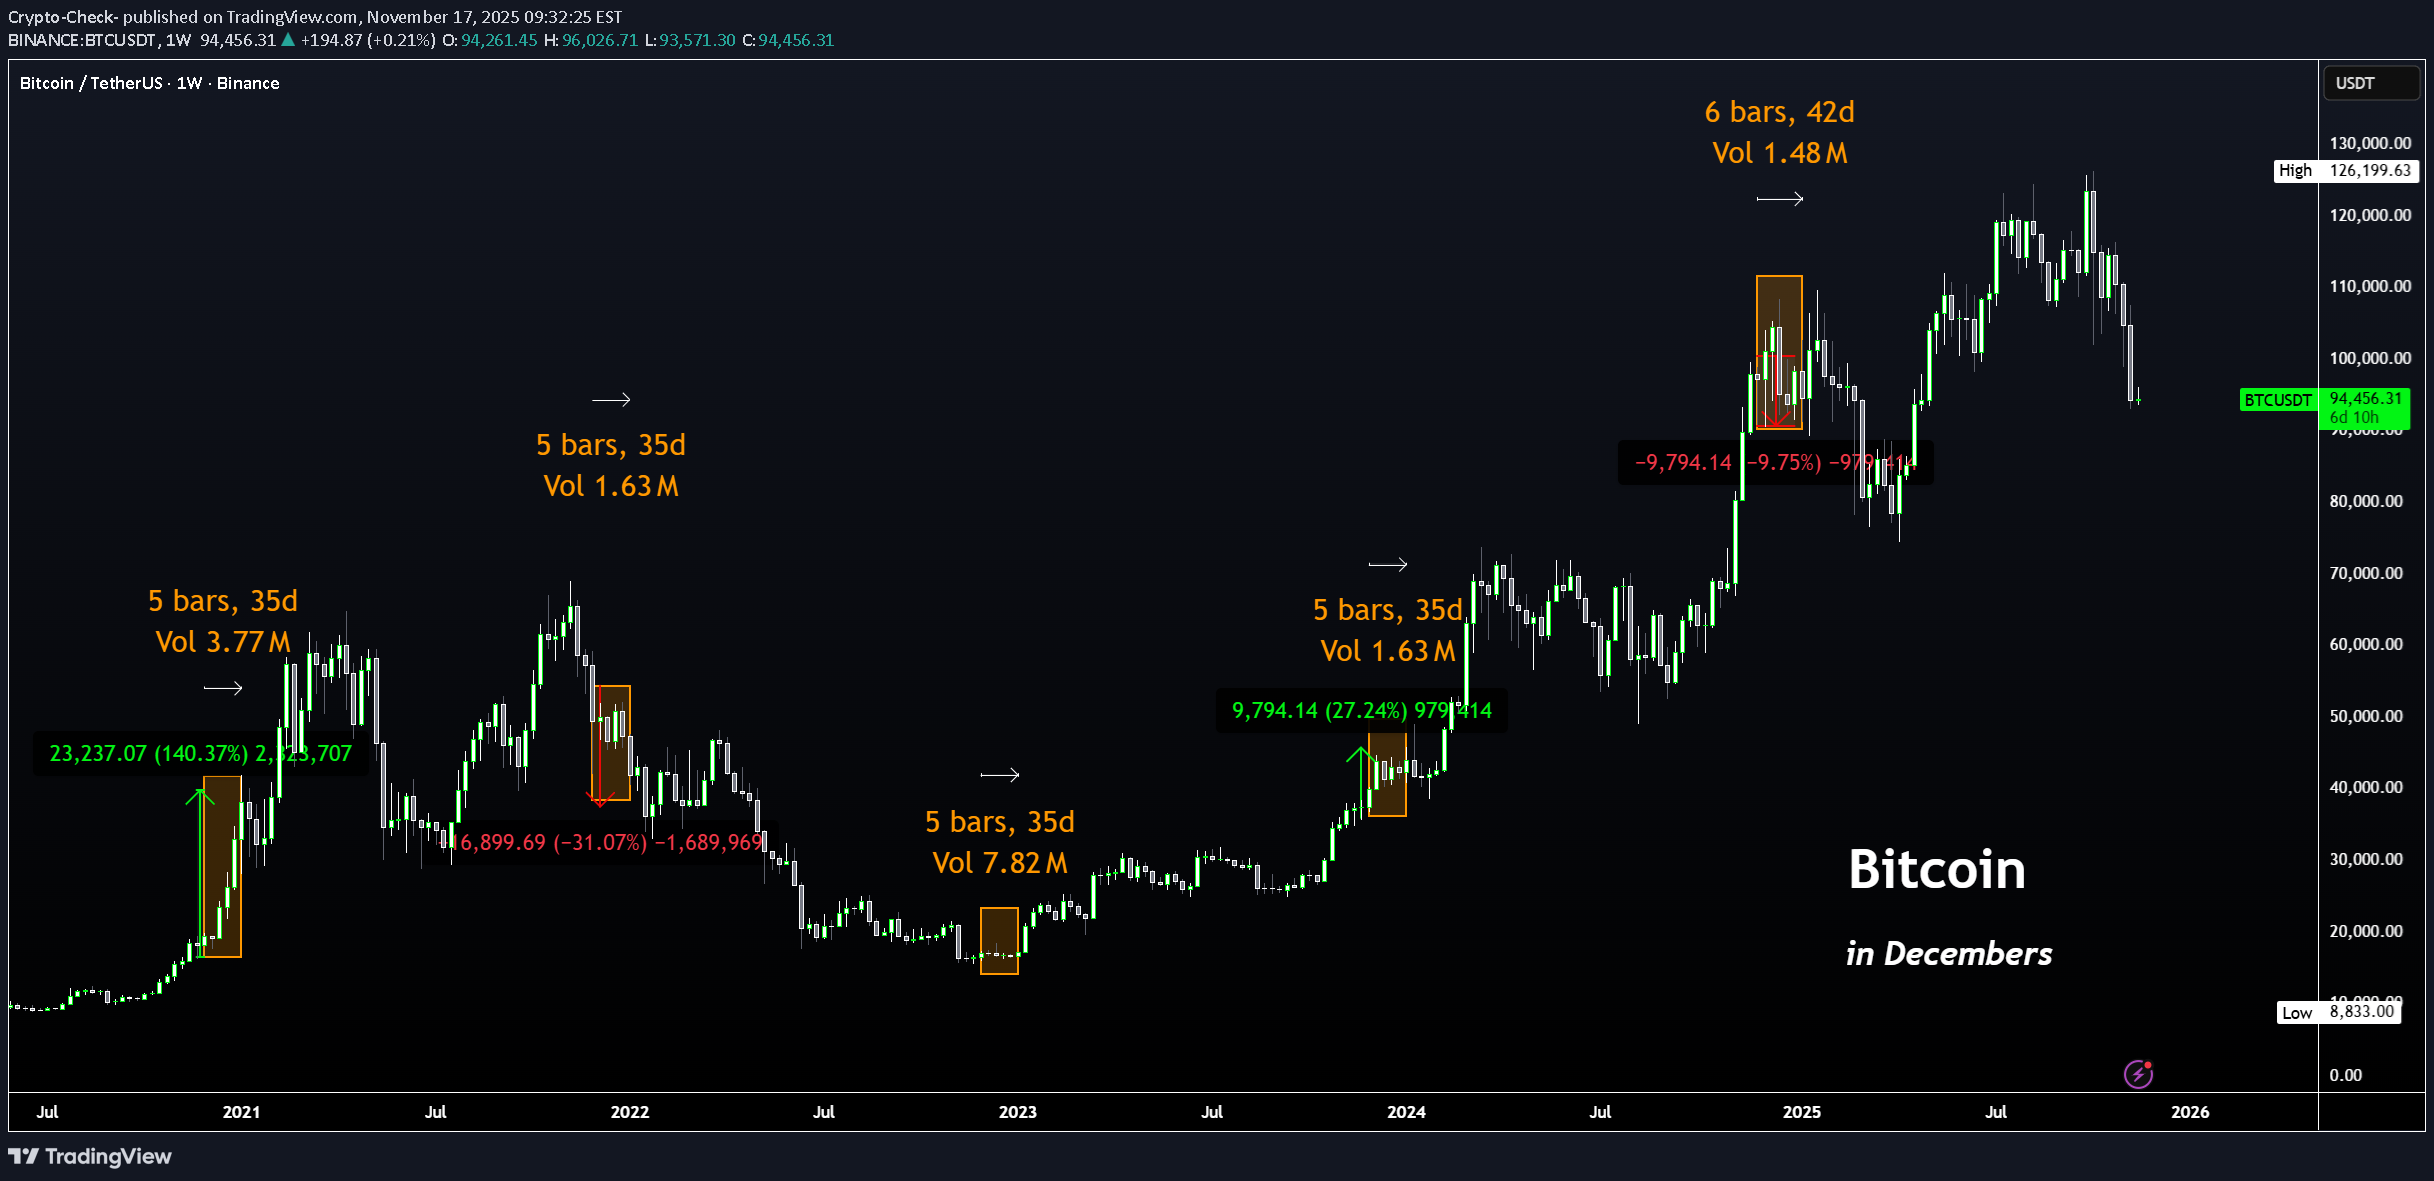
Hello BTC Watchers 📈 Bitcoin has, historically, been very bullish in Decembers. We see the most drastic increase in 2020, when BTC climbed over 140%. During the times that BTC corrected over December, it's been 10% and 31%. This makes it hard to predict seeing that it seems to be different every year with one year even trading in a tight range. A few things we can do to clarify the possible direction of BTC This December: 1️⃣ Check the Macro From a macro perspective, Bitcoin has increased and been increasing since April, with the hard drop only showing now in November. This could mean two things - the correction before a final leg up or, the beginning of the bearish cycle. 2️⃣ Check Technical Indicators a) The moving averages is pointing towards short-term BEARISH, since we are trading UNDER the 200d Moving averages(green line): b) The Bollinger bands are showing an expansion (aka widening) but to the bottom, as the price is trading on the lower BBands, also indicating strong selling pressure for the short to near term: 3️⃣ Watch the News Bitcoin has been coming up in many seemingly "bullish" articles. This is usually a bad sign before the liquidation - create hype, and then short the market. Conclusion: I'm leaning towards a soft pump in December to soften the blow of the current correction , but not a new ATH. The next increase will likely be a "fake-out" before the real bearish season starts in the new year.The daily is still looking bearish, with 90k support barely holding. Might see a droop into the 80's before a bounce:Expecting a drop to $85k soon. Notice how, during a bearish trend, the price trades on the lower BBand and when it recovers, it recovers to the basis. Therefore, as the price recently recovered to the basis, the next is likely the lower purple which places us around 85k in the next few days:A further drop is seeming more likely. It's likely the price might increase to 90k before moving to 70k, where we can expect another bounce back up towards the basis of the BBands. The only thing that might indicate a reversal, is a weekly close ABOVE the basis of the BBands, which we're nowhere near seeing at the moment.
بهترین استراتژیهای ترید ۲۰۲۵: رازهای سودآوری در ارز دیجیتال!
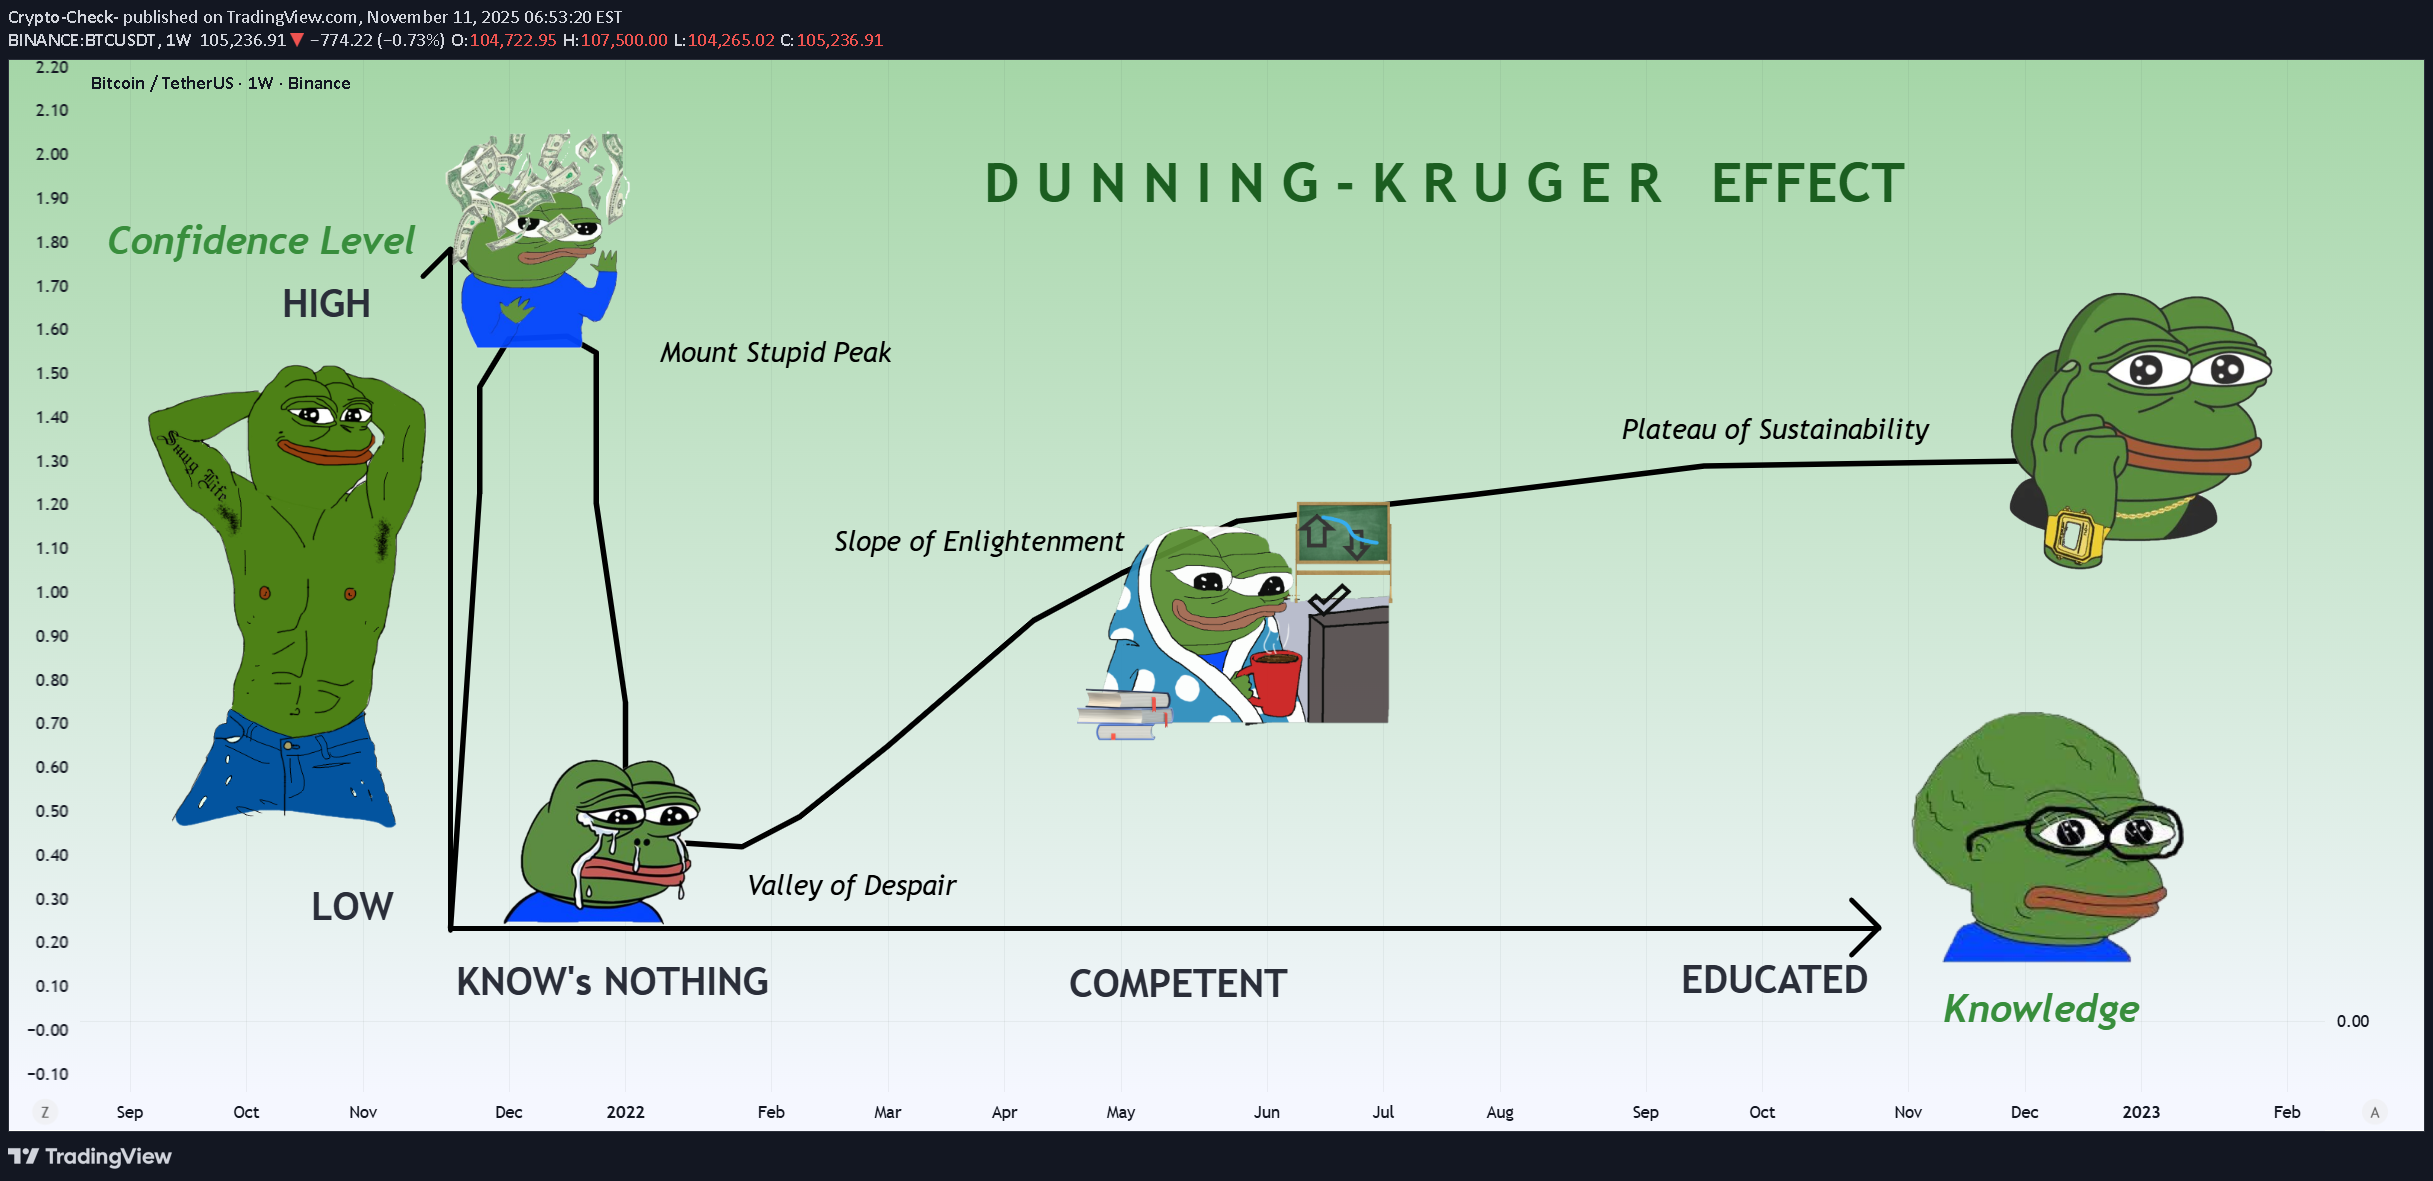
New Year loading 🥳🥂 Setting up your trading technique and sticking to it The Dunning Kruger Effect How to trade Bollinger Bands How to Dollar-Cost-Average Spotting reliable Bottom Patterns These ideas may help you improve your strategy and become a more profitable trader. Happy Trading!Invest like Warren Buffet:See the latest BTC update here, for your reference:
نقاط خروج سود (Take Profit) هیجانانگیز ارز آلگوراند (ALGO/USDT) | مسیر صعودی در انتظار است؟
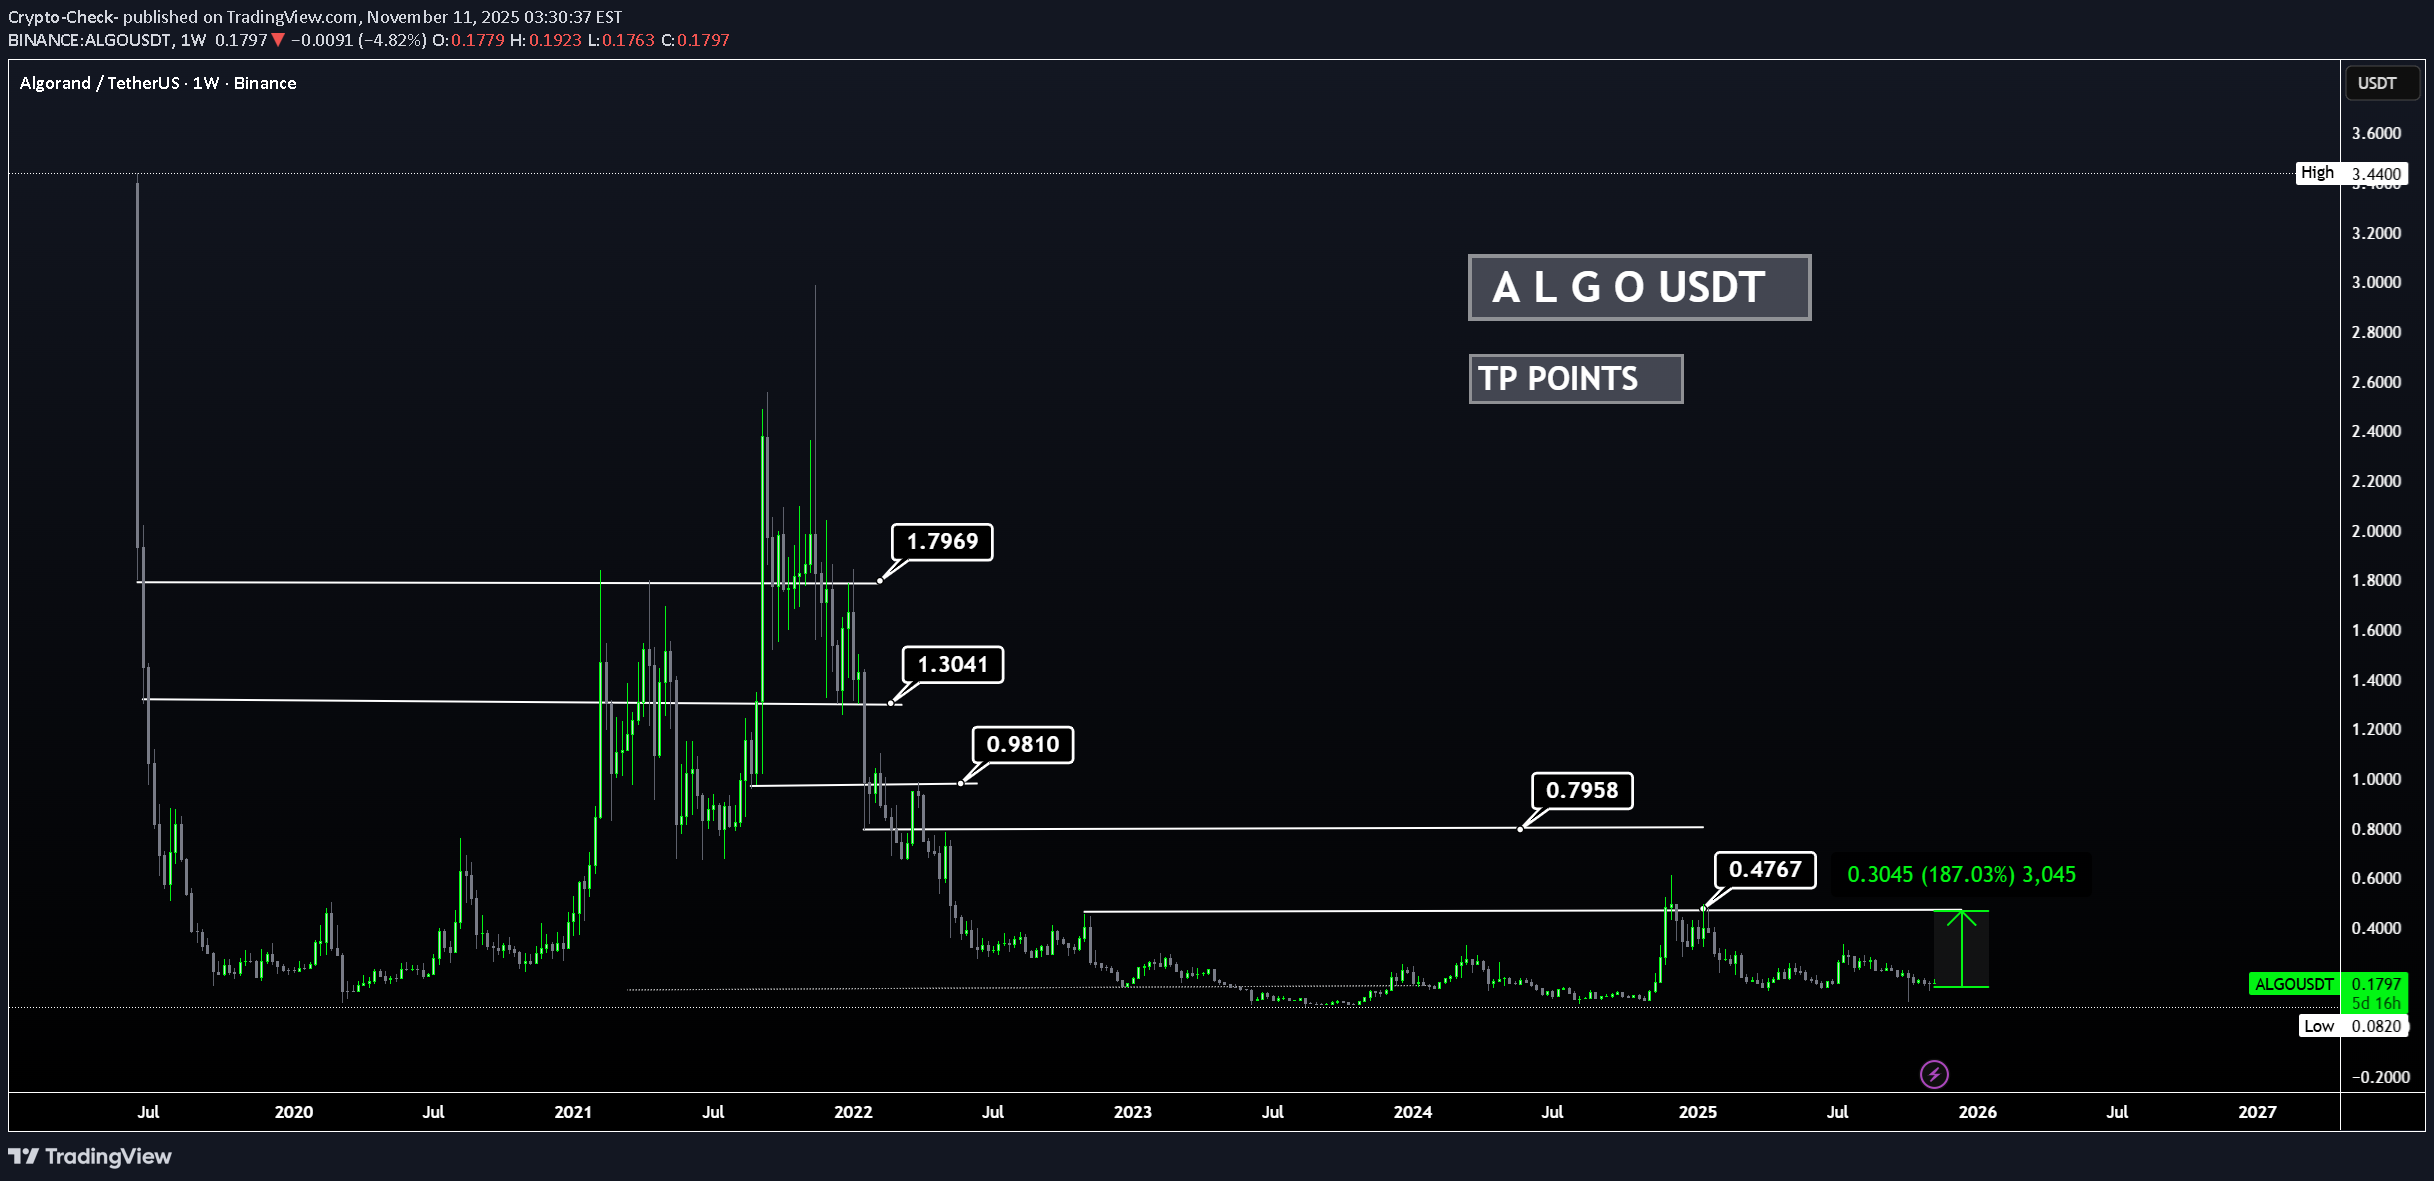
Hi Traders, Investors and Speculators of Charts📈📉 New Year 2026 loading....🥂🥳 Algorand is a decentralized network built to solve the Blockchain Trilemma of achieving speed, security, and decentralization simultaneously. Algorand is designed to be a payments-focused network with rapid transactions and a strong focus on achieving near-instant finality which aims to be processing over 1,000 transactions per second (TPS) and achieving transaction finality in less than five seconds. As a public smart contract blockchain that relies on staking, Algorand is also capable of hosting decentralized application (dApp) development and providing scalability. Rising gas fees on Ethereum have led many dApp developers and decentralized finance (DeFi) traders to look for alternative blockchain solutions. Algorand is capable of managing the high-throughput requirements of widespread global usage and a variety of use cases. Technical Chart Analysis: Algorand is still "in prison", but holding the 50d Moving Averages is the first step towards a new bullish cycle. Look at all of this upside potential! Technical indicator Analysis: If ALGO can get back ABOVE the 50d moving averages (0,18), that is when we can expect to see some serious bullish/parabolic price action. You don't have to wait until then to trade algo. In the daily timeframe, there are some great setups for those who have a bit of patience, with low buy and high sells from 15% - 30% over a few weeks (in both shorts and longs). Tis market is still moving, even though it doesn't neccesarily seem like it from a macro outlook.ALGO is not looking up in the short term, and the BTC dip is definitely not helping. I'm expecting a bounce here, or at least a hold, for both ALGO and BTC for the short term:It seems to be the same kind of pattern more or less during the bearish trend with ALGO (aka, when the price trades under the moving averages). The price corrects up to the first or middle moving average band, then falls from it's higher highs to make a lower low than before. This will keep happening for as long as the price is under the moving averages:
لایتکوین 2026: آیا LTC پتانسیل انفجاری یک آلتکوین بزرگ را دارد؟
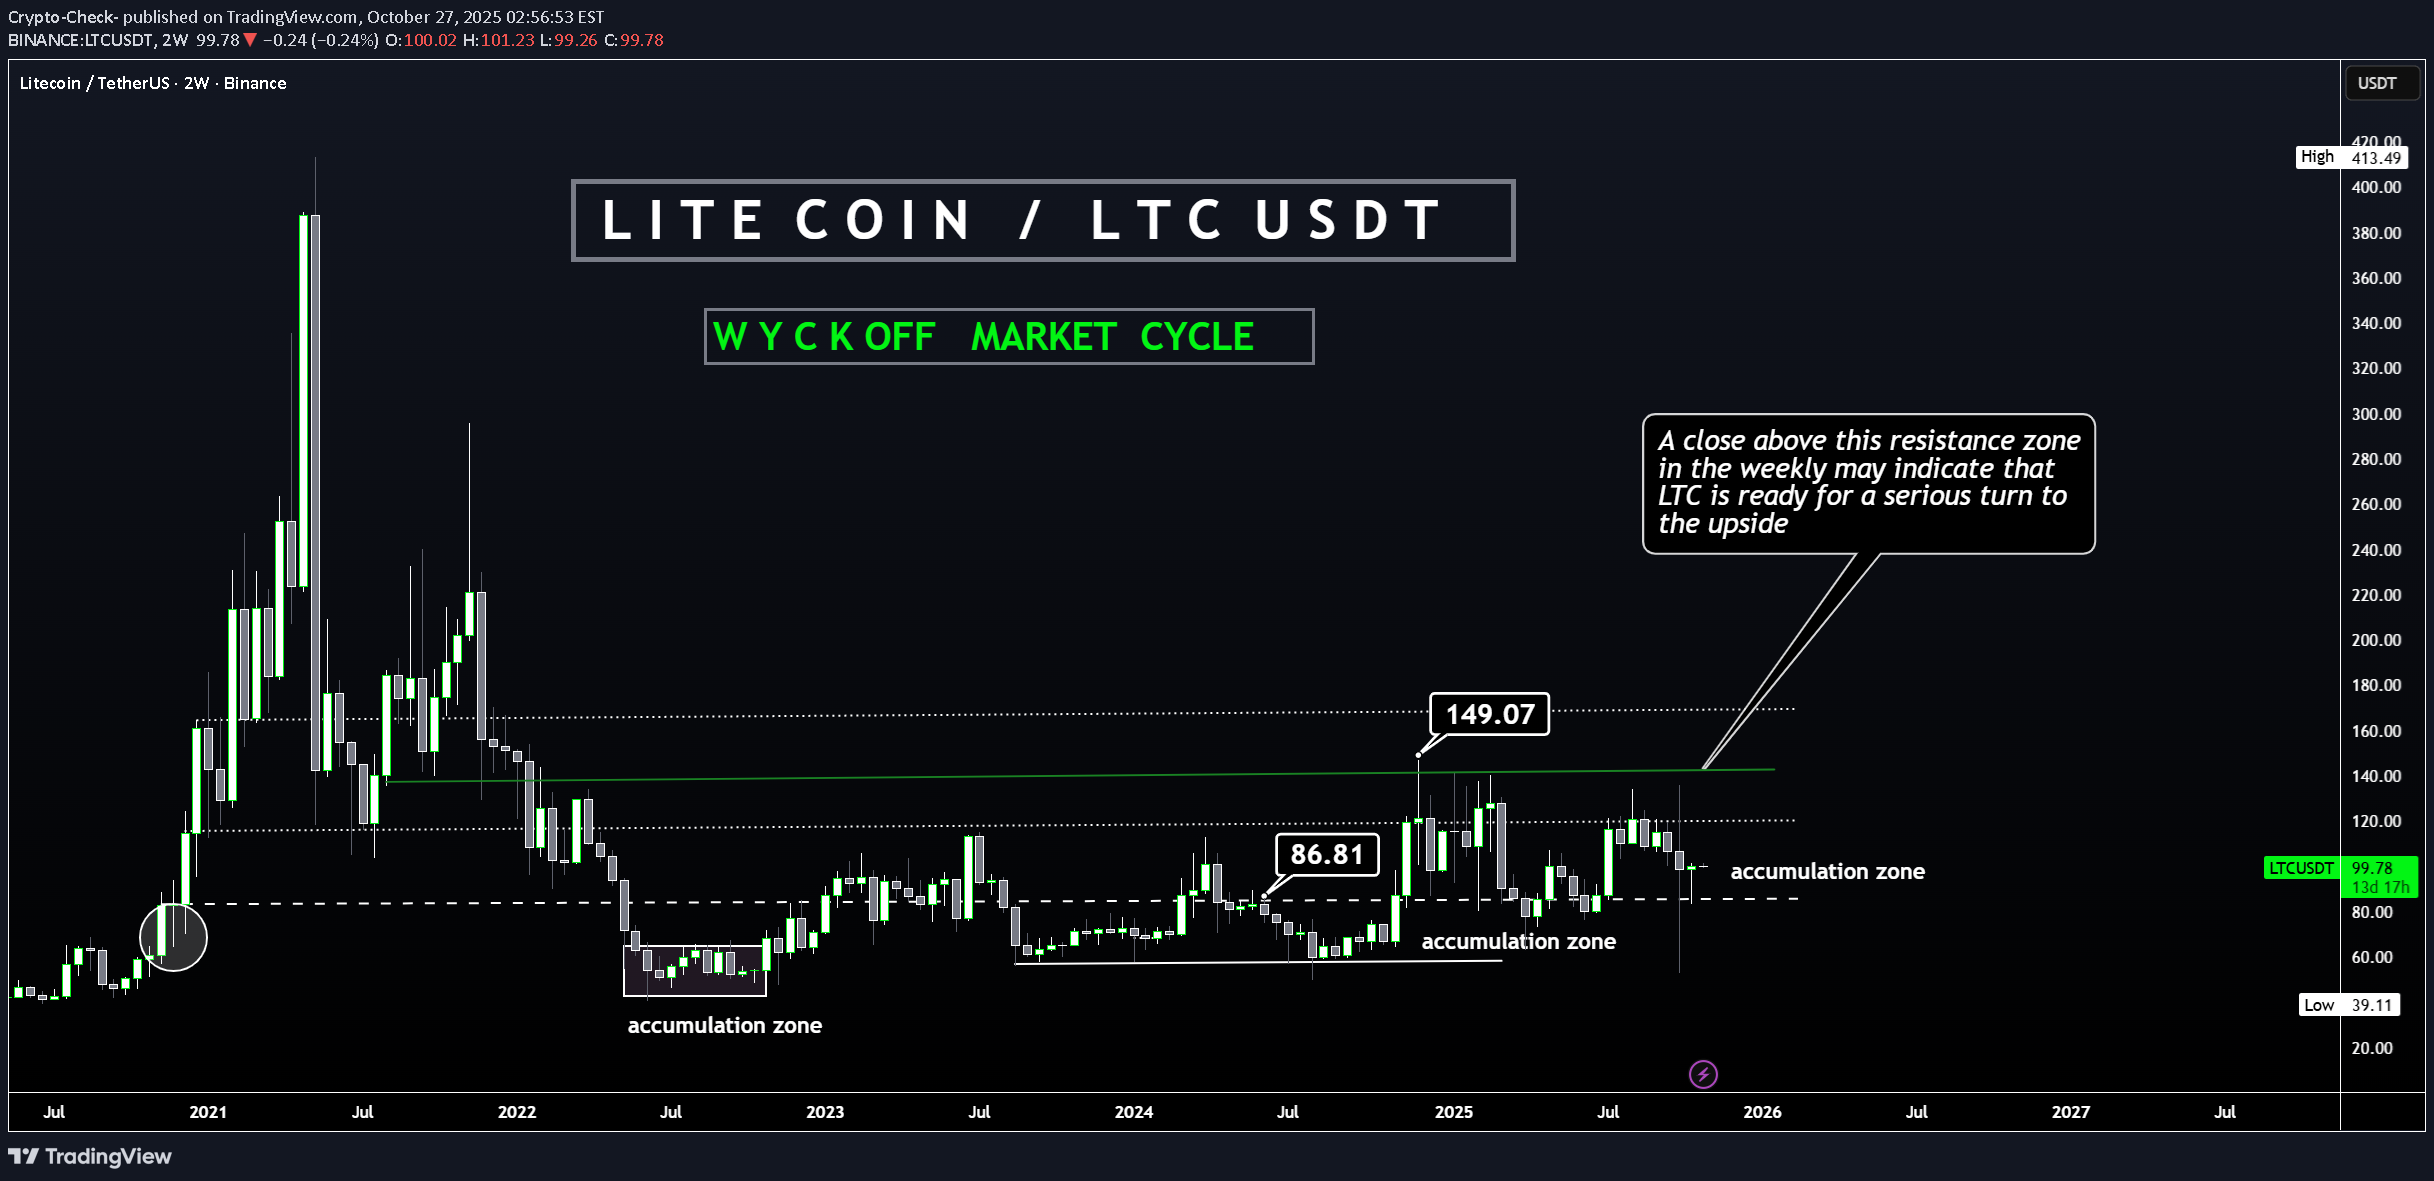
Hello Traders 📈 LTC / Litecoin may still present great opportunities for 2026. From a bigger perspective, it may seem like LTC doesn't move much. But if we zoom in, we see massive bounces over the course of 3-4 weeks which presents big opportunities if you can buy in low: From a technical indicator perspective, in the 4h LTC is still trading UNDER< showing that bears are still in control: In the daily, we still see the same story however there seems to be a bullish W pattern appearing. As soon as the price reclaims the MA in the DAILY timeframe , that would be the first positive indicator of more upside: For the short term, we need to see LTC trade ABOVE ALL the 4h moving averages in order to begin anticipating a bigger move up.From the monthly, a Bearish M-Pattern has nearly been completed - meaning we could fall a little lower before moving back to the upside in the near term:I would not want to see LTC lose this support zone. Two options for the short term I see likely, depending largely on what BTC does in the next 2 weeks. Keeping in mind BTC is generally bullish in Decembers:Quick update on LTC, price is falling further underneath the moving averages. For now, the short and near term still seems bearish, this might be an opportunity to accumulate at lower prices:
رازهای سرمایهگذاری وارن بافت: راهنمای جامع سبک افسانهای او
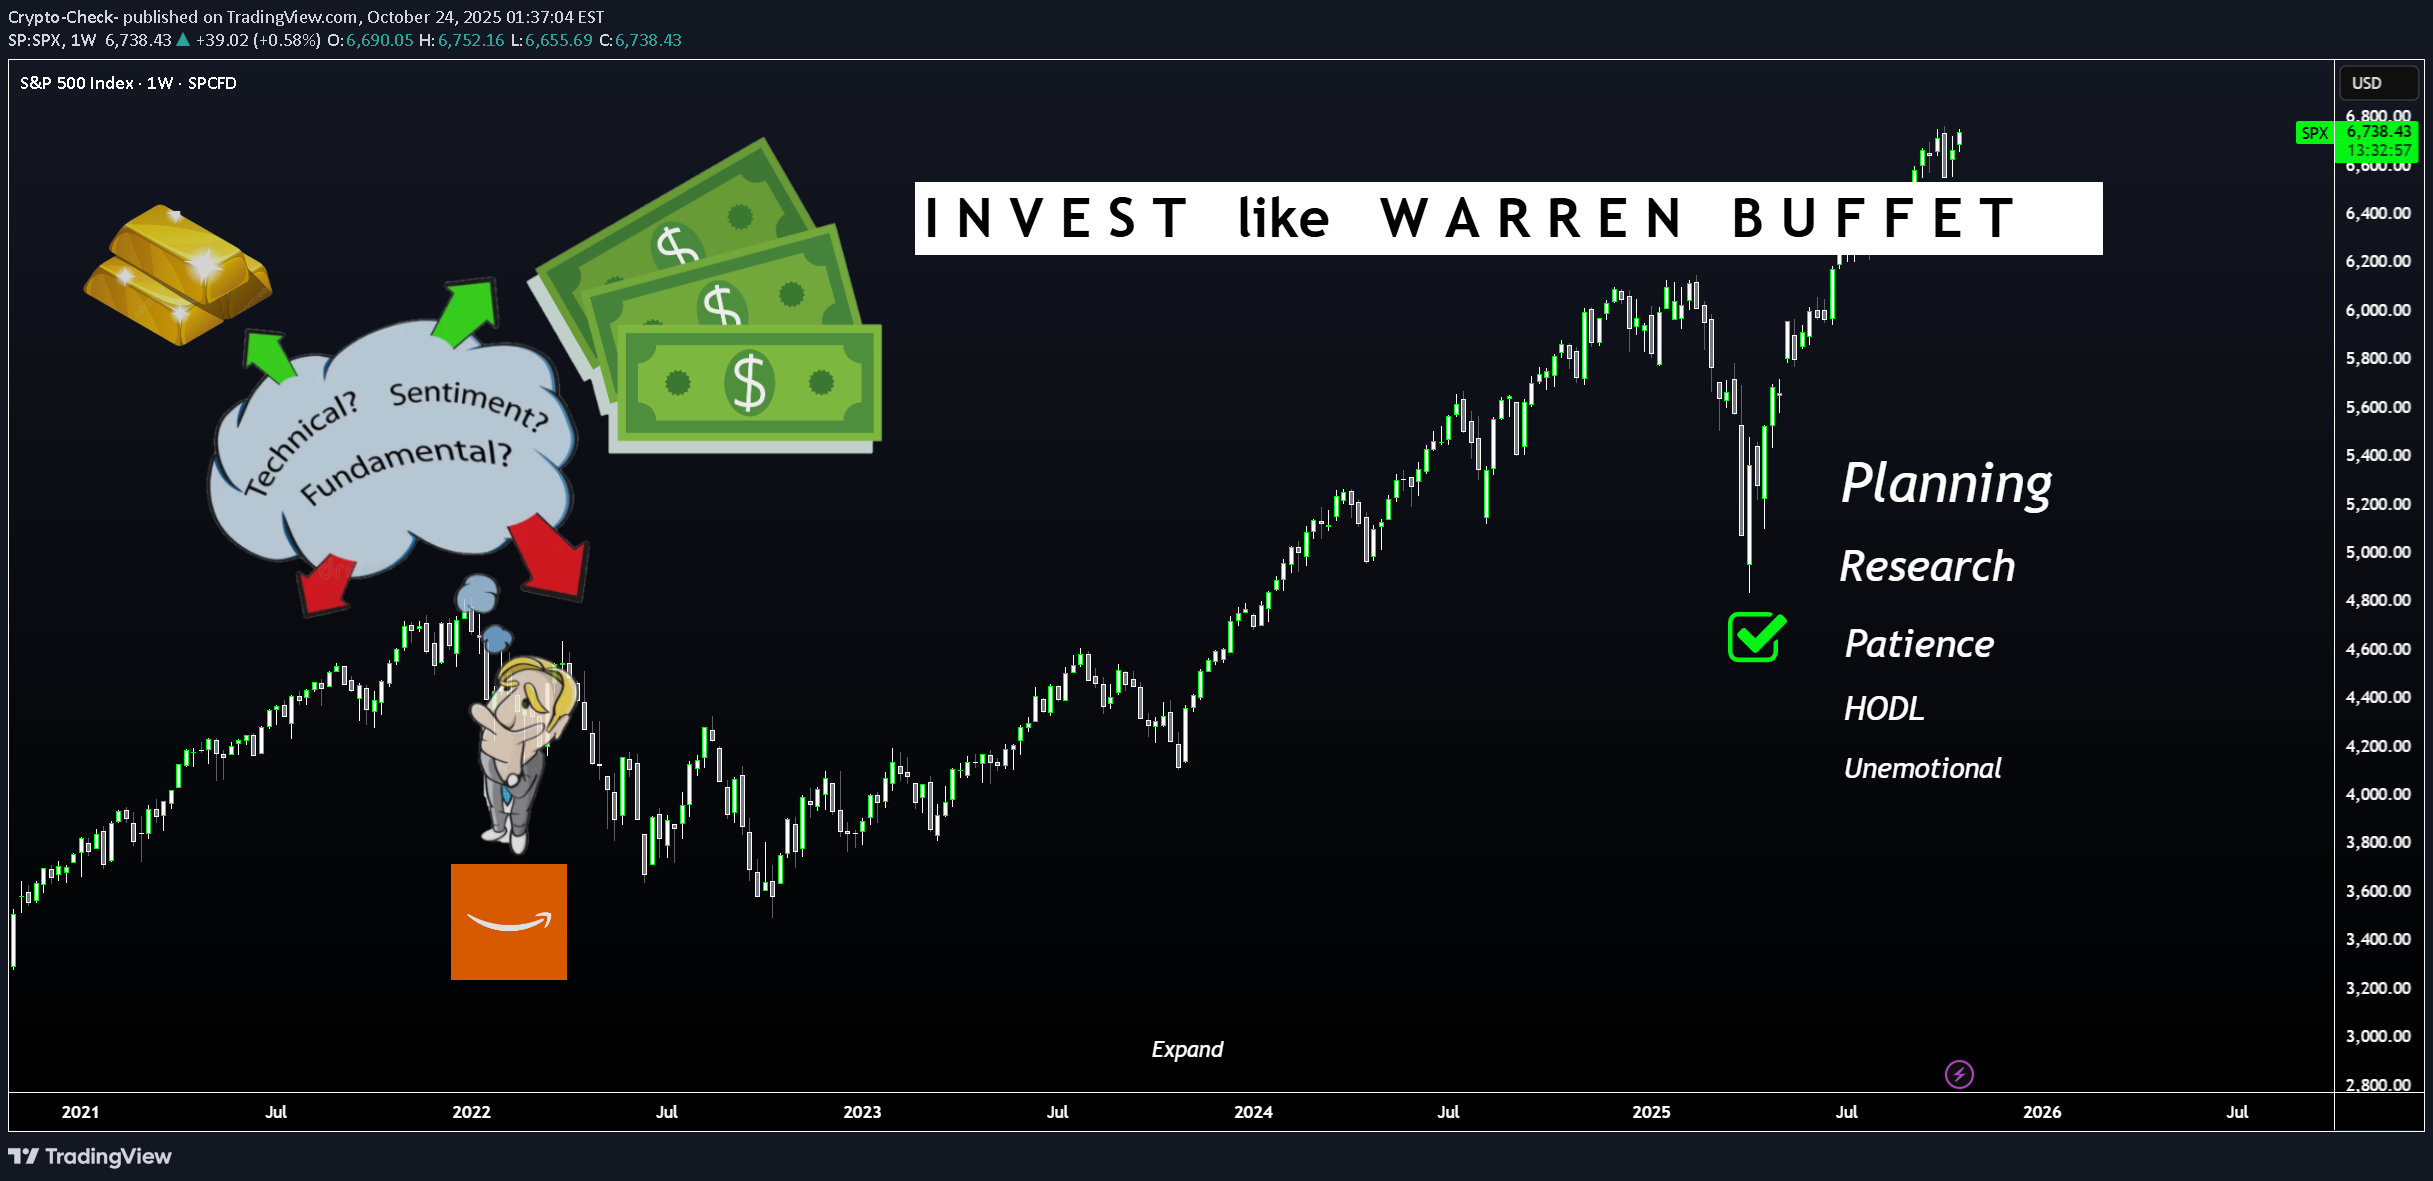
Hello Stock Traders and Speculators 📈📢 If you trade and or watch stocks, commodities and/or ETF's then this one is for you! Warren Buffett is probably one of the most successful investors of all time. Over the years, he has developed a set of principles and strategies over his career. He was inspired by the teachings of key financial thinkers like Phil Fisher, Benjamin Graham and Charlie Munger. Phil Fisher Fisher’s approach focusses on quality companies with long-term growth potential, emphasizing focused portfolios and long-term holdings. He believed in gathering information about a company beyond what’s readily available. His lessons on maintaining a focused portfolio and committing to long-term holdings are clear influences on Buffett’s patient, value-driven investment philosophy. Benjamin Graham Known as the father of value investing, Graham’s core principle was to buy stocks at a price lower than their intrinsic value, creating a margin of safety (MOS). This strategy helps mitigate risk and increase the likelihood of future gains. Buffett absorbed Graham’s teaching on finding stocks that are undervalued and buying them at the right price— definitely a large contributor of his investment success. Charlie Munger Munger is Warren Buffett’s long-time business partner. He introduced the concept of economic moats, which refers to a company’s long-term, sustainable competitive advantages. Munger advocates investing in businesses that can fend off competition and maintain profitability over time. This philosophy drives Buffett’s focus on companies with strong market positions and solid long-term potential, favoring these over shorter-term, speculative opportunities. Buffett's Investment Approach 1 - Buy for the Long Term. Buffett’s strategy emphasizes identifying companies that can consistently perform well over long periods. He holds stocks for years, or even decades, often looking for opportunities where other investors may overlook value. 2 - Buy at the Right Price. Buffett is known for his discipline in waiting for the right moment to invest. His approach ensures he doesn’t overpay, instead seeking stocks when they are priced below their true value, maintaining a margin of safety. 3 - Buy the Right Stocks. Buffett doesn’t just buy cheap stocks, he buys quality companies with sustainable advantages. His goal is to invest in firms with strong business models that will continue to perform well regardless of market conditions. Warren Buffett emphasizes investing in companies with simple and clear business models, ones that fall within his circle of competence. He prefers to thoroughly understand the operations, products, and long-term prospects of a company before making any investment. This principle is combined with in-depth analysis of how the company operates and how sustainable its valuations and future growth prospects are. If a business model is too complex or outside his expertise, he avoids it. He prioritizes companies with integrity and transparency in their management. He believes in backing leaders who are passionate, have strong vision and execution capabilities and who use shareholder funds wisely. Trusting management to run the company effectively, with efficiency and accountability, is critical for long-term success in Buffett’s eyes. Investing in quality companies isn’t enough—Buffett also insists on buying them at attractive prices. He maintains a strict discipline of buying with a margin of safety, ensuring the price paid is lower than the company’s intrinsic value. This means waiting for opportunities to buy great businesses at fair prices rather than settling for fair businesses at attractive prices, which may not perform well over time. Buffett has made many of his lessons and strategies available to the public through his letters to shareholders and partnership letters. These documents offer insight into his investment approach, decision-making process, and lessons from both successes and failures. There are several key books that capture Buffett’s life, philosophy, and strategies in greater detail: 📚Warren Buffett’s Ground Rules 📚The Warren Buffett Way 📚Buffett: The Making of an American Capitalist 📚The Warren Buffett Portfolio 📚The Snowball: Warren Buffett and the Business of Life Each of these resources provides a comprehensive look into the mind of one of the most successful investors of all time. Personally I've read Buffett: The Making of an American Capitalist by Roger Lowenstein and it is fantastic.
Disclaimer
Any content and materials included in Sahmeto's website and official communication channels are a compilation of personal opinions and analyses and are not binding. They do not constitute any recommendation for buying, selling, entering or exiting the stock market and cryptocurrency market. Also, all news and analyses included in the website and channels are merely republished information from official and unofficial domestic and foreign sources, and it is obvious that users of the said content are responsible for following up and ensuring the authenticity and accuracy of the materials. Therefore, while disclaiming responsibility, it is declared that the responsibility for any decision-making, action, and potential profit and loss in the capital market and cryptocurrency market lies with the trader.