Technical analysis by Crypto-Check- about Symbol BTC: Sell recommendation (11/28/2025)

Crypto-Check-
راز گردش پول در بازار رمزارز: بیت کوین، آلت کوینها و سلطه (دامیننس)
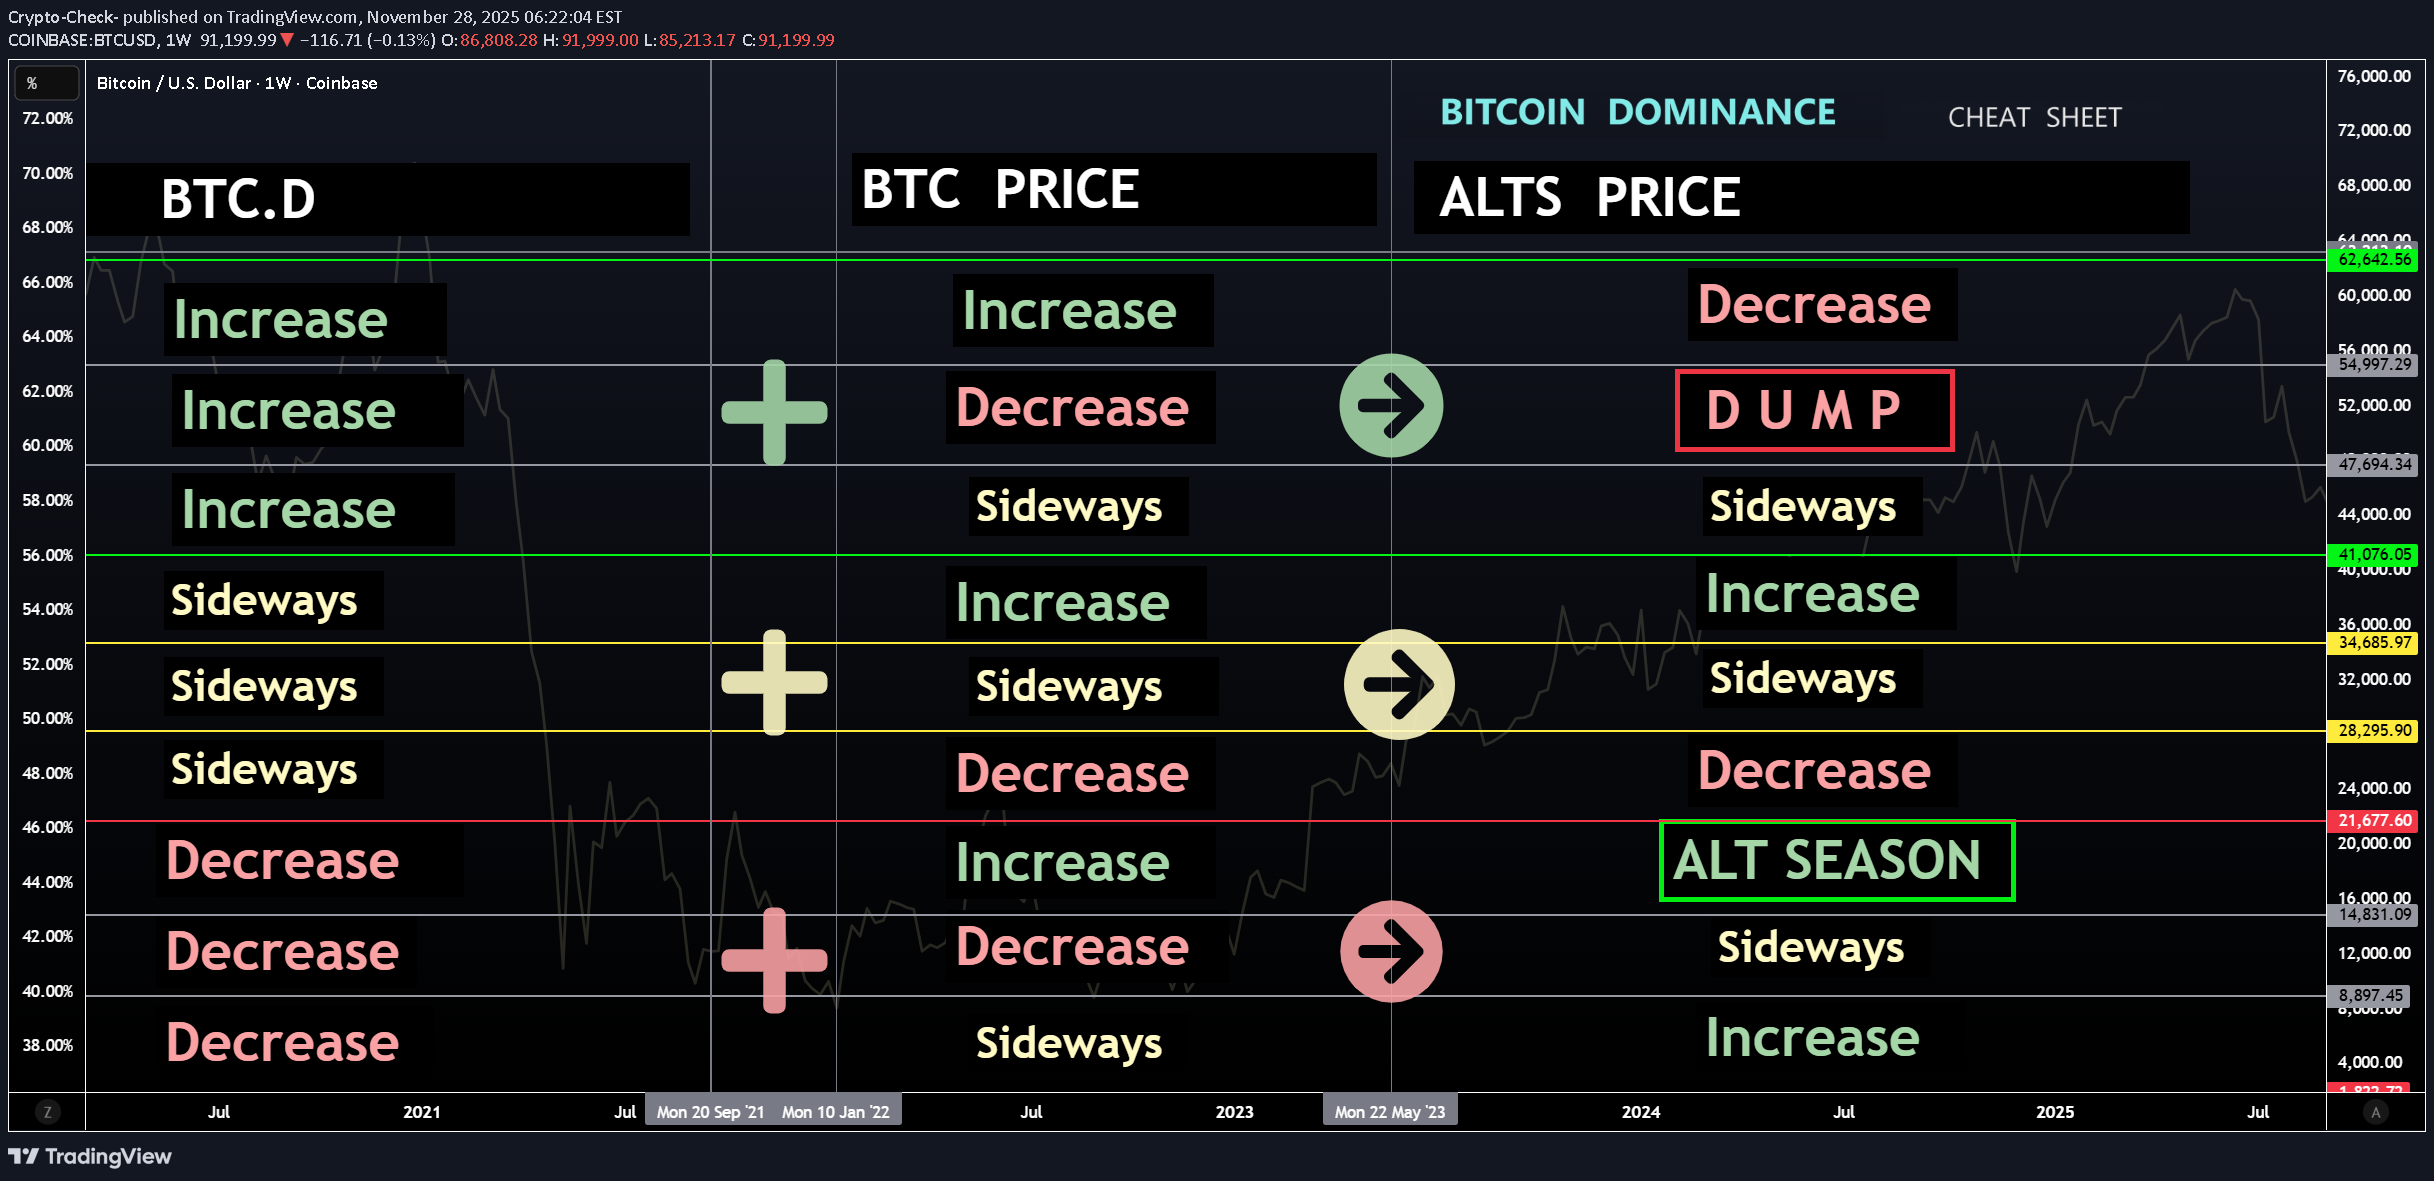
✅Bitcoin Dominance, BTC, Altcoins✅ Today, We're talking about the rotation of cash between Bitcoin and altcoins. Imagine a pie where each slice represents a different cryptocurrency. The pie here indicates the total cryptocurrency market cap of both Bitcoin and altcoins, which can increase or decrease at any given time. In other words the TOTAL chart. - If BTC market cap increases but altcoin market cap shrinks (relative), the pie stays the same size. - If BTC market cap increase and altcoin market cap increases, the pie size increase and so forth. Total Market Cap and BTC.D At most of the key moments, we see a clear inverse relationship here. Alts drop harder than BTC, as this clearly shows. But during the cycle, investors hop on and off, injecting money into the ride (buying) and taking it out (selling). This constant movement is what keeps the crypto markets going. Let's break it down with visuals: Chart 1: Bitcoin This rollercoaster represents Bitcoin's price action, and also my view on where we are in the current cycle. (I believe we're in a multimonth correction, followed by the last impulse wave up probably close to XMAS 2025 as usual). You'll need this to know where we are in the cycle right now: Chart 2: Bitcoin & Bitcoin Dominance This chart shows Bitcoin's dominance, which is basically its share of the total crypto market capitalization (market cap = total value of all cryptocurrencies). When Bitcoin's dominance goes up (higher on the chart), it means investors are putting more money into Bitcoin, potentially at the expense of altcoins. Conversely, when dominance goes down, it suggests capital is flowing towards altcoins. The difference is clear: Chart 3: BTC.D vs TOTAL3 In this chart, we overlay the Total 3 Priceline (BLUE) on top of the Bitcoin Dominance chart. TOTAL3 shows us all alts except ETH. The Bitcoin Rollercoaster and the S&P 500: When Bitcoin surges (line goes up), it can sometimes lead to increased investor risk appetite. This might entice some investors to move funds from the S&P 500 into riskier assets like Bitcoin, potentially causing a slight dip in the S&P 500. Conversely, when Bitcoin experiences a price drop, investors might flock back to the perceived stability of the stock market, potentially causing a rise in the S&P 500. So, is there a guaranteed CORRECTION? All the signs are proving this may be the case. By understanding the relationship between Bitcoin, altcoin prices and dominance, you can get a better sense of where the money merry-go-round might be headed.At the moment, BTC has already recovered to the 20d moving average (which is the basis of the Bollinger Bands) and is now likely wicking to the lower 70's zone next.