
ContraryTrader
@t_ContraryTrader

What symbols does the trader recommend buying?
Purchase History
پیام های تریدر
Filter
ContraryTrader
Qqq And tech sectors
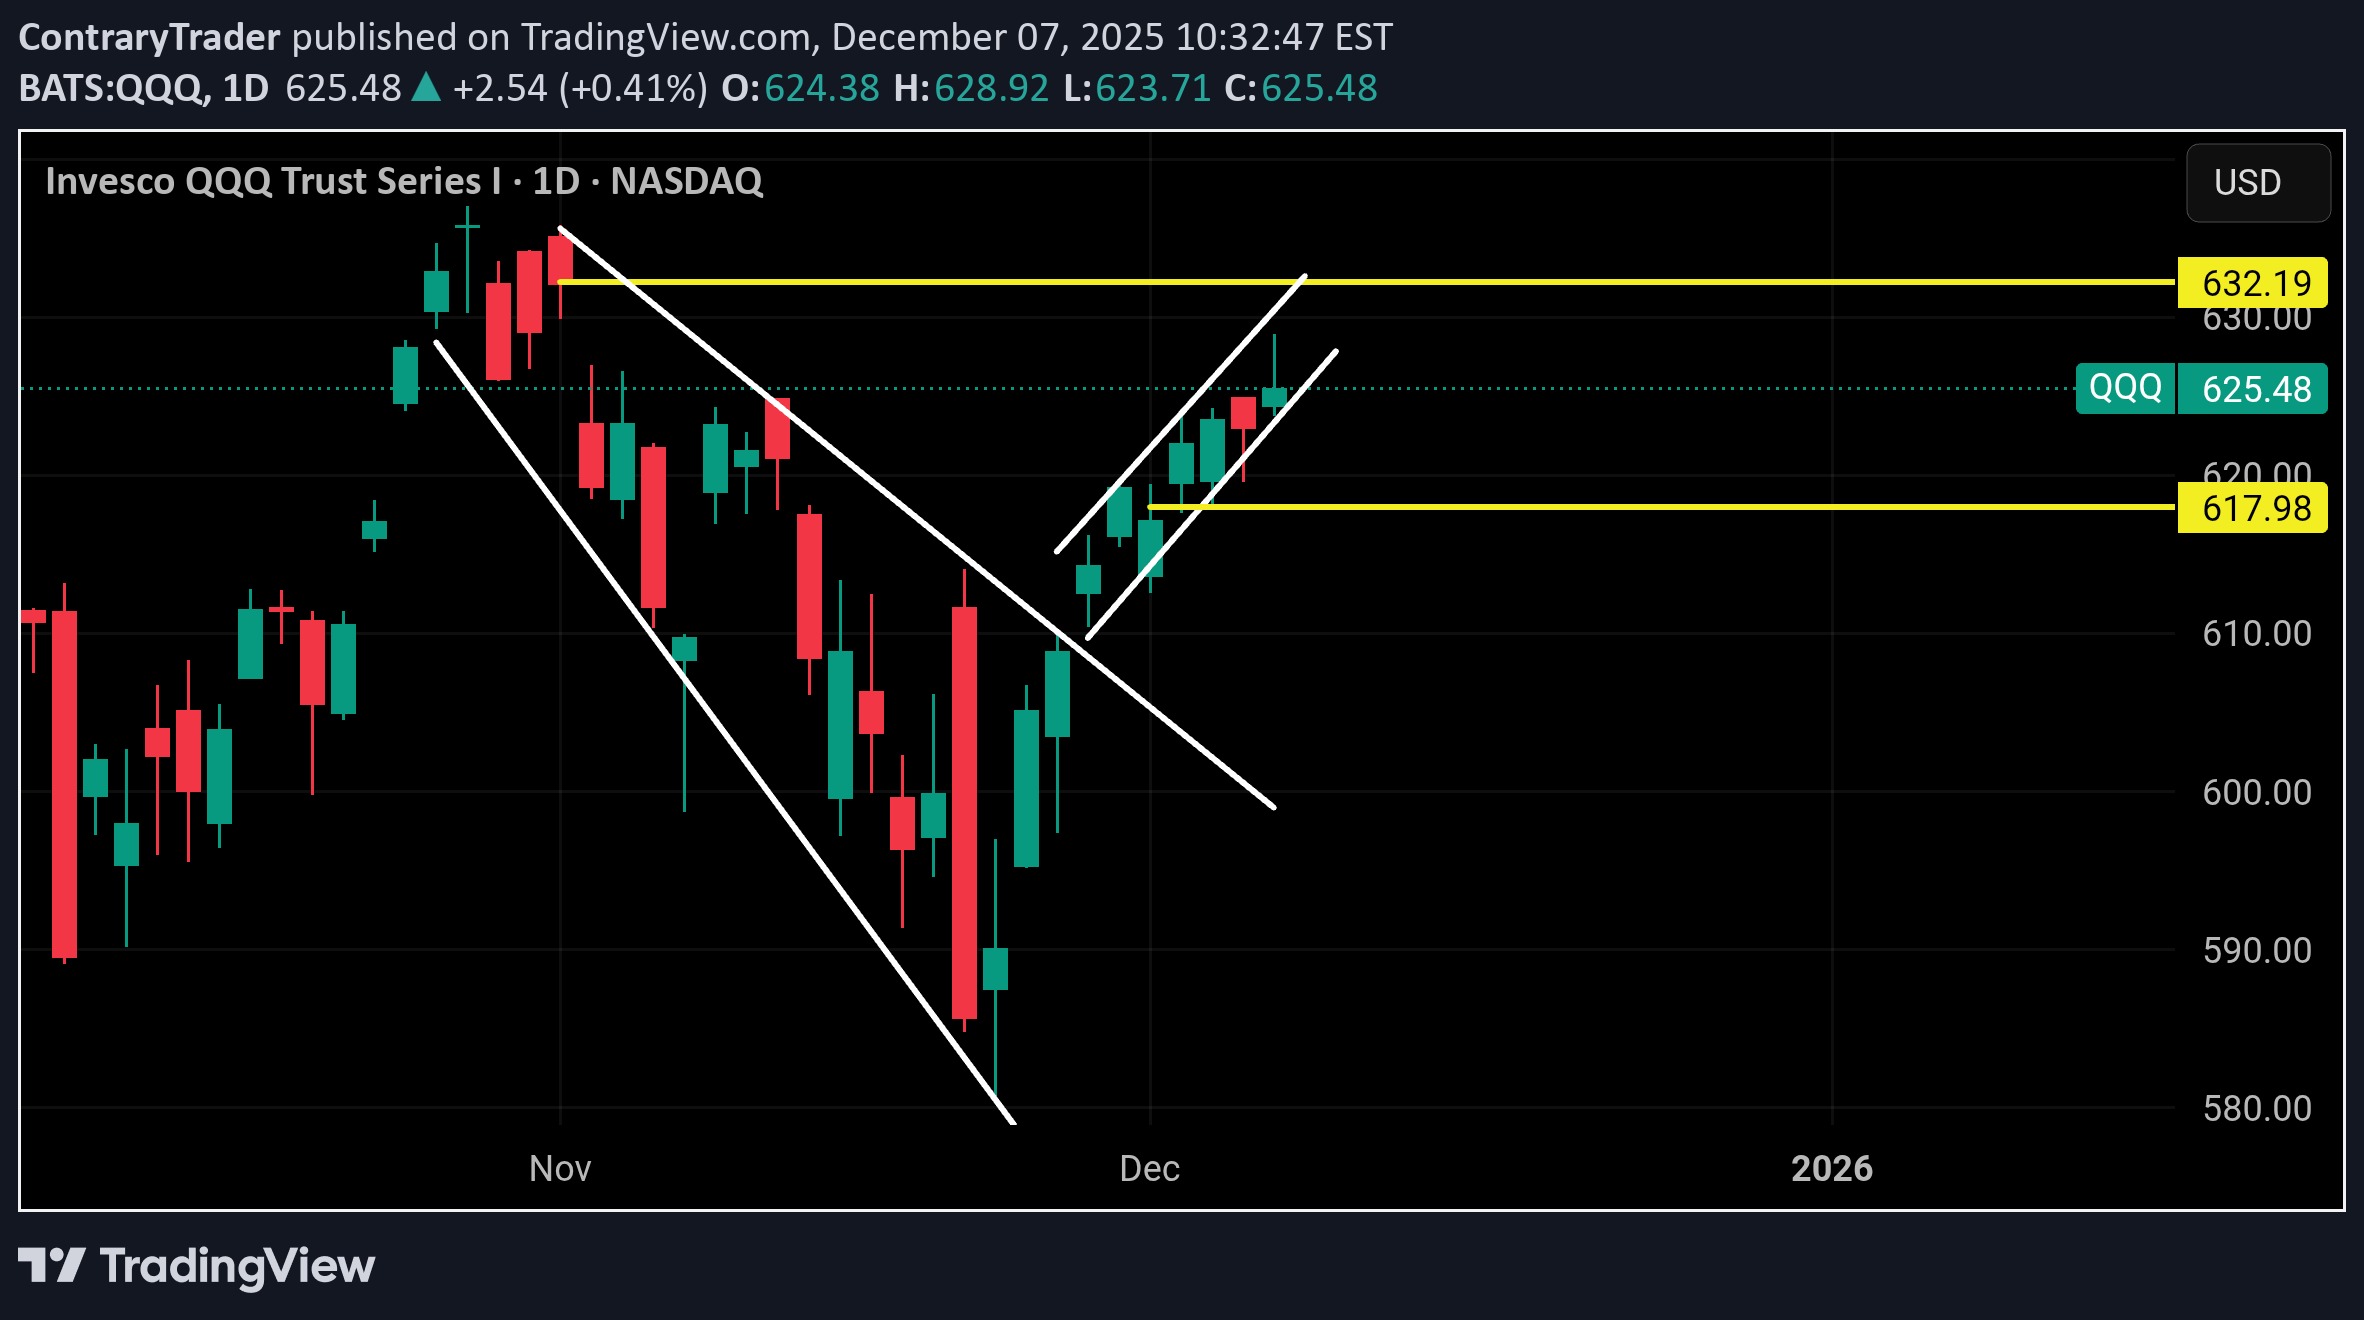
I think in the coming week we will see Qqq close gap at 632, there is a chance for a pullback to 618-620 also this week.. I'll explain below how I come to both conclusions.. First The bad : I'll start with The VIX Fallen wedge here which is bullish for the vix... looks like a minimum bounce back to 17.00 is coming this week.. Max upside if Fomc goes bad is 19.50 -20.00 or 200ma Naturally if the vix spikes you will see a pullback on equities.. If the vix spikes to 17.00 then I think we pullback to 618-620 This pullback would with a break below 622.00 Now if vix spikes back to 20.00, well that's the worst case scenario and that would put Qqq at 611-613 which provides the strongest support 20/50 sma plus price action If qqq breaks below 610 and vix spikes above 23 then the bull rally is over ! I think as long as 613 holds Qqq is going to 640 minimum and 655 max Remember at the end of the day we are dancing with the devil up here at the 15yr resistance Bulls haven't last more than 2weeks up here in the last 2yrs before a 7-15% correction I'm not showing this to confuse you, I'm showing you the bigger picture so you can understand that despite whatever bullish move that happens in the next 2weeks I don't think it sustains through the entire Dec and another sell like what we saw in Nov is around the corner.. Now on to why I feel like qqq is headed to 640-660. First off Qqq is showing a broadening wedge and it has reclaimed its summer channel A descending broadening wedge usually pushes the stock/Index back to its ATH (See iwm) and sometimes higher .. The measured moved goes like so so an 8% move up from the breakout would put Qqq at 660 or 1.618 on fib extension When you look at the 3 biggest sectors XLC XLK SMH You'll see similar bullish patterns XLC Just broke out of a bullflag in its 3 yr uptrend Bullflag wants to take this sector back to 120 minimum META and NFLX will pump XLC the most XLK Same broadening wedge as Qqq and pretty much same analysis This move up on XLK I think will push MSFT back to 510.. SMH Chips Same broadening wedge as Qqq and XLK Actually outperformed most tech Sectors because of Intc , amd and AVGO.. but I think the next leg up comes from NVDA with a push back to 190ish Now , down to the action/Tradeable analysis.. QQQ , wait for a move back above 627.00 to go long next week.. target of course is 632 Qqq has been trading for the most part of this rebound in this tight channel in white; Keep an eye out for the resistance Any opening bove 623 is neutral and you could try calls with a stop below 622.00 Things get bullish back above 627 Things get bearish below 622 with a target of 618. 622-627 IS CHOP.. Has a gap left open at 617 and the 1hour 200ma is there too . I know I said below 618 and 612 comes but they could dip for the gap close and push back above.. There is a trade I like going into this week. 1st . MSFT Weekly chart has given 3 higher lows. Daily chart is showing wedge breakout and retest I think it's headed back to 510 this month which in perspective is only a 5% upside. Above 485 take calls to 492 Above 495 take calls to 510 Simple setup.
ContraryTrader
تحلیل تکنیکال گوگل: هشدار فروش! سقوط سنگین در راه است؟
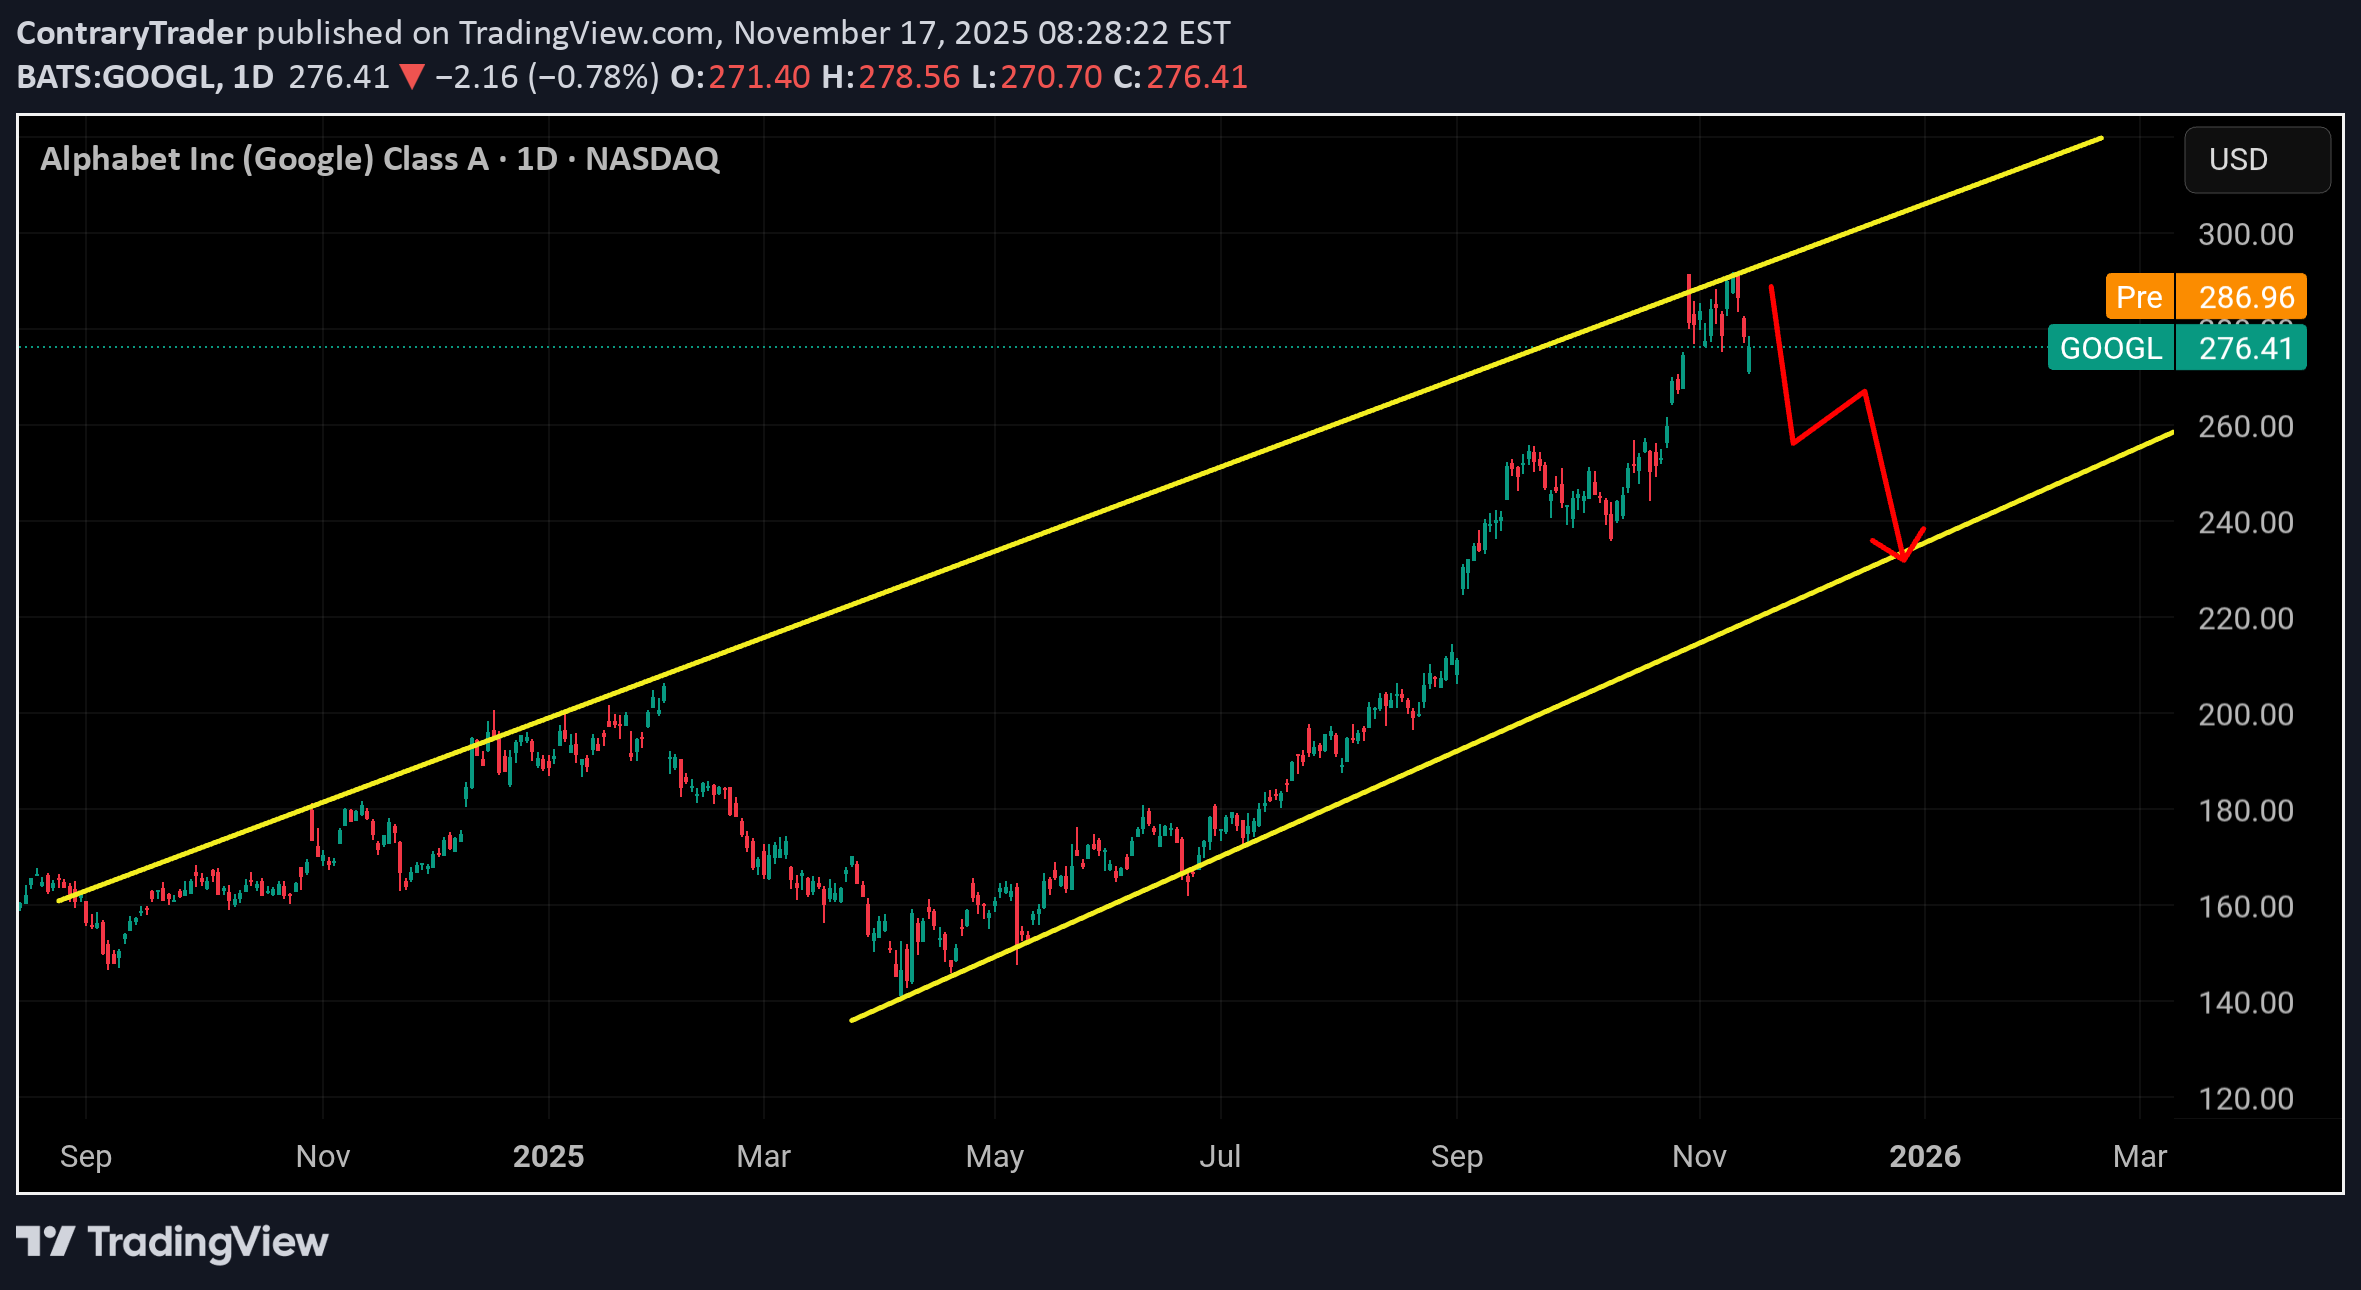
Googl finished with a weekly bearish engulfing It's first since March 2025 Currently 25% extended from its weekly 20sma .. last 3 times googl extended past its 20sma over 16% a draw down occurs Completely detached from its monthly Bollingerband; This a huge red flag! You don't chase longs up here But remember you have to trade the time frame you analyze . Since this is over bought on the monthly and I don't think this continues into Dec , your shorts should have 45-60 days minimum on the expiration. I'm expecting a pullback to 240-255 within the next 30-45 days For entry purposes, you would look for an entry near 290.. be willing to add short up into 300 with a stop loss above 300. First target would be 270 and then 250 below it
ContraryTrader
تحلیل QQQ: آیا کف حمایتی ۱۵ ساله میشکند؟ سطوح کلیدی حمایت و مقاومت
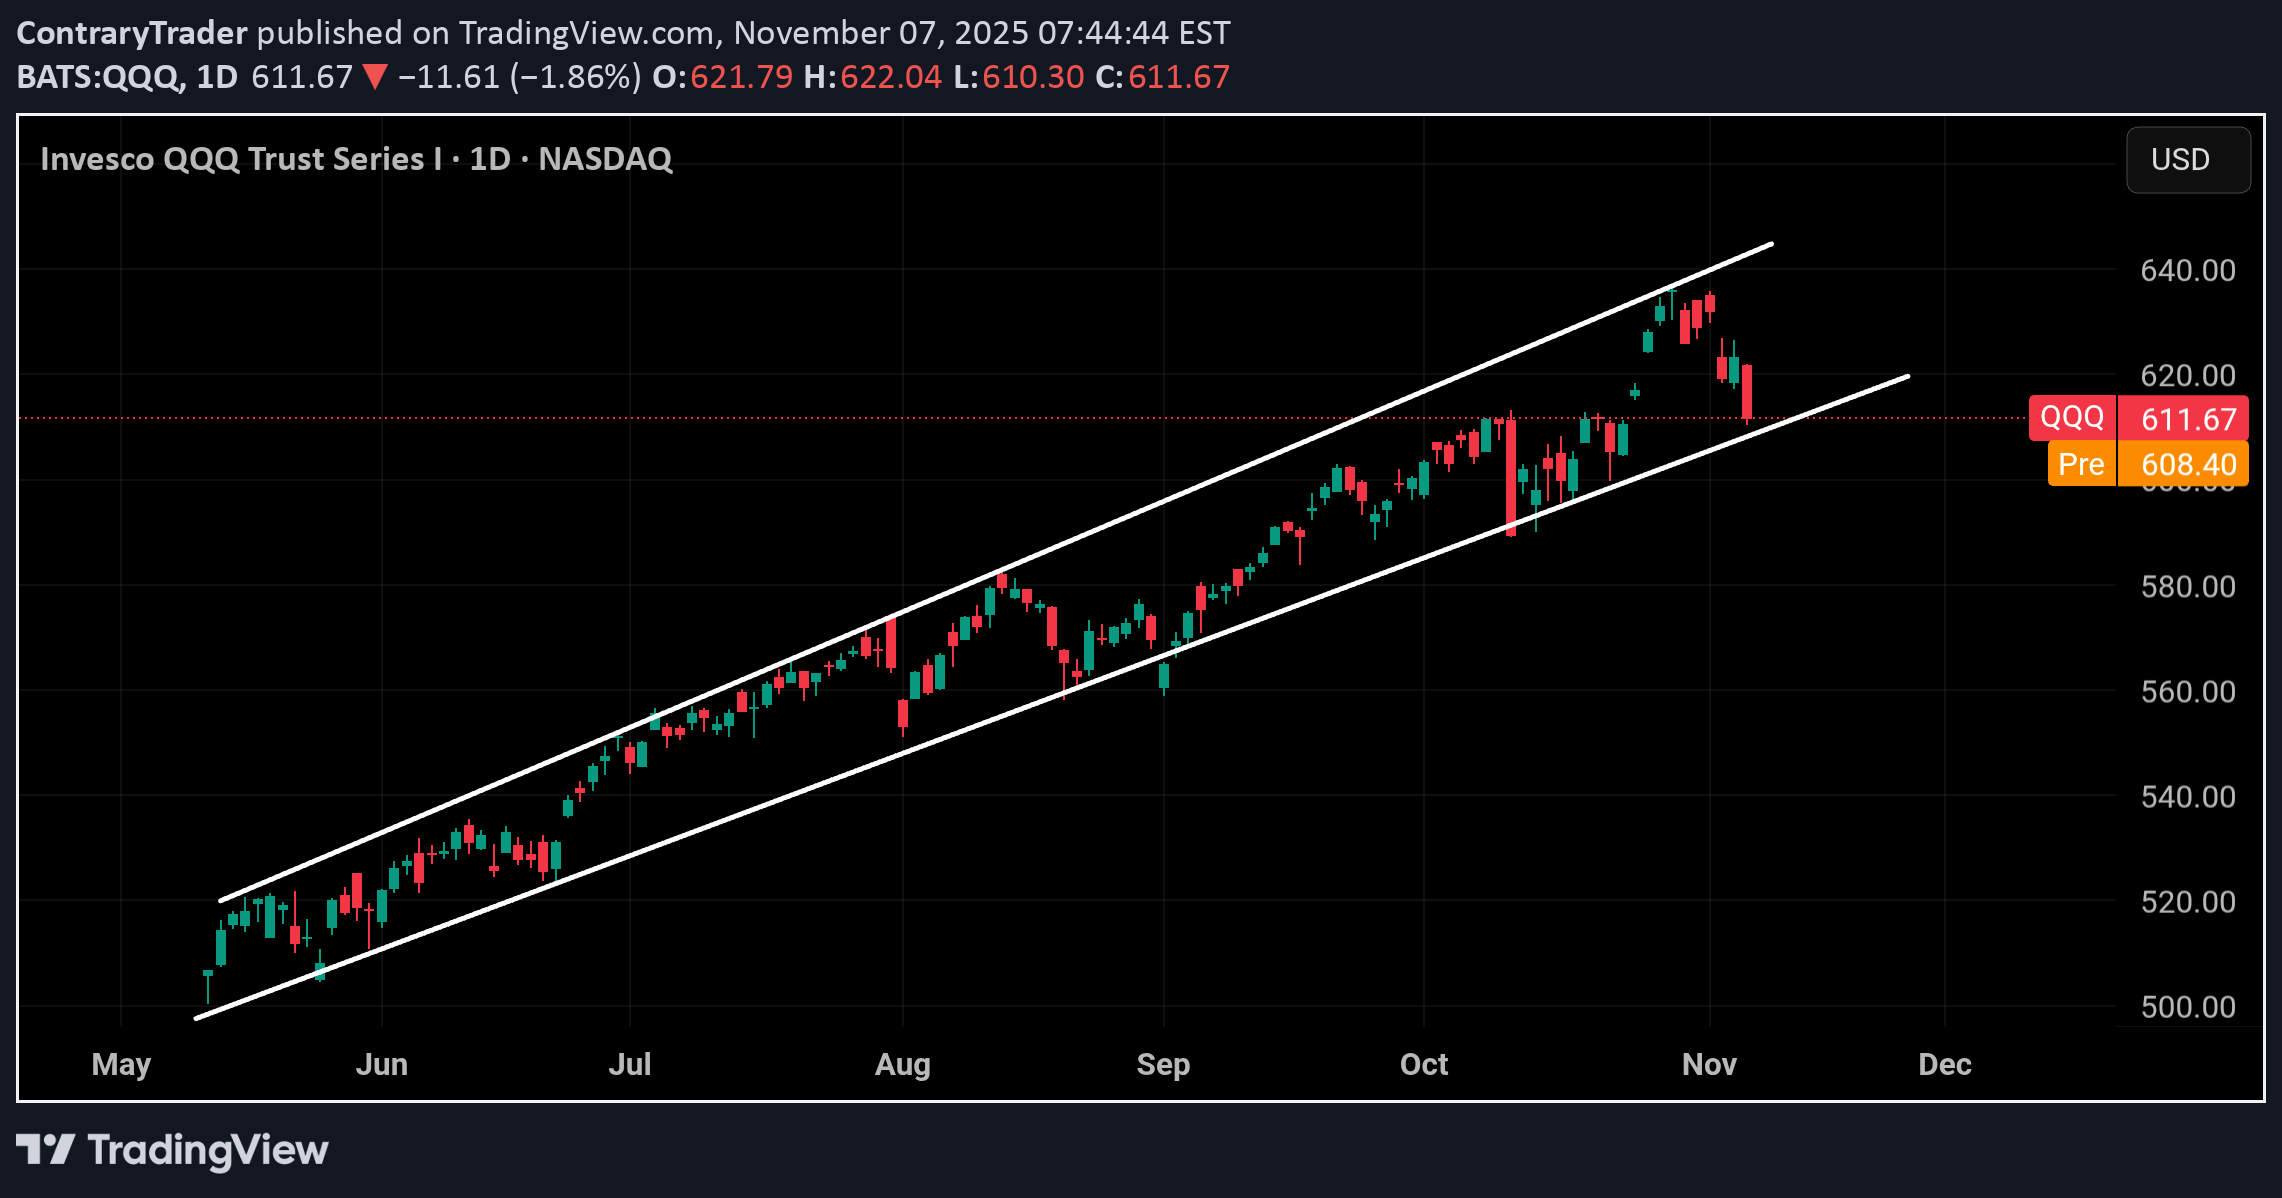
Pullback from summer channel top to channel bottom is underway and almost finished.. But go to your weekly and zoom out a decade Logarithmic Zoomed in So yes, we are at the bottom of a 6month channel but we are still at the top of a 15year trendline and I don't think we last above here much longer.. Alright so I won't go into the sectors on this one , I'll just stick with Qqq and the next couple of weeks of price action to help with direction Daily channel Bottom of this channel is 609 Now here comes the actionable analysis Strong fib support and price action at 607 1hour 200sma is at 612 and Fib resistance is at 613.. that will be your resistance So 607-609 is support and 612-614 is resistance.. Don't overthink this.. Below 607 and 600 comes (50sma).. I think a break below 607 may come next week. So if you want to short either wait to see 606 or wait for a retest 0f 612-614. Shorting here near support is stupid and stressful. If you want to scalp the dip, I'd buy and 608-607 with a stop below 606.50.. target is 612.. Strong long only comes above 620, the we will tag 626.. Now here's my opinion on how long I think this will go on and how deep we can dive. I think 589 gap close is the target for this pullback here, but that only comes with a break of 600. I don't think we will cut straight through 600 either. Most likely a nice bounce comes there. From 589 we should have a rally back to 610 minimum. You want to know if we will get another high this year? Like I said earlier we are at the top of a 15yr trend which we've been grinding higher on A.I Deals/News. If we don't break below 607 by late next week then I would consider this pullback over and done but 607 is key. Good luckQQQ bounce should finish up to here near 626-628... From there I think we reverse back down but we will need to break back below 616 to be fully bear. Over 629 and they will push this to 635Delayed Economic data should come late in the week that could be a catalyst
ContraryTrader
پیشبینی سقوط QQQ: تحلیل تکنیکال کامل با سطوح ورود و خروج
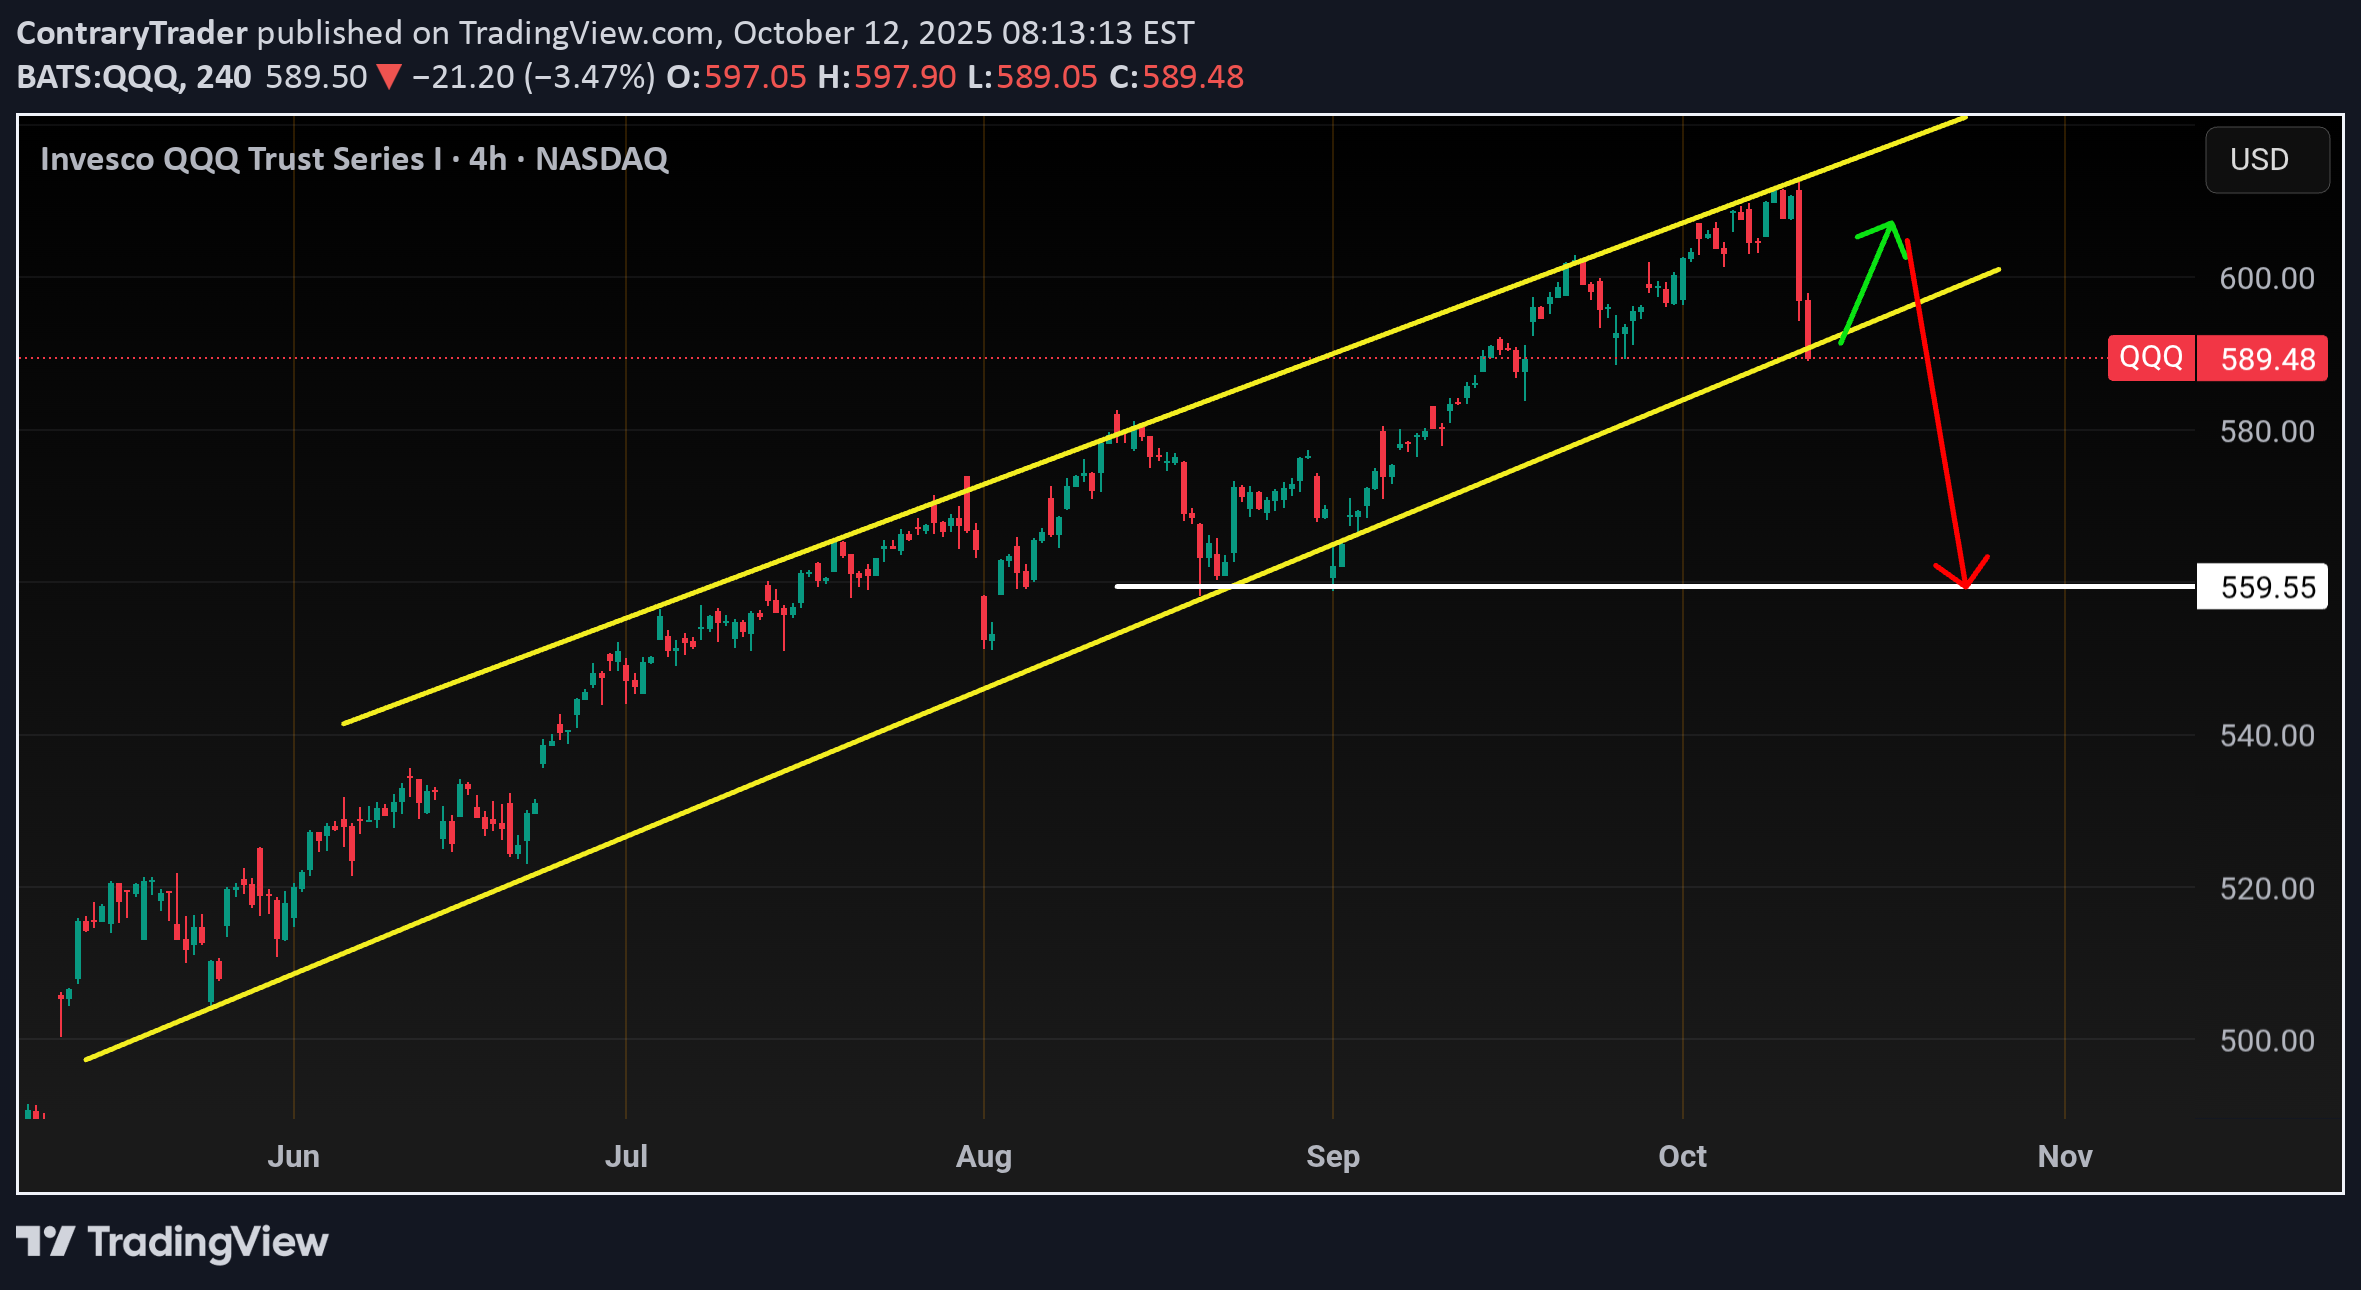
Been awhile since I went over Tech.. Let's start off with a bigger picture Zooming out you can see that we've tagged our long term resistance since sept Zooming in but staying on the weekly You'll notice the reversal weekly bearish engulfing and also the volume.. The candle alone is is nasty, but that volume is a bad. The most volume we've seen since april rebound and it's bearish.. So with that being I think are headed back to 558 minimum. And also I think this moves happens before November 1st. Nov to late Dec normally isn't to kind to bears and also we would be in the middle of tech earnings so I don't like to short the market during bullish Seasonality + earnings season. So Let me show you my steps one by one how I come up with my tech homework/trades Step one Identify where your Moving averages Price action Fib levels are Start on daily time frame I like to use my 20/50ma The 20ma resistance will be 599-600 The 50ma support will be 582 Next I add the fib levels on my chart starting from all time high and going back lower to that launch pad at 558.. some people go back further and lower than 558 but those levels aren't ACTIONABLE for day trading or swinging weeklies. I need to know where proce can go for the next 3 sessions or next 3% So fib levels confirm the moving average levels As you can see 601 .786 fib level will match up closely with the 599 20sma Resistance The 579 .382 will match nicely with the 50sma When I say match , what I mean is let's say I short Qqq on a rebound at 599, I would be will to add another put all the way up to its next resistance at 601 if needed and then I could place a 20% loss behind 601. Similar to if I was to buy calls at 582 50sma for a nice bounce, I would be willing to add more calls all the down to 579 gap close or .382 fib with a 20% stop below that.. This method of positioning gives you a back up plan and prevents paper hand trading. Lastly let's look at just price action and trend lines.. For that we'll have to go down the hourly time frame (2hour chart) Some people would argue upon seeing this trendline retest that it's a great buy area, and I would agree short term it may bounce but being up at the weekly trendline I think this summer uptrend gives way this week or next. 1hour chart This is where I just look at price action and volume. I look for areas with a lot of traffic and heavy volume . Going into next week you can see its alot of support at 588 and I circled in green the previous volume that came into that area. Overhead resistance will be the 200sma at 592 and support at 588.. over 593 and 596 comes but I expect Choppy early on between 588-592. For a short I would only look for it below 586.00 , I know 588 is support but this is why fib levels are important for me. 586 is fib support so unless it breaks that then you may get a bear trap dip to 587 then launch back up.. only bearish below 586!!!!!!! tradingview.com/x/FB1JbZDO. What I think will happen this week is a bounce back to 596 minimum and 600 max before we head lower, so unless we gap down below 586 then the move is likely to be upwards early on. If the market gaps up early Monday then wait for a pullback or fizzle out to by calls for a Tues or Wed pop higher. I think we could see a H&S play out if price pushes back to 600 But first we need a pop, in terms of day trading you never want to open short when you see the indexes hourly RSI and Bollingerband oversold. With the exception off thee Qqq idea .. the other trade I like is NVDA calls for a pop back to 190 Pullback to retest rectangle breakout here at 184.00. I like calls above 185, target 190. Over 190 and 194 comes but have a tight stop over 189 incase it can't go higher. Entry Above 185 Stop loss Below 183.50 Target 190 Catch you all later , my apologies if I'm not too responsive or active lately; I've been busy. In this post I tried to show you how I come up with my idea/ conviction. I use this method on every stock I chart and it actually only takes me 10mins max to chart something and come up with a Tradeable strategy. You have to come up with a method/strategy in trading and charting, then apply this method every day.. you should be charting atleast 3 stocks a day with this method because that's the only way you will become proficient enough to make it. And staring at a chart because you are in a trade doesn't count. This trading and charting thing is more about repetitive discipline than intelligence. If you can't find 30mins a day to fine tune your charting craft then it will be difficult staying in this game
ContraryTrader
Googl
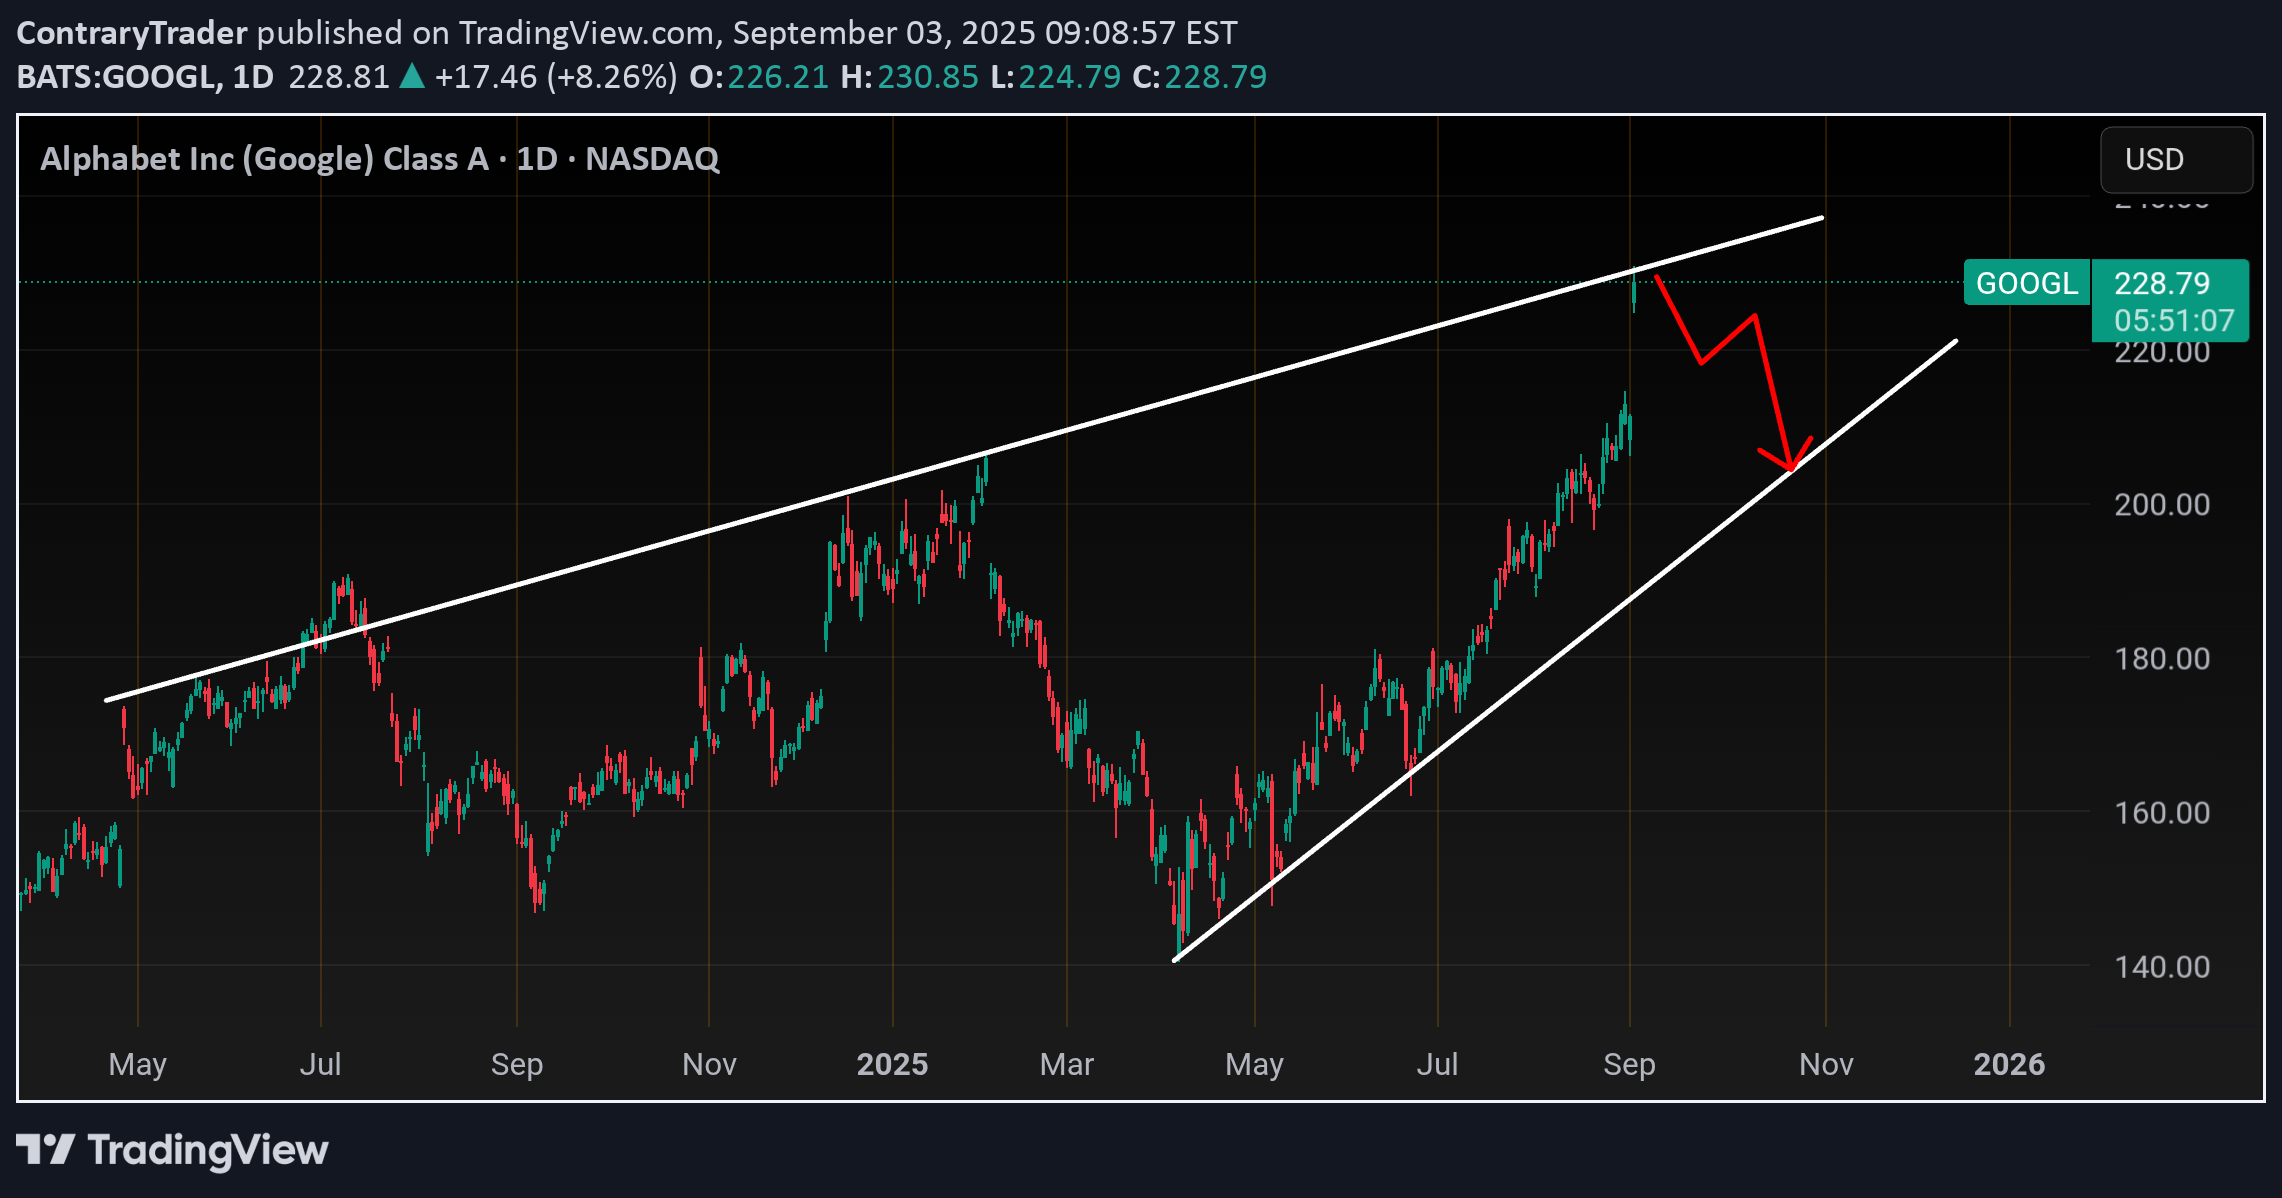
Just an adjustment and repost of my last googl idea... the short is here near 230.. Target price 197-200 by End of October or sooner.. Daily, weekly RSI overbought Daily, Weekly' monthly Bbands over extended Weekly moneyflow overbought XLC Sector at resistance here at 113.00 Looking for a correction here with the rest of the market.. googl started late and is finishing late .. Risk to reward here is Stop loss and Add short up until 235.00 Target 1 - 210 Target 2 - 200 Good luck
ContraryTrader
Nvda... where we stand
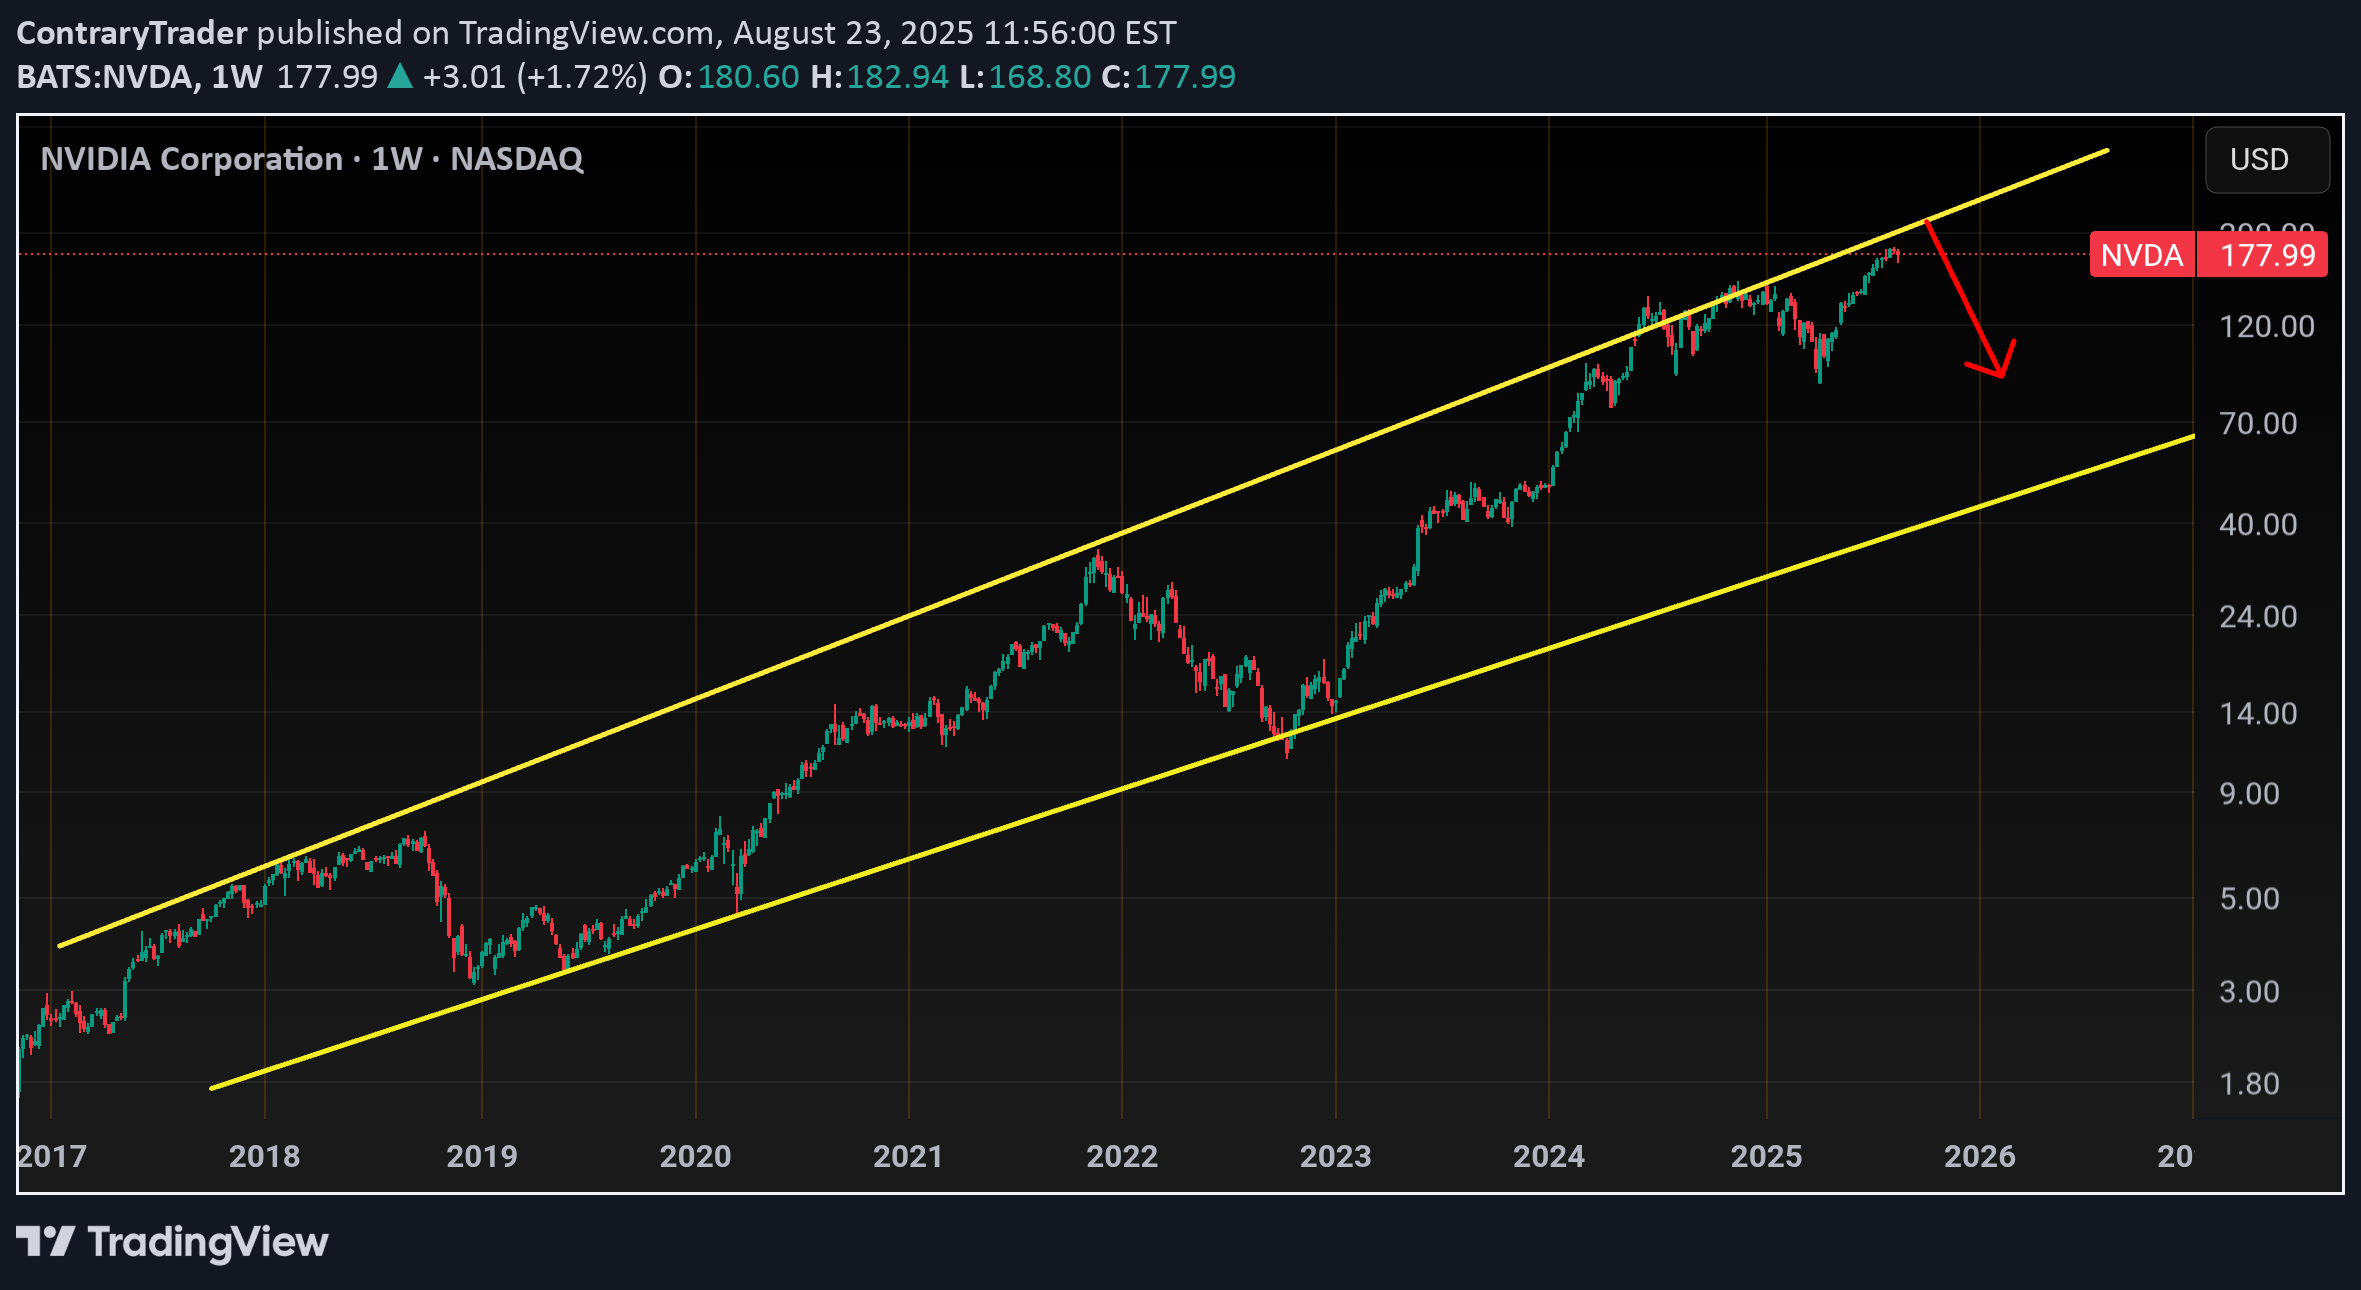
Earnings this week... Upside move 195-200 if they pump this but any opening near 200 should be faded .. I'm looking towards a 140 test in Sept - Oct. Weekly is really overbought , I wouldn't chase this up here.. I'm looking for a move similar to what TSM did after blow out earnings which is gap up to weekly trendline and fade Biggest red flag here is SMH (Chipsector) Zoomed out you can see price is rolling over at resistance here Zoomed in and you can see , Wyckoff distribution You'll be lucky if SMH gives you one more pop but this sector and the underlying top stocks are headed for a 20-30% correction (Maybe more).. I'd stay away from the longs until Seasonality flips again around late Oct early November See the link from the AVGO and TSM .. they are already finished. NVDA IS THE FAT LADY SINGING. Eventually NVDA will retest the bottom of this channel , this move will like come with a break below 90 but first we would have to break back below 140.. So my analysis is, Nvda has room for 190-200 if it beats on earnings, if it goes red and drops below 167 it's a short back to 140's.. Either way, we will see 140
ContraryTrader
Qqq... Done or one more ?
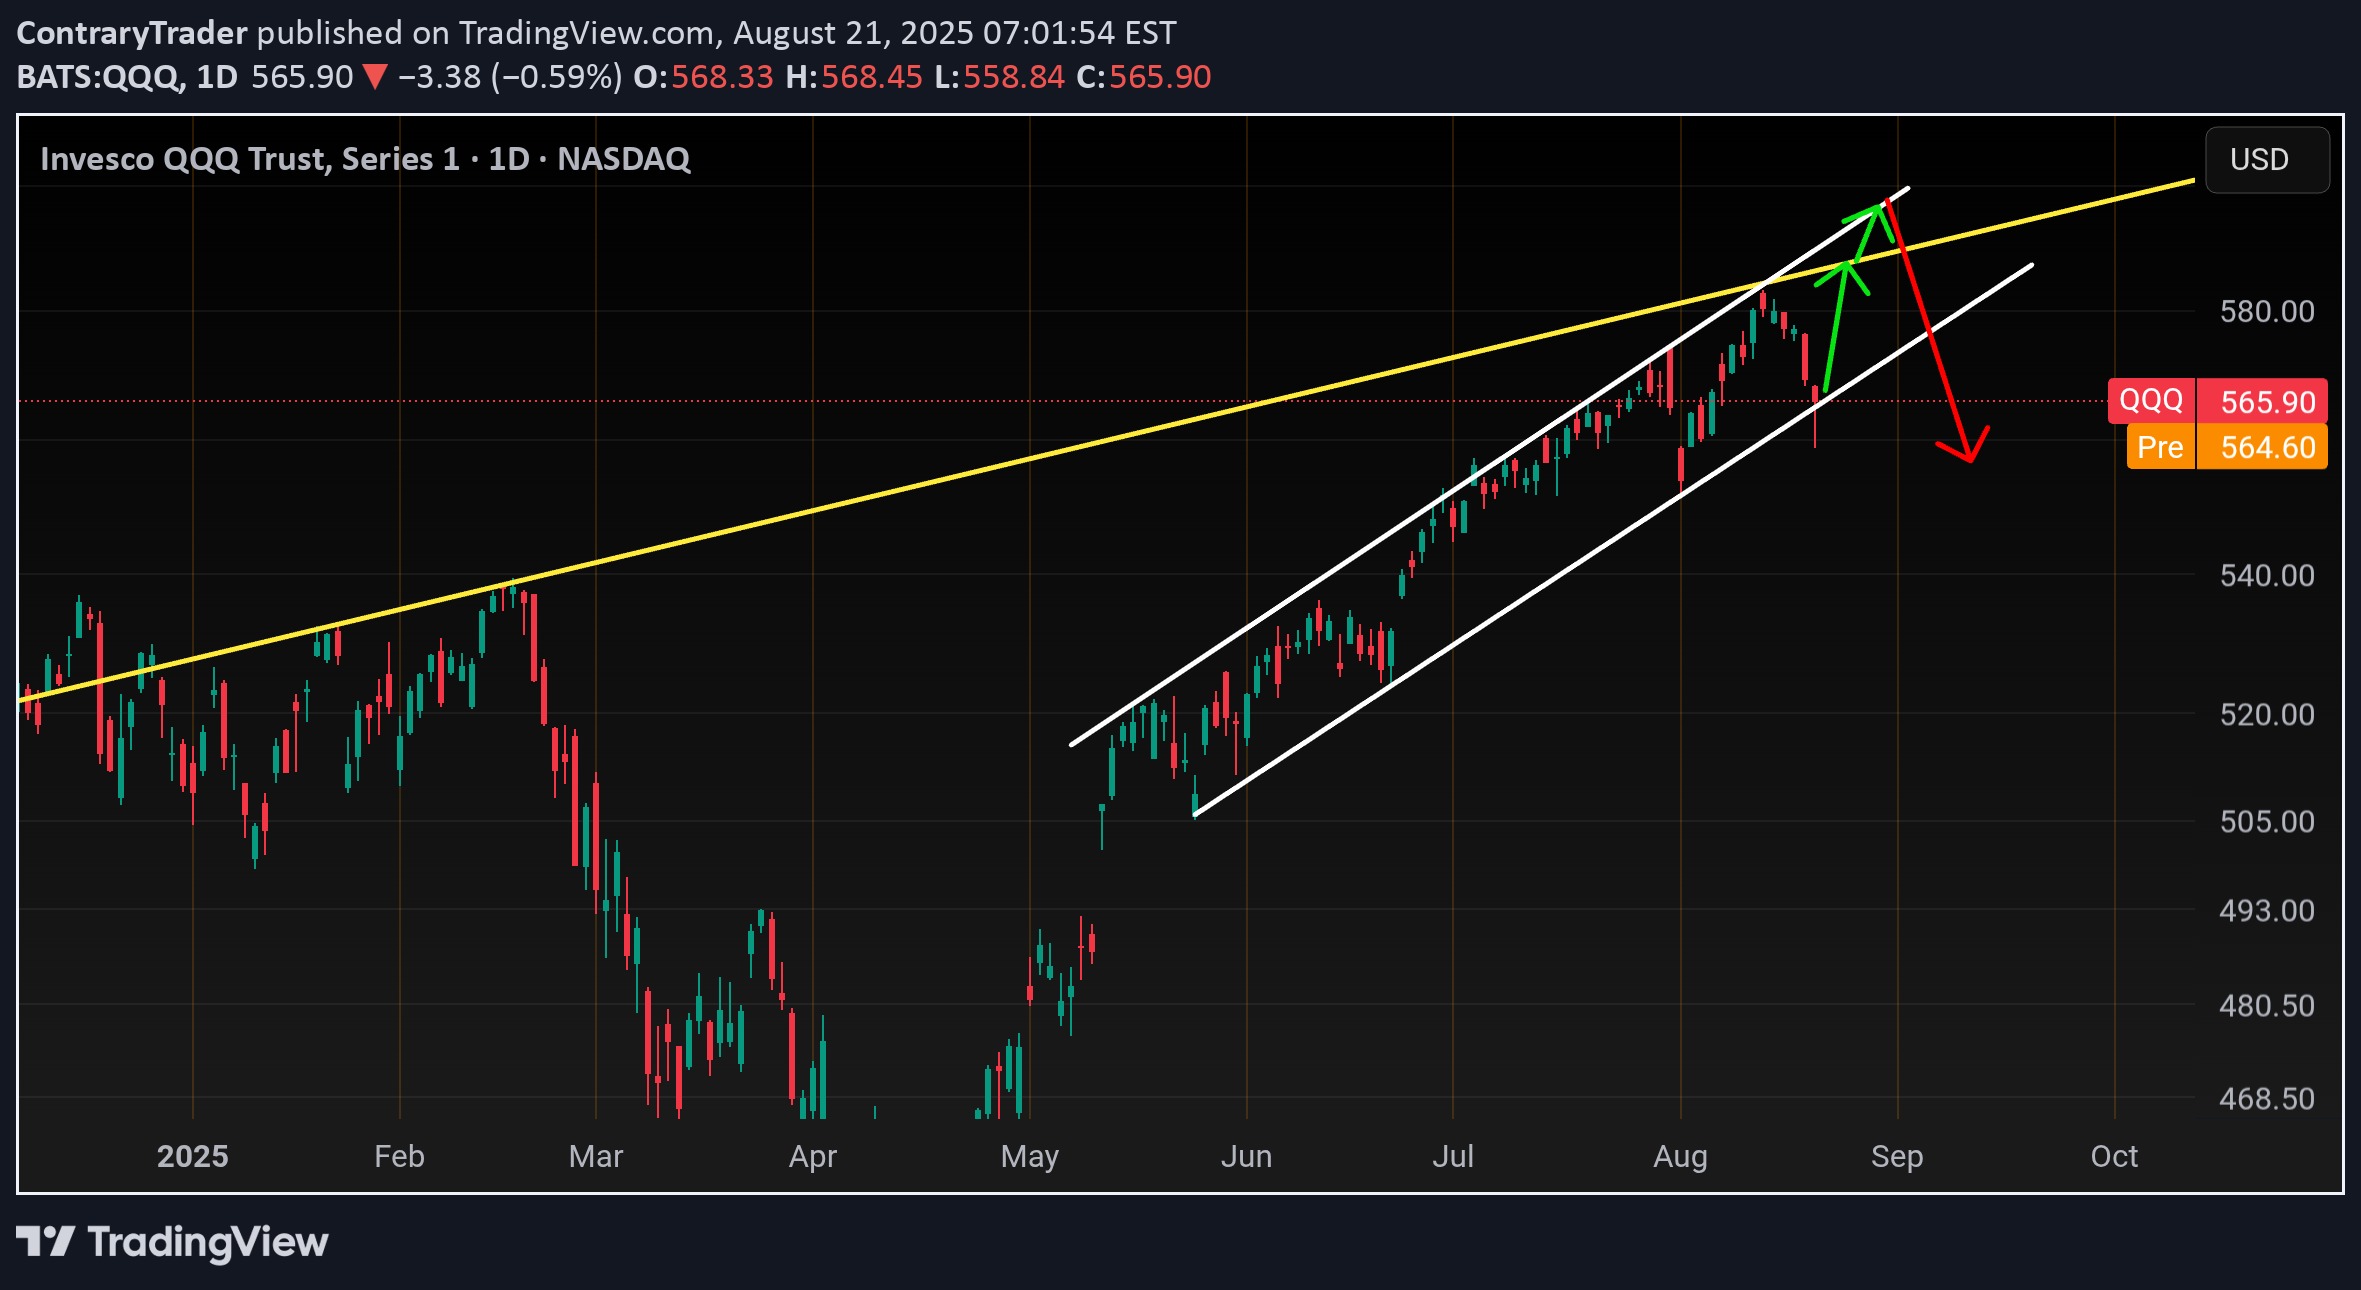
So in my previous post I mentioned Qqq tagged its 16 year trendline resistance Zoomed in and circled last 3 touches From 583 to 559 in one week. Now Zoomed to see the last 2month price action and you'll see we hammered off our summer channel support So with Powell speaking tomorrow i think we will be at a cross roads where either we will make 1 more high before sept or the move is done already. Let me explain In my last post (See link) I explained the tech Sectors and that they where signaling a top and here we are a week later. The 2 biggest tech Sectors SMH (Chips) XLK ( aapl , msft) Are both Showing a topping pattern called Wyckoff distribution.. This pattern is pretty much a conformation that Sept will be UGLY and Qqq will close gap at 530 minimum But I've said all this before in my last post.. This post is about the possibility of a bounce to 589-600 in the last week of August. It all comes down to Powell tomorrow.. if Qqq closes back over 571 or 20sma tomorrow then I would be leaning towards one more of 589-600.. 589 would be a tag of that yellow trendline which is that 16yr resistance. 600 would be extreme fawkery and a push back up to the top of the summer channel. Qqq has faked out twice before over that monthly trendline . I circled the last 2 fakeouts here So if Qqq and tech Sectors push back over their 20sma and close the week above it then I'd flip long for the last week of August then come back after labor day weekend with puts in mind. If Powell causes a sell and we close below 563 then disregard this post.. The next best short entry is below 557.00 Core pce and NVDA earnings are catalyst next week. Risky longs below 20sma.. Either wait for a break above 570.00 Or long 563-564.. If you long 563 then be willing to add to your position up into 559.00 Stop loss below 558.00 If you long above 570 them be willing to add to your position up into 567 Stop loss below 566 Over 570 and 576.50 comes Over 581 and we will head to a new high Trade idea If this goes up then I like GOOGL calls with a target of 210.00 for the last leg up. See my link Entry above 197.50 (20sma) Stop loss below 195.00 1st Target 202.50 2nd target 210.00
ContraryTrader
Tsla... For the week of Aug 18th
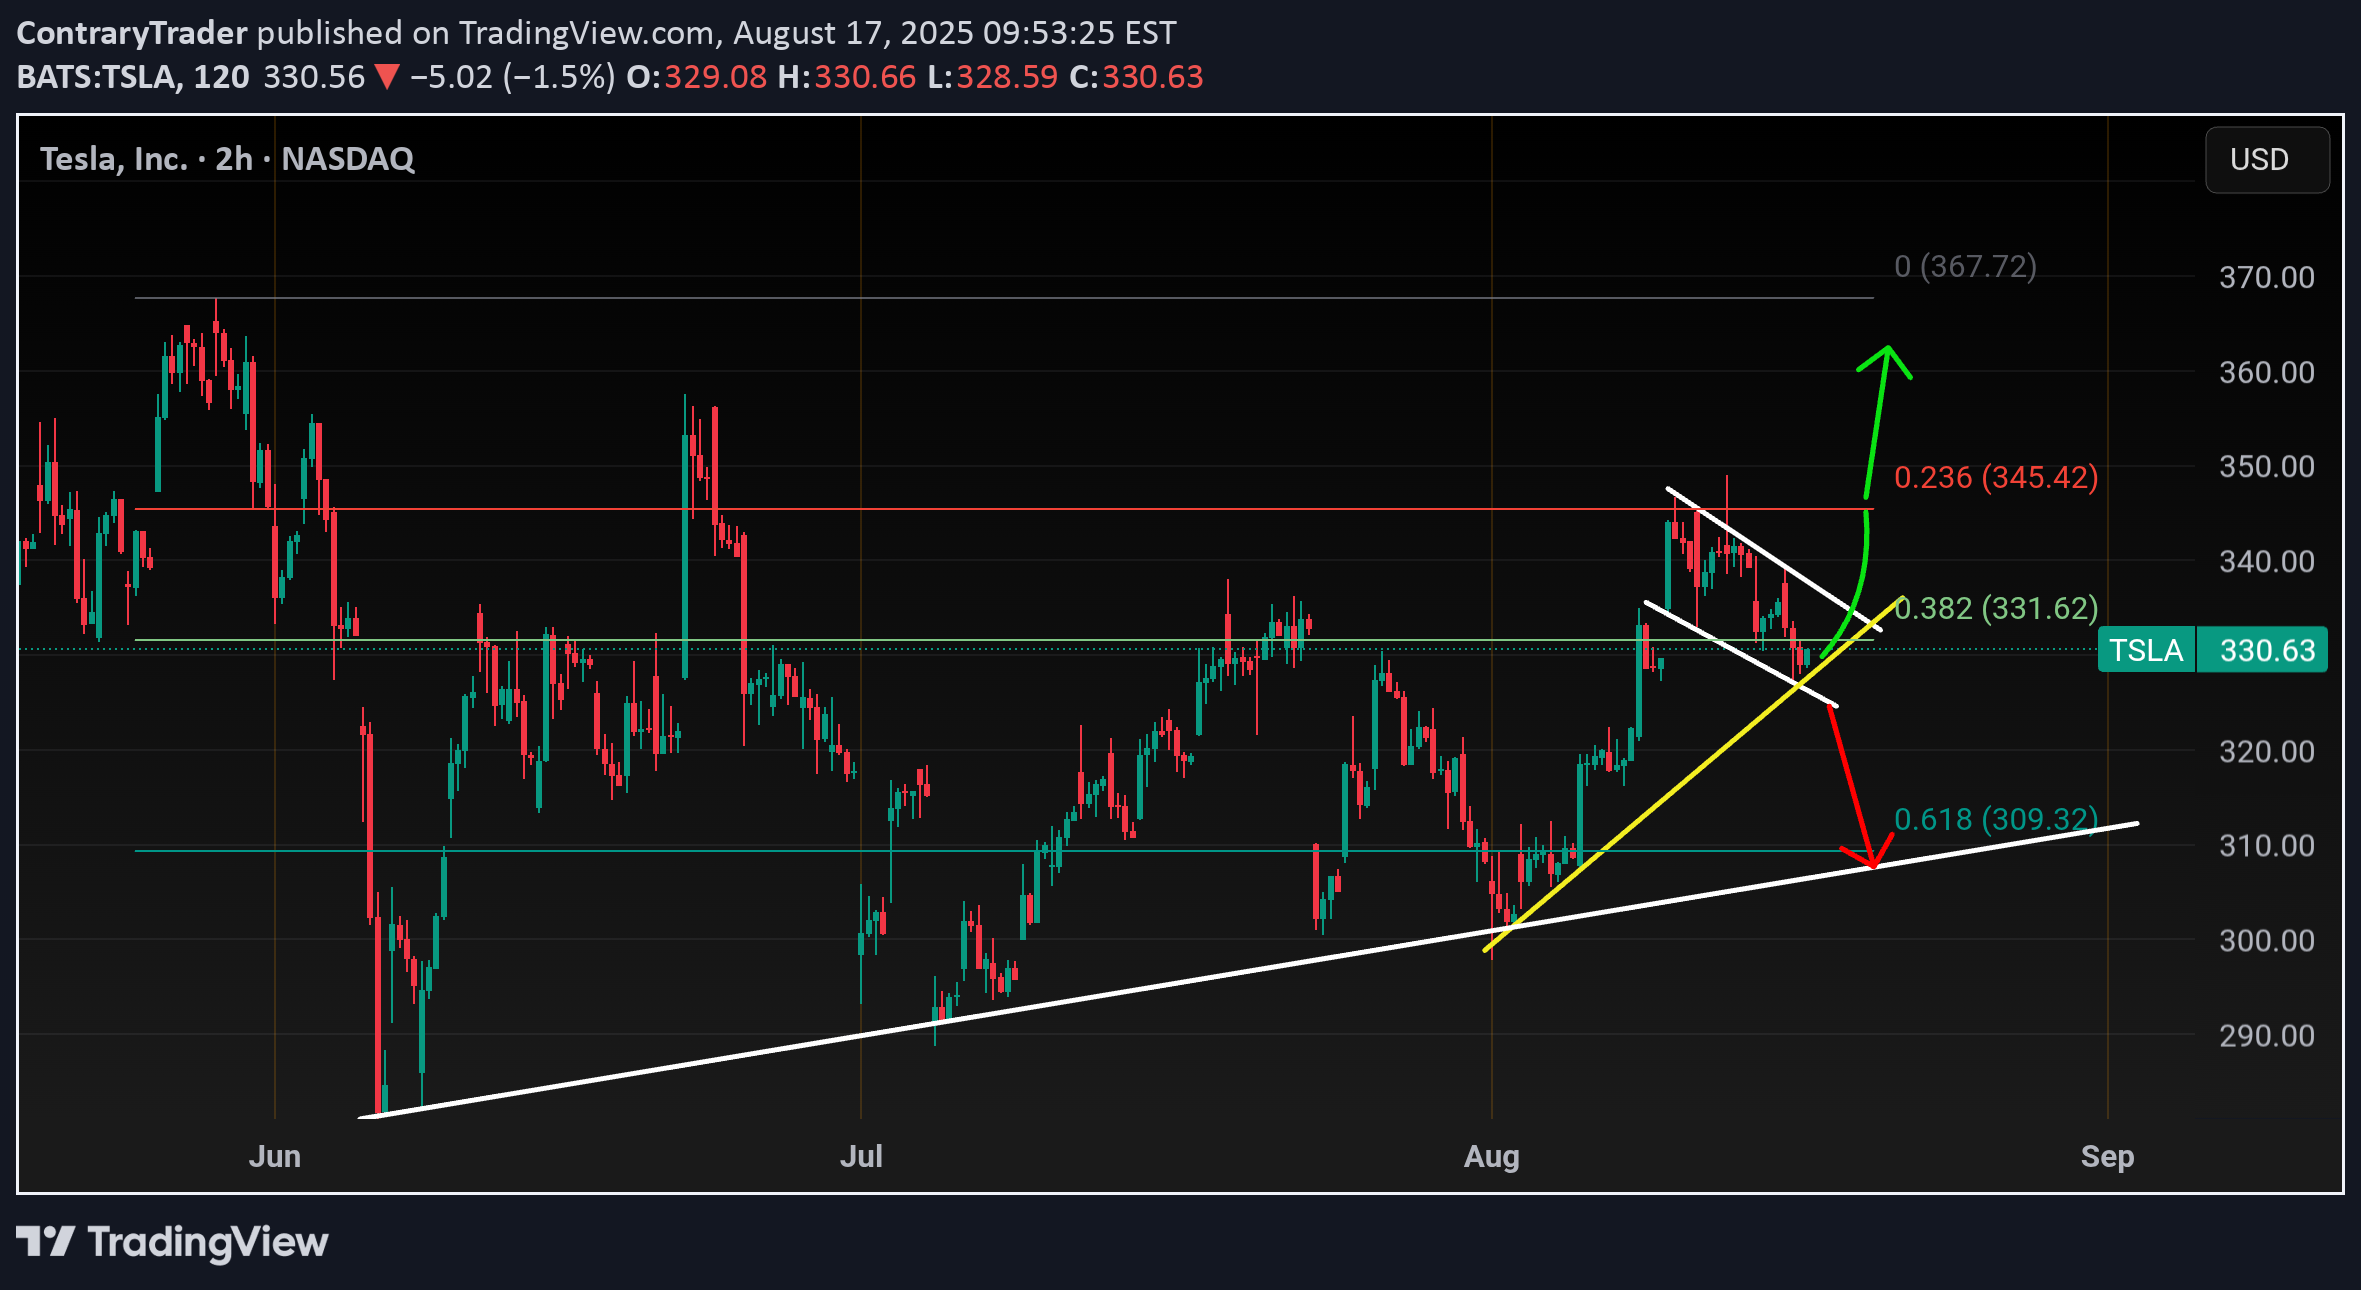
So this post is more on how I would trade TSLA this week Vs the long term view . For transparency, If I trade Tsla it's usually an 0dte situation on friday. My preference is BIG tech with High volume and IV under 35 (Aapl ,Amzn, Msft) .. Tsla Implied volatility (IV) is always above 50. Before I Trade these tech, I always like to chart the Sector they are trading under. I feel knowing where the sector is headed gives you an edge on the general trend of the stock. The top 2 stocks in XLY are AMZN 23% weighting TSLA 16% weighting So that means if you see this sector about to move higher or lower its usually 1 or both of these stocks behind the movement. Here's XLY daily I've circled 3 touches on each side that validates the channel here Notice after it tagged resistance on Wed tsla started to show weakness. By Friday only amzn push to close gap at 234 kept this up. I think Next week we will pullback and close that gap at 226 here and depending on if we bounce or not will depend on Tsla next move. Or we could choose the purple route and keep grinding. Me personally, i would want to open calls here at around 230, i mean we could see fawkery like amzn down 2$ which would allow tsla to pump 5$.. remember tsla went weak last Wed but amzn stayed strong into friday. Very bearish back under 226.00 I do think XLY is headed for ATH, though. Now on to tsla Let's start with Trendline and Fib levels Tsla is starting the week with support at 330.. Support below that is 326. Over 332 and 336 can come. Over 338 and 345 comes. So If you are bullish you'd either try an entry at 325-326 or above 338 and target 345. If you are bearish you either short below 325.00 target 315 and below 315.00 and 309 comes. Or short 345.00 with a 331 target. Patience and discipline limits the risk. So mid term out look for you guys who like to buy out a few months. If tsla Can CLOSE over 345.00 then I think 368 comes. But being so close To Sept we may get this Fawkery route of a trade between 330-368 until Late sept or Oct then a breakout Q4. This setup would be an ascending triangle and the move would similar to what you saw when aapl move from 200-230 in 3 days. I don't think tsla breaks back below 300 , atleast not in august so I won't entertain that scenario.. like I said, this idea was for a weekly trade route..
ContraryTrader
Qqq... tech wreck incoming

It's a been awhile since I covered Tech and the sectors.. To make a long story short, I think the rally from April low is about 95% completed and anything up here is Distribution... After Distribution, usually a correction comes and given the Sept Seasonality I think this correcti9m could be 7-12%. Here's Qqq on the monthly... At this pace , the monthly trendline can be met at 585 give or take which is only 1% away.. with us being so close to resistance, they will not be able to push everything all at once.. in the next week or so you will start seeing more and more divergence where only a select few will pump this across the 585 goal line. Also on the monthly time frame, you can see that Qqq is outside its Bollinger bands, we won't make it out of Sept with that setup. Daily chart Daily candle is 60% outside its Bbands.. this is always a red flag on the indexes... Some Meme stocks like PLTR or Crcl may rally outside bbands but the indexes usually don't hold more that a day outside.. only in a few Seasonality squeezes Nov-Jan have I seen this Being outside Bollinger bands and near monthly and daily trendline is terrible Risk for a long here. Now the sectors.. There are really 4 main sectors that move Qqq. Consider Qqq a car and the sectors are important pieces (Engine,transmission). Here's XLC This is the sector of Meta, googl , and Nflx. At resistance here , Outside daily bbands SMH Home of Nvda,Tsm, and Avgo The overbought at resistance setup is the same as XLC XLK This is the biggest sector here Home of Msft , aapl and nvda also Same shit as the first 2 XLK may have room for 270 but that's it. The last 2 times I saw a setup on Qqq where sector and index were all telling me the same thing was Dec 15th 2024 and Feb 14th 2025 ; Qqq corrected a few days later of both dates .. The only sector that is an enigma to me right now is XLY The home of tsla and amzn Weekly chart This doesn't look bearish It's not overbought like the others which is because amzn and tsla have lagged the other big tech names on this rally Daily chart Needs to clear 228 for Tsla to push higher we head back to 218 Could they correct the rest of tech and pump just tsla and or amzn? Absolutely. Propping up a couple and dumping the rest is called a plunge protection.. it won't stop qqq from bleeding but instead of a 12% correction, you'd end up with a 7-10%. Fawkery. Let's see what happens with XLY So let's zero in on Qqq As far as trading goes today Nq 4hour money flow indicator combine with Qqq 15min money flow combined with us gapping out side bollingerband tells me do not chase the long here, there is a high chance we flush and close this gap today but I don't think we will break back below 578-579 before we tag 585 could come on PPI tomorrow.. So let's say today's resistance is 583, you'd short there with a 579-580 target.. be willing to add to your short up into 585. Cut losses above 585.. like I said , I don't think we break back below 577 until 585 is tagged so today may be a scalp short before the last leg up The bottom of this Daily channel is around 568-570, with the 20ma right below it.. that will be your short term target once 585 is reached. The real correction starts below 566 2 big catalyst next week are Fed minutes Wed and Jackson hole which starts on the weekendQQQ If we close below 579 then that will be a LL on the weekly. We've broken our Aug up trend, so once 574 support goes then 564-566 comes nextMy favorite shorts going into next week are GOOGL and META
ContraryTrader

Disclaimer
Any content and materials included in Sahmeto's website and official communication channels are a compilation of personal opinions and analyses and are not binding. They do not constitute any recommendation for buying, selling, entering or exiting the stock market and cryptocurrency market. Also, all news and analyses included in the website and channels are merely republished information from official and unofficial domestic and foreign sources, and it is obvious that users of the said content are responsible for following up and ensuring the authenticity and accuracy of the materials. Therefore, while disclaiming responsibility, it is declared that the responsibility for any decision-making, action, and potential profit and loss in the capital market and cryptocurrency market lies with the trader.