
CoffeeshopCrypto
@t_CoffeeshopCrypto

What symbols does the trader recommend buying?
Purchase History
پیام های تریدر
Filter
CoffeeshopCrypto
How To: Avoid paying Taxes on my Trading Gains?

***Make sure to read this through. At the bottom is an email you can fire off to your CPA as well as your funded broker with the right questions to get you started***In the video above I gave you the thought process and questions that come to me from many people weekly. I want to share with you guys a method you can use which depends fully on weather its availble by your broker or not.The Issue: I am getting payouts from my broker but I dont want to pay taxes on it. What do i do?The Answer: There is no way to AVOID paying taxes but There are some questions you need to ask both your Broker where you have or will have your funded account, as well as ask your CPA if you are using one, which will or will not allow you to move your "GAINS" directly into an investment account without paying an INCOME tax.Bare in mind, the bottom line is that if its possible for you to do this, youll most likely need to set yourself up an an 'entity' like an LLC or an S-Corp.-----------------------------------------Can you trade through TradingView using a funded account?Yes. Most prop firms (like Apex, My Funded Futures, etc.) allow access to TradingView via third-party routing systems like Rithmic, CQG, or Tradovate.Can you send trading profits directly into an investment account (e.g., with Fidelity or First Fidelity Trust)?Not directly.Most prop firms pay out to you personally via: ACH / PayPal / WireThe payout is treated as income, not capital gains — you’re usually issued a 1099. So short-term capital gains don’t apply here — it’s contractor income.Can you route those funds into an investment or retirement account?Only indirectly, if you:Set up a legal entity (LLC/S-Corp)Prop firm allows payouts to that entityEntity sends funds to a brokerage or retirement accountThis gives you:Tax management optionsAbility to fund SEP IRAs, Solo 401ks, or other investment vehiclesBusiness deductions and better income structuringImportant: Not all prop firms support this. You must ask.What happens if you just take the payout personally?You’ll owe taxes on the income that year. If it's a large amount and you're not using any tax strategy, this can be a big hit — and you won’t be putting that money to work in a retirement account, which could have deferred or reduced the tax burden.Why do traders want to route funds into investment accounts?To defer taxesTo compound gains in tax-advantaged environmentsTo avoid having income hit their personal checking and be immediately taxed without structureTo separate business income from personal finances.Who should you talk to?A CPA who understands prop firm payouts + entity structuringThe prop firm support teamYour investment account provider (e.g., Fidelity, First Fidelity Trust)If You’re Using Your Own Capital (Not Prop Firm Capital)When you're trading from a cash account funded with your own post-tax money (like a personal account at Tradestation, Fidelity, Interactive Brokers, etc.), you're in a completely different tax situation compared to a funded prop account.Im trading with a CASH ACCOUNT and this money was already taxed. Why am i paying more tax?1. You’re Right: That Money Was Already TaxedIf you earned money through a job, business, crypto sale, whatever — and then you funded your trading account with it — yes, that money has already been taxed as income, capital gains, or whatever the original source required.But…2. Trading Gains Are Still Taxable — SeparatelyOnce that taxed money is used to generate more money via trading, those gains are now a new taxable event. Here's why:The IRS doesn’t look at “double taxation” in terms of the original dollar — it taxes the gain on that dollar.For example:You fund your account with $10,000 (already taxed)You trade it up to $15,000You now owe taxes on the $5,000 gain, not the $10,000 you started withSo no, you're not being taxed twice on the same dollar — you're being taxed on new earnings generated from that dollar.3. Type of Tax Depends on Holding PeriodDay Trading / Short-Term (< 1 year):Taxed as ordinary income, same as your paycheck (could be 10–37%)Long-Term Gains (1+ year):Taxed at long-term capital gains rates (typically 0%, 15%, or 20%)This only applies if you’re not trading inside a retirement account (IRA, 401k, etc.).So What’s the Advantage in Routing Gains Into an Investment Account?This is where people try to get clever.They want to avoid realizing gains in their personal account because:It may bump them into a higher tax bracketIt may trigger estimated tax paymentsIt might disqualify them from certain tax creditsSo the idea is:“Can I send the profits somewhere else (like an IRA, trust, or investment vehicle) so I don’t get taxed now?”Answer: Only if the gains were made inside that tax-advantaged account to begin with.You can't trade in a regular brokerage account and then “move” those gains into an IRA to defer tax. That’s not how tax shelters work — they only protect gains earned inside them.Does Being Self-Funded Change the Tax Situation?Scenario = You fund trading with post-tax dollars ---- Not taxed again on that baseScenario = You generate gains from trading ---- Yes, new taxes on new profitsScenario = You want to avoid immediate taxation ---- Can't defer taxes just by moving profitsScenario = You trade inside an IRA/401k ---- Gains tax-deferred or tax-freeScenario = You trade through a prop firm ---- Income tax, no capital gains involved----------Here is an email to get you started. Send this to your CPA and your Funded account broker---------- Questions to Ask Your Prop Firm (If Using Funded Accounts)Do you allow payouts to a legal entity (LLC or S-Corp)?Can payouts be directed to an investment firm or custodian?Can the account be held in my entity’s name?Do you issue 1099s for entity payouts, or only for individuals?Are there limits or fees for routing payouts to a business or trust account?
CoffeeshopCrypto
HOW TO: The right way to use the MACD
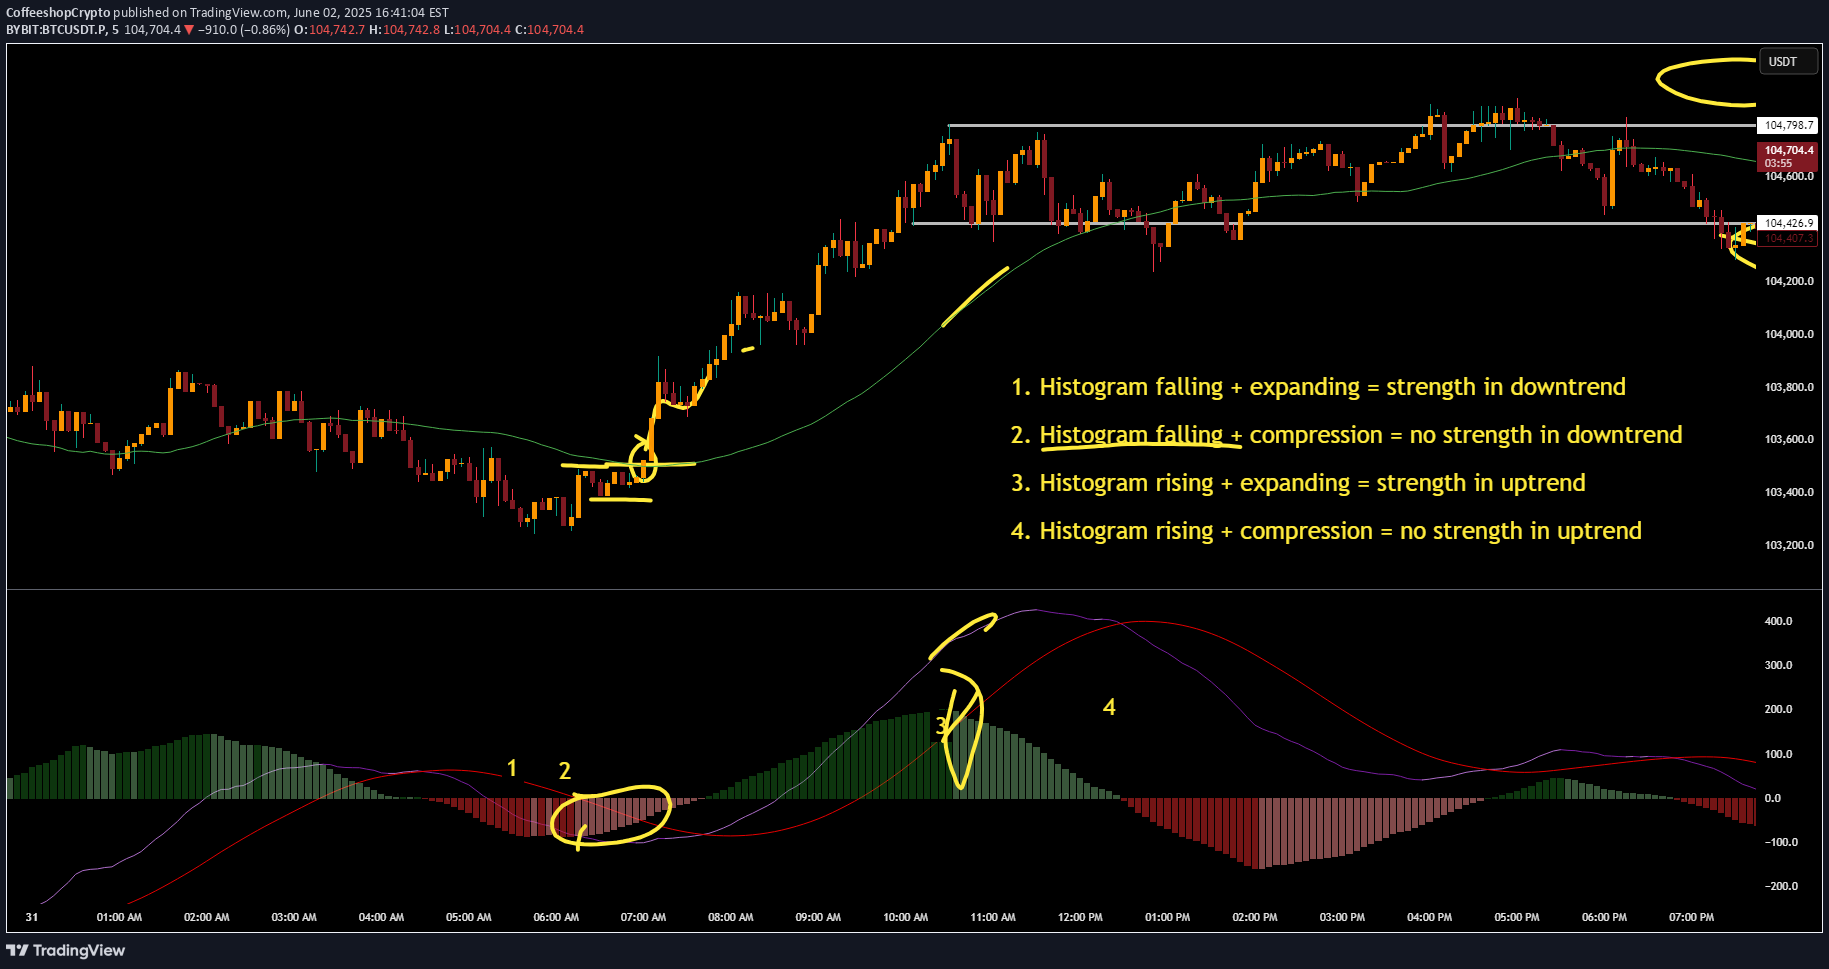
Many people mistakenly use the MACD histogram to enter trades without taking price action into context. In this video I'm going to show you how to interoperate the MACD Histogram, what it means and when its warning you.
CoffeeshopCrypto
BTC Trading in Price Discovery Zones (Price analysis)

Bitcoin in Price Discovery: Understanding and Trading in Uncharted TerritoryWhen Bitcoin or any asset reaches an all-time high (ATH), it enters a phase known as price discovery. In this phase, the market operates without historical price references, navigating uncharted territory to determine fair value. For traders and investors, this presents both an opportunity and a challenge. Employing techniques like Elliott Wave Theory and analyzing price and volume dynamics can help strategize trades during this unique phase.What is Price Discovery?Price discovery occurs when an asset ventures into price levels it has never reached before—most often at its ATH. Without prior data for resistance or support, the market relies on demand, supply, and speculation to set new price benchmarks. Understanding how price reacts in this phase requires both macro and micro analysis.Elliott Wave Theory in Price DiscoveryElliott Wave Theory offers a framework for understanding market psychology and price movements. In the context of price discovery, the B Wave of an Elliott Wave formation plays a pivotal role:Identifying the B Wave and Pullback ZonesThe B Wave represents a pullback into a range after an impulsive move upward (Wave A).Mark the peak of the impulsive move (A) and the bottom of the pullback (B).Project this range forward in time to identify potential support zones.Support Zones in Price DiscoveryThe previous high (Wave A peak) forms the top of the support zone.The B Wave low forms the bottom of the support zone.Once the price pulls back into this zone, it signals a potential retest of the support, offering opportunities for reentry into the trend.Drilling Down: Smaller Timeframes for ConfirmationWhen Bitcoin retests these support zones, zoom into smaller timeframes to assess price reaction and volume behavior. Look for:Bullish Change in the State of Delivery: This includes higher highs and higher lows, increased buying volume, and bullish candlestick patterns such as engulfing candles or hammer formations.Volume Confirmation: Strong volume on upward moves and decreasing volume during pullbacks indicate sustained bullish momentum.At these support zones, the price is likely to resume its bullish trend if the market shows these signs of strength.Managing Risk in Price Discovery ZonesDespite bullish setups, price discovery is volatile, and false breakouts can occur. To safeguard trades:Watch for Fair Value Gaps (FVGs)Look for large, unfilled price gaps from prior resistance areas.These gaps might signal areas where the price could retrace deeper before confirming support.Adjust Entries and Stop LossesIf price breaks below the initial support zone (top of Wave A), it may retest the bottom of the B Wave for further consolidation.Set stop losses below the bottom of the B Wave to protect against unexpected reversals.Evaluate Volume-Driven MovesWeak volume during a retest could indicate insufficient demand to support the price, suggesting a deeper pullback or reversal is more likely.--------------------------Price discovery is one of the most exciting and rewarding phases for traders who know how to approach it. By using Elliott Wave Theory, you can pinpoint key support zones, especially around the B Wave pullbacks, and then confirm your setups by analyzing price action and volume.The key here is patience and precision. Let the price come to those critical zones you’ve marked, watch how it reacts, and make your move confidently. Stay flexible, though—price discovery is unpredictable, and managing your risk is crucial if you want to make the most out of this high-potential phase in Bitcoin’s journey.
CoffeeshopCrypto
How to trade using the CSC-HARSI "The Real Way"

Welcome to The coffee shop. this is your host and Barista Eric. This podcast is designed to teach you the technical analysis that you should know so you can stay out of false trades in your Crypto endeavors. It's a platform where I get to release my edits of popular indicators. I'll show you how to use them, and of course from time to time I will call out really bad strategies because I don't want you guys to have bad information. Feel free to share this content where you choose and of course do Not fall for scams. I will not approach you online asking you for crypto assets Lending or any type of financial support. But bear in mind that doesn't mean I don't like talking with you guys because from time to time you will find a message from me saying hey how you do when they want to get close to you. So it's been a while since the CSC-HARSI has been released and I think it's time I do a quick video on an entry and exit for a buy and sell on this indicator.It has been requested by dozens of you weekly and I have seen all of the videos online on the improper way to use the old version of this indicator. Since the new one is out and it works basically on beast mode I want you guys to be using this to its fullest potential. today's video is based on using the VWAP as the moving average against the RSI.So let's just jump right in and get started. go ahead and open your chart and tradingviewSearch fo rCSC-HARSI, or "Coffeeshopcrypto" Add the indicator to your chart and keep the default settings open the settings wheel and go to the inputs tab scroll down to RSI moving average settings and change the ma type to vwap.Okay that's it you're ready to go and now let's talk about the rules for a long and short trade.As you do with any chart and any day that you're going to start your trading the first thing you do is you set up your support and resistance level. Personally I do this on a 4-Hour chart. I recommend setting your support and resistance levels initially when you open your chart on a time frame 1 to 2 * above the one you're using. for example I do my trading on a 1 hour chart so my support and resistance levels are usually set on a 4-Hour chart Lucky for you the indicator tells you where those things are however you may want to set up your extreme levels as well. You can do that by looking at extreme points of swinging price on your chart and just put a level they're at the top and another at the bottom.STOCHASTIC IMPORTANCE:Before we get started let me discuss something very briefly with you about the level of the Stochastic in the indicator. The scale on the right side of the indicator is mainly designed for the stochastic to tell you how hard things are pressing on the gas. In other words if the stochastic is anywhere from zero to 50 There is almost no movement on price. However, once the stochastic is doing anything above the 50 all the way to the 100, the closer it is to 100 the more Force there is in the market. you have to remember that the Stochastic RSI was designed to be a faster RSI.So if the stochastic is green "Bullish" and moving upwards over 70 there is A LOT of force to the upside..If it is RED "Bearish" and it's under 50 there is a lot of force to the downside. The closer it is to ZERO the more force there is.The strategy that I used to enter and exit using this indicator falls under these particular rules:SHORTS:1. The stochastic must be in a downtrend.2. the RSI must be below its moving average.3. The RSI must be below 50 4. Heikin Ashi candles must be red. 5. The Heikin Ashi candle must open above the moving average and close below the moving average. 6. The most optimal move is when the candle opens above the 60 and closes below the 60 while crossing the moving average.An alternative to rule six is; If your candle opens above the 50 and above the moving average but close is below both of them at the same time this is also an entry.Now obviously the rules for getting into long positions are exactly the opposite. First things first, always take a look at your support and resistance levels that you set up ahead of time. The second thing is to check your moving averages.I commonly use a 50 and a 100. Exponential moving average. If you are using scalping time frames which are anything from the 30 minute and Below then I would suggest using a 20 period Moving average and a 50 period Moving average.LONG POSITIONS RULES:1. The stochastic must be in an uptrend.2. the RSI must be above its moving average.3. The RSI must be above 504. Heikin Ashi candles must be green.5. The Heikin Ashi candle must open below the moving average and close above the moving average.6. The most optimal move is when the candle opens below the 40 and closes above the 40 while crossing the moving average.7. Alternate to rule six is; If your candle opens below the 50 and above the moving average but close is above both of them at the same time this is also an entry.
CoffeeshopCrypto
BTC support @ 20,700. Will reclaim 21,500

Just a quick update on BTC for anyone going bullish.Get into position now f u like ir set a limit buy order at $20,700.Then set a take profit at $21,500.We are currently in a flatline with price action being matched pretty evenly between bears and bulls.There's a slight rise to the price range but overall bears are in control of this consolidation area.
CoffeeshopCrypto
6 month prediction on BTC bottom achieved

#BITCOIN is at its bottom.(Actually right now it's losing momentum) I just wanted to post this quick message showing the chart.You're going to want to ZOOM WAY OUT on the daily till you can see prior to December 2021 where I entered a short position.Tomorrow afternoon I'm going to record a video discussing this move.How I predicted it 6 months ago.The formula for tge RSI that tells me the exit.How fibbonacci was placed to confirm the move.And the parts of my MASS EFFECT moving average that tell me:A) The BTC downtrend is over.B) What level did momentum get lost atC) what is the zone it needs to cross going back up, before you should buy again.If I were you, at this point, I would not short Bitcoin.Share this idea. I'd really like to go LIVE and discuss with you guys who may have questions on the spot.
CoffeeshopCrypto
$ETH is ready for a bull move

Currently ETH is sitting in a range of $1120 to $1150.Personally I'm seeing a bull move to $1206 before momentum is lost or that is the next slowdown.I could predict longer but I don't want to wait that long in a trade.I've already started my entry at $1102 leveraging a 3x on kucoinThis would he a 9.54% bullish move so I'm sticking to it.Entry $1102Exit $1206Stoploss $1096 but it diesnt need to be that low.
CoffeeshopCrypto
$ETH moving on a pullback to $1260 (watch it fall)

I'm testing out a new indicator I've made and it does a great job showing me trend pullbacks,, as well as continuations. I'll be releasing this publicly very soon by invite only for testing. Check it on the daily chart against #Eth looks like I'm about 20hrs early for a pullback but according to the interaction of the moving averages I've made for this, the trend has slowed just enough which means volume is slowing down too.Price is also lining up to close ABOVE the price action ribbon I've created. This means a short uptrend within the main downtrend (pullback)Atthispoimt I'm going with a 1:1 since this is essentially happening on both the flip (crossover) of my ribbon and the simultaneous flip of the stochastic #RSI.After this move completes I expect it to continue to drop to $530.00This all comes about using my RSI formula for momentum
CoffeeshopCrypto
Dont let the rally fool you. RSI predicted a 120 day trade 100%.

BTCUSDTKey points here to look for:[RSI Formual for entry and exact exit][RSI Is telling you exactly how far the move will go][Dont let this recent rally fool you]To enter the trade and use this formula I needed the first candle to close BELOW the 50 day #EMA Moving average as well as have a closing of BELOW 50 in the RSI. This took place on November 16th.I would enter most likely on the next day closing as long as it is still below 50 on the RSI. On the closing of November 17th, it happened. So here is how it played out.Nov, 16th Closing RSI was the first one below 50. It closed at 44.75Nov, 17th Closing RSI was also below 50. It closed at 45.55!keep that last RSI in mind. we are going to need it for the formula. It'll tell us EXACTLY how far to set the take profit.At this point I did the following:1. Place my entry at the opening of the next day (Nov 18th)2. Set my stop-loss on the swing high of Nov 10th. Which also happens to be where the "Bear" #WilliamsFractal appears. This is the most recent Swing High.3. I looked at the closing #RSI value of November 17th. [45.55]4. Did my RSI formula, which is loosely for the purpose of this writing: Bear Setup: 50 - 41 RSI = a 1:3 Ratio. But you still need to add in the decimals and single digits. This RSI was 45.55. This number breaks down to 40 and 5.5 ( i dropped the last number)Yeah, i know, it sounds crazy right?RSI of 50 - 40 is equal to a 1:3 RatioWhats left over is the 5.5 right? so that's what you use for your Ratio as well. If 40 gives you a 1:3 and you add in the 5.5, you get1 : 3.55 ( on your SHORT tool it shows up as a ratio of 1 to 3.55 )Set your tool on your entryStoploss goes to that swing hightake profit goes to 3.55Now if you look at the chart attached, youll see that the take profit candle is EXACTLY at the last candle before price went into consolidation.This is the very first candle where pricing opened AND closed in an oversold area on May 11th.This was a 120+ Day move with a 52.50% gain without pricing even coming close to the stop-loss.This was ALL based on a single indication i got from an RSI reading and a fractal.DONT LET THE RALLY FOOL YOU (Luqidity grab)The point that im making here is you need to know the formula your RSI is telling you to do.Stop with this guess work of the 1:1.5 or 1:2 ratio and trust the math. Market sentiment and news media aside, the math doesnt lie...EVER.I kow theres articles and other websites sending out news saying "HEY BTC is on a rally up." Then next they are like "OH NO, 150m in positions liquidated as people jumped into the rally up."Well yes, all this activity that took place on May 30th and June 1st was a liquidity grab.Dont let this bump fool you. THe price is NOT done falling.Weeks ago (april 25th) i posted on someone elses BTC analysis that they were wrong and BTC will go down to about 30k based off my formula and the RSI signal. They insisted its going BULLISH because of a single day bullish candle closing but the next day April 26th its was an engulfing Bearish candle that ate everything. What they didnt realize is that stochastic RSI was in a downtrend but stil just about to break below the 50 level on the RSI with nice wide bands. Shame shame shame.THe bottom line is this. Follow your RSI formula.Ill have to post up an image of how it works because doing it typing, doesnt give it enough justice.I actually use my RSI with a ZERO level in the center to make things easier so1-10 = 1 : 3 ratio10-20 = 1 : 4 ratio20 - 30 = 1 : 7 ratio30 - 40 = 1 : 8 ratioUsually after this point, its either overbought or oversold and you should NOT be entering a trade, not even with a trailing stoploss.This formual uses up the TENS places of your RSI.If you have any single digits (1 - 9) you just add them to the endIf you have any decimals, you drop the 100th place and move the decimal over.ExampleRSI = 55.75Formula equals ( 1 : 3.75 )RSI = 38.29Formual = 1 : 4.71This formula will give you the ENTIRE move less the momentum in the end of the move. You can use this to find the LOWEST point in a swing of any size. The one take-away is that all you MAs must be of equal distance from each-other and not in a major UP or DOWNTREND. They must be pretty much FLAT.Questions about the formula, please ask below.
CoffeeshopCrypto
XRP to drop over 12%

tradingview.com/x/ylUowyhp/Welcome to Coffee Shop crypto everybody this is just going to be a quick one for you xrp is going to drop about 12 and a half percent if you take a look at the chart that I have up below feel free to go ahead and copy to straight into your demo account and test it out for yourself there is a Formula that I use for the RS I that will tell me the exact beginning to end of a move now this is a several day trade probably I wouldn't call it a swing trade this could happen very quickly so let me rephrase that last statement. This is a day trade movement on the 1-hour time chart and I'm doing this with an RSI set up 14 a stuck a stick set at 200 and I'm looking at a split screen display of both heiken Ashi candles and price action regular candles Chinese candles so we are in a downtrend this is a bearish move and it is not my go to move but if you want to test out that my formula for RSI works on your own demo account feel free to do so now as far as I can see the RS I was hitting at about 55.41 I think it was or 54.4 + that tells me that my r s i needs to be that my risk-reward needs to be at a 1 to 4.5 or 1 to 4.3 something like that I don't have that screen up in front of me at the moment but feel free and just copy the trading to your demo count. if it works out for you, please come back and comment that it's all good, and I'll show you how to get into that formula. I have no problem doing it. I will however the future very soon set up a video showing the formula and the different stages of when you go 1 to 2, 1 to 3, 1 to 4, 1 to 8, 1 to 10 and 1 to 12 on your risk-reward based on what your RSI tells you. that's it for now feel free to leave your comments below. if you can hear the music in the background by the way this show is sponsored by anti FM radio.com and this is coffee shop crypto.
Disclaimer
Any content and materials included in Sahmeto's website and official communication channels are a compilation of personal opinions and analyses and are not binding. They do not constitute any recommendation for buying, selling, entering or exiting the stock market and cryptocurrency market. Also, all news and analyses included in the website and channels are merely republished information from official and unofficial domestic and foreign sources, and it is obvious that users of the said content are responsible for following up and ensuring the authenticity and accuracy of the materials. Therefore, while disclaiming responsibility, it is declared that the responsibility for any decision-making, action, and potential profit and loss in the capital market and cryptocurrency market lies with the trader.