
Christash
@t_Christash

What symbols does the trader recommend buying?
Purchase History
پیام های تریدر
Filter
Signal Type
Christash
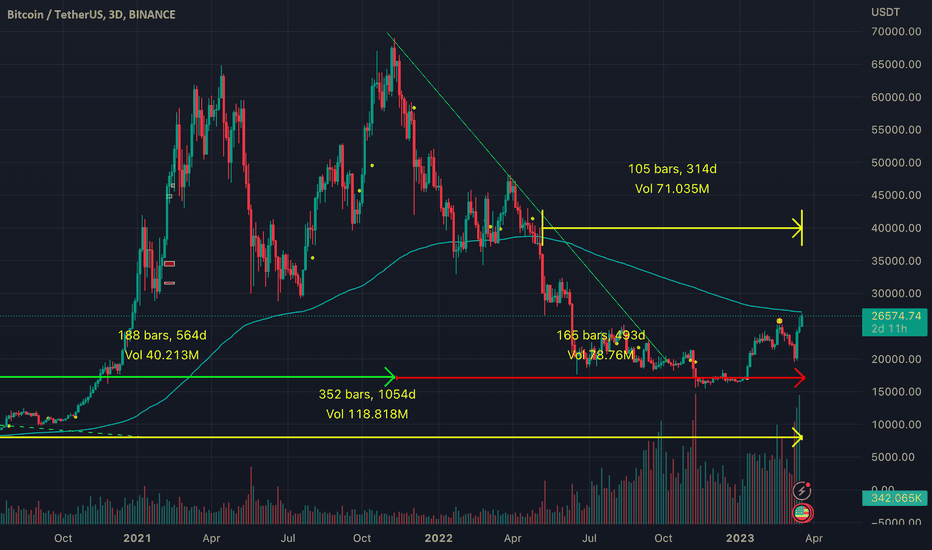
It is the first time since May 6, 2022 (314 days) that BTC can potentially intersect with the 200EMA 3D. On the other hand, it would be the first time since April 29, 2020 (1054 days) that it would reach this indicator level in an upward trend. At that time, BTC was at $7,900. Since then, BTC has grown 760% over 561 days and suffered a 76% correction over 493 days. Does it mean something? I believe that if you have been involved in such a market for all this time and have persevered, you have undoubtedly learned to have an effective approach and, above all, to be an active supporter of it. What's your opinion? Ragards.Do you think we will still see BTC at these price levels in two years? I personally don't believe so.Well... it seems that this benchmark worked this time as well, which means I will continue with them. I would like to see how long they can maintain their validity over time.I'll leave it here, without strictly considering the wave levels. What matters to me is maintaining the trend and identifying areas that, in my view, could represent objective targets for the medium term (2-4 months). Or quicker? 😳
Christash
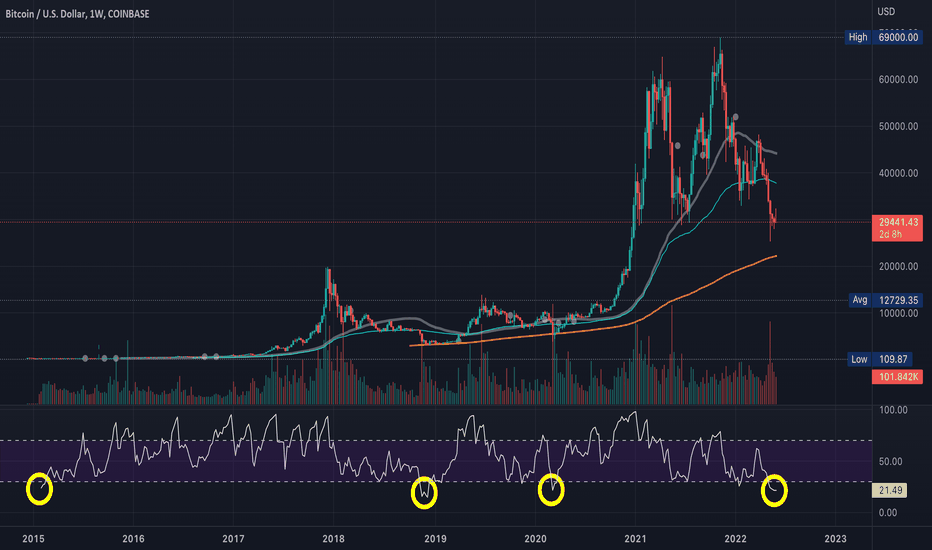
1W RSI is hovering in an area that historically preceded huge ROI for long term buyers. It happened in Jan 2015, Dec 2018, Mar 2020. Well, indeed, few points down from here could even show a 20k BTC eventually. But I've been here don't we? Then how could we handle the top if this height is scary enough? 😘 KRWell, that's how it was... We had to have enough patience to get out of that "swamp." Well, now is the time! We are back in the 69k position, shaking off the dust, and? What to do? :) If we've waited so long and accumulated a bit in the last few months, wouldn't it be a shame to give up now? :)
Christash
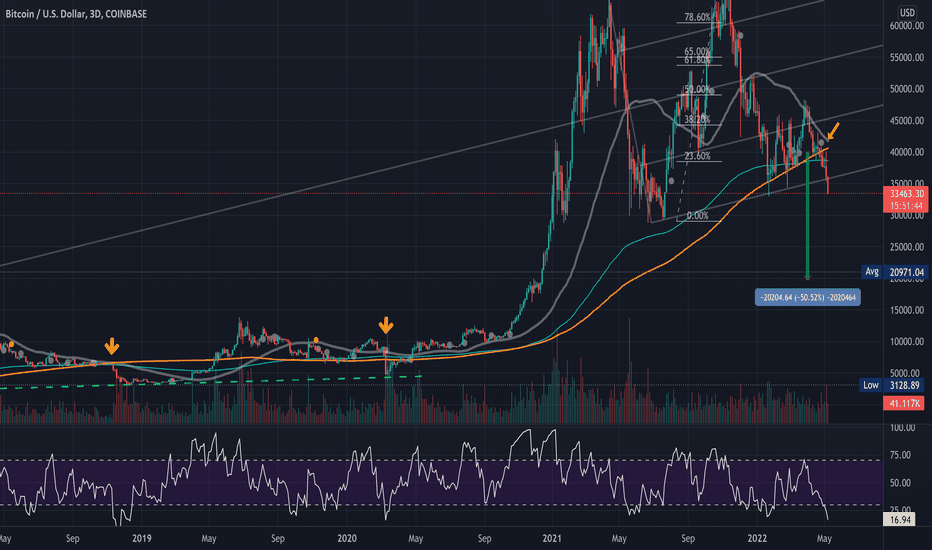
I said few days ago (see the link below) that for the bears an encouraging sign for them would the 3D close below MA200 (orange trendline). This happened two times before since 2017. In the both events BTC has fallen 45-50%. On the other hand we can see another bad sign for the technical perspective: 3D MA50 crossing down MA200 which could trigger the fallen into a medium bear market. Last events took 6 moths the longest (Nov-May 2018) . Which added to the current fall since Nov'21 it would be almost one year recovery and accumulation. From here the same pattern could pose BTC at 22k level, the same as 1W MA200 is now hovering. Anyway I don't foresee any other apocalyptic results from now on. BTC always found a way to surprise all of us. Indeed 32k is lowest close in 10 months and the people have all reasons to be bearish. The war, the stocks, the technicals / trend and so on. Do not despair, soon we will see green candles again! Don't even think that someone knows where the tops or bottoms are. Stick to your plan and wait for the market come over you. Best regards 👍#BTC is entering the green area which has been a point of reversal in early 2021 and mid-2021The traditional market decline now looks what we saw in March of 2020 during the worst of the COVID crash. For crypto market it was again a bloodbath. But this time I'm not afraid to say I was prepared much better than the other events. I wish to prove myself that dollar cost averaging is a good strategy with my setup. The overwhelming majority people don't have the time, skills, or cold-bloodedness to day trade or even swing trade.Nice break out today. Let's see how it will close. If market will close a green today I think we could see a really sexy week.Hello there! I haven't given up on this post and even though BTC has taken a direction opposite to my goals since then, I always aim to never be caught off guard. And when it's more painful, I can still make one or two trades and stay in motion. So, with a little patience, I've almost reached the same point, but with a slightly fatter portfolio :) I wouldn't be surprised to see another candle closed in this very tight range. I March wouldn't offer us more than chop (meaning that I should watch altcoins closer). But I hope April is going to bring an explosive move.I have seen other opinions on this subject and I believe that BTC could and would even be advisable to undergo a correction somewhere in the range of 20.5k or even 19k, forming an ABC correction from a possible wave 5 of the impulse from 16k to 25k. This could lead me to think that there are high chances for BTC to climb back up to the 29k range, and then subsequently correct again and find a support zone at 20-22k. Additionally, we could give decreasing chances to a wave 5 (v) of the descending triangle that started in June last year, which could even lead BTC to around 14k. Regardless of these two directions, I know there's a game to be played... I'm just waiting for my turn :)The Elliott wave theory proposes that the movement of BTC's price may follow different wave patterns, such as 12345 followed by ABC or WXY (but hopefully not WXYXZ 🙄). Regardless of the specific pattern, it is crucial to pay attention to the price level as it could signal a significant turning point in the market. As per the Elliott wave theory, the next development in BTC's price movement may trigger important movements in the market, and traders should be mindful of these patterns when formulating trading strategies.Which route seems more likely for BTC? It will be very interesting, won't it? Do you have any pros or cons opinions regarding this chart?Somewhat, this idea supports the one from March 3rd and complements the one from last year in May.
Christash
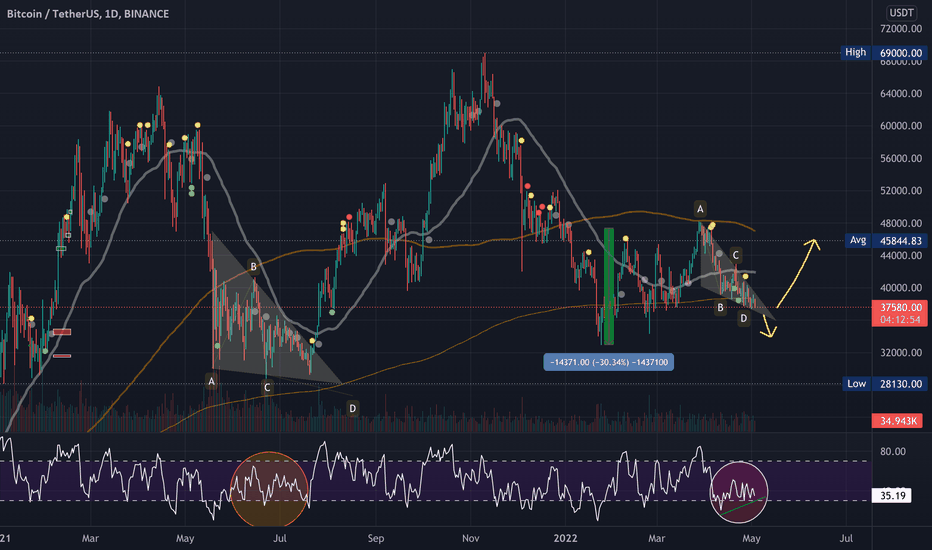
I think those figures are pretty the same.Still bullish...Falling wedge pattern is almost done as AC and BD lines are getting closer. The price is still kept right below 4h 50MA. Either way BTC is going it will determine the direction for the next 3-4 weeks. My next target would be 45-46k setting a higher RSI 1D above 50 though.It seems that a local high is set. Do you see 45k?I haven't given up on this goal. I don't know when, maybe in 6 months or a year, but I'm sure we'll get there...Hello there! I haven't given up on this post and even though BTC has taken a direction opposite to my goals since then, I always aim to never be caught off guard. And when it's more painful, I can still make one or two trades and stay in motion. So, with a little patience, I've almost reached the same point, but with a slightly fatter portfolio :) I wouldn't be surprised to see another candle closed in this very tight range. I March wouldn't offer us more than chop (meaning that I should watch altcoins closer). But I hope April is going to bring an explosive move.
Christash
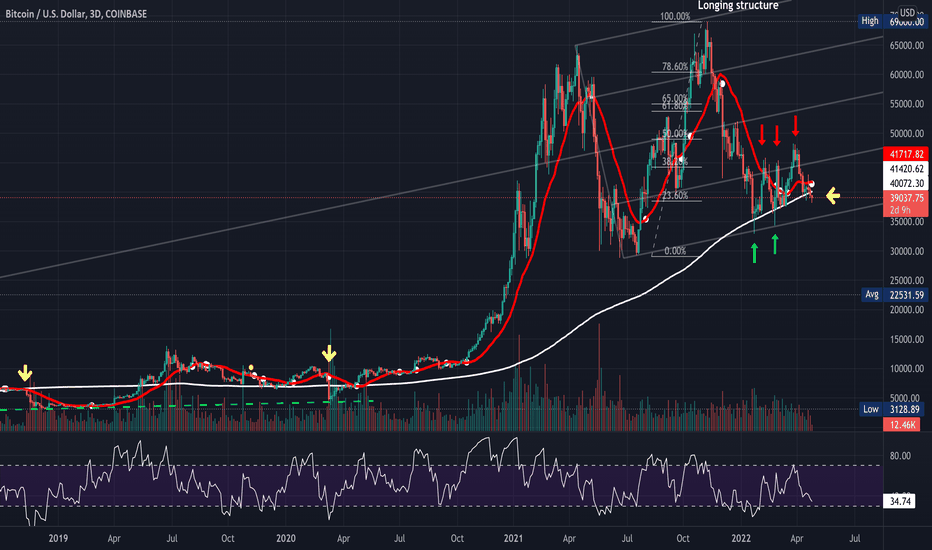
Hello there! I wrote here one week ago that BTC will set the temporary bottom to 38900. The bulls and bears are strongly fighting on this area because there are few encouraging signs for each side - like many times though 🙄. Bullish - you can see a pattern comparable with May-Jul 2021 when BTC found it’s redemption after three strong attempts of the bears in 30k area. Anyway it took three month though while bulls fried their neurons and invoked all gods. This time would be the third time when bulls would trot the bears from this 39k price in the last... three months. Bears – I think an encouraging sign for them is the 3D close below MA200 (white line trend). The last time this happened was Mar 2020 and it was followed by a -47% collapse. And before that in Nov 2018 with comparable impact in price. Well... The bears are pushing down since March. Shouldn’t they breathe... a while... at least? Following 2 days could bring a green candle, which in 3D would be a Hanging man (positive sign) and a close above MA200 (the bulls charm). Moreover this week is the last of the month and is going to be a big week, struggles and crossing swords. All this right above Monthly 20EMA, “scripts” saying it’s a very strong support. And it is the fourth time consecutively tested this year, each time making higher lows. I think it will hold meaning that soon will see BTC up again. Finger crossed... Regards. CristashEven yesterday 3D candle closed below MA200 (see above the story), I think that BTC now has the strengths to climb over 43k. There is an important area where is 3D MA50 and from where, few days ago, BTC dropped 2k against the bulls short term expectations. Looking forward for the week and month closure. A green week candle would be the first one since march. A monthly closure above 43k may bring us another attempt of 48k level as well as 37k possibility. I still bet on upper position. But it's just my thought. Regards.Well, that's how it was... We had to have enough patience to get out of that "swamp." Well, now is the time! We are back in the 69k position, shaking off the dust, and? What to do? :) If we've waited so long and accumulated a bit in the last few months, wouldn't it be a shame to give up now? :)
Christash
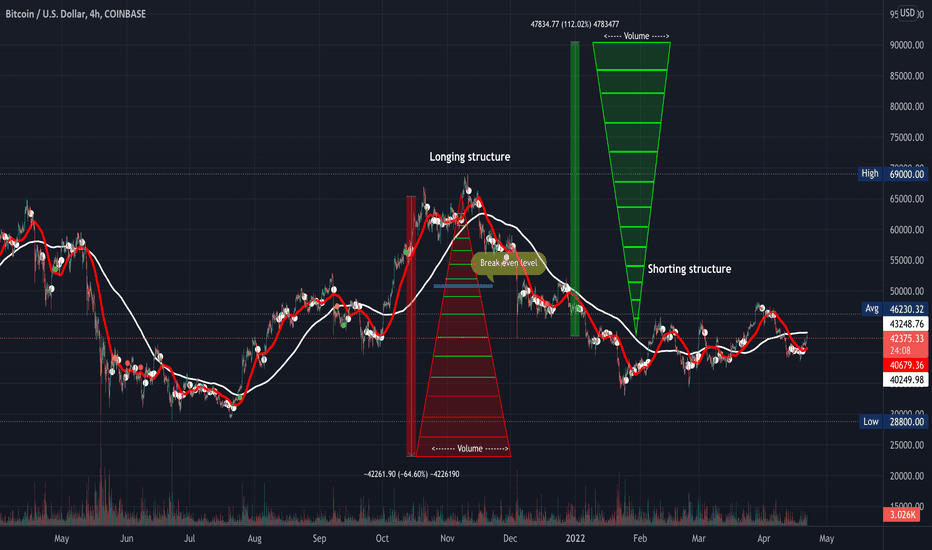
Hey guys, I have receive some messages regarding the strategy shared in my last post, I am showing it here with some graphics for a better understanding. Again, this is my point of view about a strategy that wouldn’t let you uncovered in the moments of ups and down market. By this way I am avoiding the boring times in the downs market moments ;) A.Longing: My current objective is to distribute the funds as to cover orders in an interval down to -65% (red triangle). Enclosed in the triangle you’ll find: Green lines = closed buy orders; Red lines = still open buy order; Note: orders opened from the top down are bigger and bigger in terms of volume. It is ip to you. I consider them with a 1.1-1.2 pace (ex: first buy order at 65700 – 1000 usdt, the second buy order at 62500 – 1200 usdt). By this I am bringing the average buy price (blue line) closer to actual price. In this case I bought from 65700 to 36000 a quantity of x BTC which is 50900 average buying price. a.It means that from now on if BTC is going up over 18% I going into the profit area. If not, I will accumulate more from 32700, 29500, 26300 and 23100 levels. b.If the market is going up I will choose where to close it. See also the shorting point. B.Shorting It could happen to be caught with some buys on top or to have some BTC that you want to keep or to increase. I am considering and treating this as a distinct wallet / deal. Then I apply the same strategy but with an inverted structure. The trigger could be 4H RSI (over 80-ish). a.BTC price is going up - I am selling step by step and calculating the average sell price; Remember that on long side you did accumulate from lower level. Sometimes if price is strongly rising I am keeping longs open and rising average of the shorts. b.BTC is going down – I have open shorts and sometimes I decide to close them in profit the as much I buy on long structure; This way I am accumulating more BTC. I find this way of trading more enjoyable, active and effective for me. Please note that this is not a financial advice or a strategy that you should apply. Salutare! :)Well, congratulations to everyone who survived yesterday... :) It's not the first time for #bitcoin offering you such a show. For the first timers it could be painful. This shakes will look flat in a few years, the same as previous years are for nowadays. The follow on... A. Longing: by accumulating BTC in steps down to 32900 it means for me a break even line (blue level) at 46200 USD. We've been there yet, not too hard to touch in medium term. From there with all in in BTC even a 10% (avg 50k) would mean good profit and in the same time a release of the funds involved. And from there the next step would be a fresh start with the same strategy B. Shorting: we are already in profit. I can close it here and wait for a strong up move (4h RSI over 80) and begin a new shorting structure like above. Long story short, this strategy touched it's objective (accumulate coins)Back again in the accumulation structure :)Wow! I've waited for a while! But it wasn't different from previous cycles. It's true that accumulation moments can be challenging. It also depends on how inspired we were during those times. I learned something crucial: never to go all in. To stay in the game. Because no matter how little you have trading, it keeps your interest and attention. What do we do from now on? I'm thinking of not making any moves until 90k. What's your opinion? ThanksI'm actually thinking of closing 25% of positions at 80k, where it could be the 100% extension from the previous cycle low to the current cycle low. I believe BTC will grow much more, but by securing profits this way, at least a portion of the previously winning trades becomes tangible. Isn't that right?
Christash
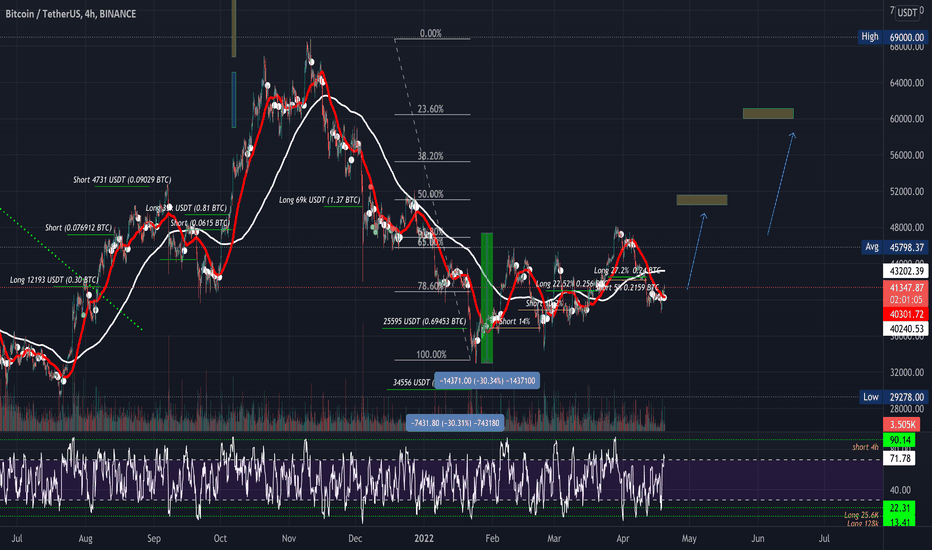
I am often looking on the 4H time-frame ( BTCUSD ). My strategy is to tackle this guy (BTC) from two directions longing and shorting it in the same time but within two distinct actions. Though I never sell the whole quantity of BTC means that on longing side I could be caught up on longer term with open position, trying to cover up to 60%-75% drop. On the other way avoiding boring market actions I am bringing in the short game the quantity of BTC that I already own plus the other from open orders. Profits targeted for the both sides are between 10% up to 20% per deal. The main objective is acquire more BTC. A good short-term set-up is emerging as both the candle action and the 4H RSI are forming a sequence that reminds me about 2nd week of March pattern (series of HL and HH) The price is at the stage where it is above the 4H MA50 (red trend-line) and below 4H MA100 (white trend-line) and is about to come outside of the consolidation pattern. In March happened to broke the resistance within one week. Thus following the same pattern I am planning to target first the 51k area (slightly above 1D 200 MA) than following channel up the 60k area. On short side, the first level of sell would be around 43k, following 45k and so on (avg 3% pace). If the market shakes hard and bears are turning out the price to the 33k level then I will accumulate more coins (longing) and I will try to close lower as possible short positions. What do you think? Feel free to share your work and comments below!The last step of accumulation at 32900. Let's see where it goes...
Disclaimer
Any content and materials included in Sahmeto's website and official communication channels are a compilation of personal opinions and analyses and are not binding. They do not constitute any recommendation for buying, selling, entering or exiting the stock market and cryptocurrency market. Also, all news and analyses included in the website and channels are merely republished information from official and unofficial domestic and foreign sources, and it is obvious that users of the said content are responsible for following up and ensuring the authenticity and accuracy of the materials. Therefore, while disclaiming responsibility, it is declared that the responsibility for any decision-making, action, and potential profit and loss in the capital market and cryptocurrency market lies with the trader.