
ChipsnCheese
@t_ChipsnCheese

What symbols does the trader recommend buying?
Purchase History
پیام های تریدر
Filter
صبر کنید؛ بهترین زمان ورود به معامله متا (Meta) کجاست؟
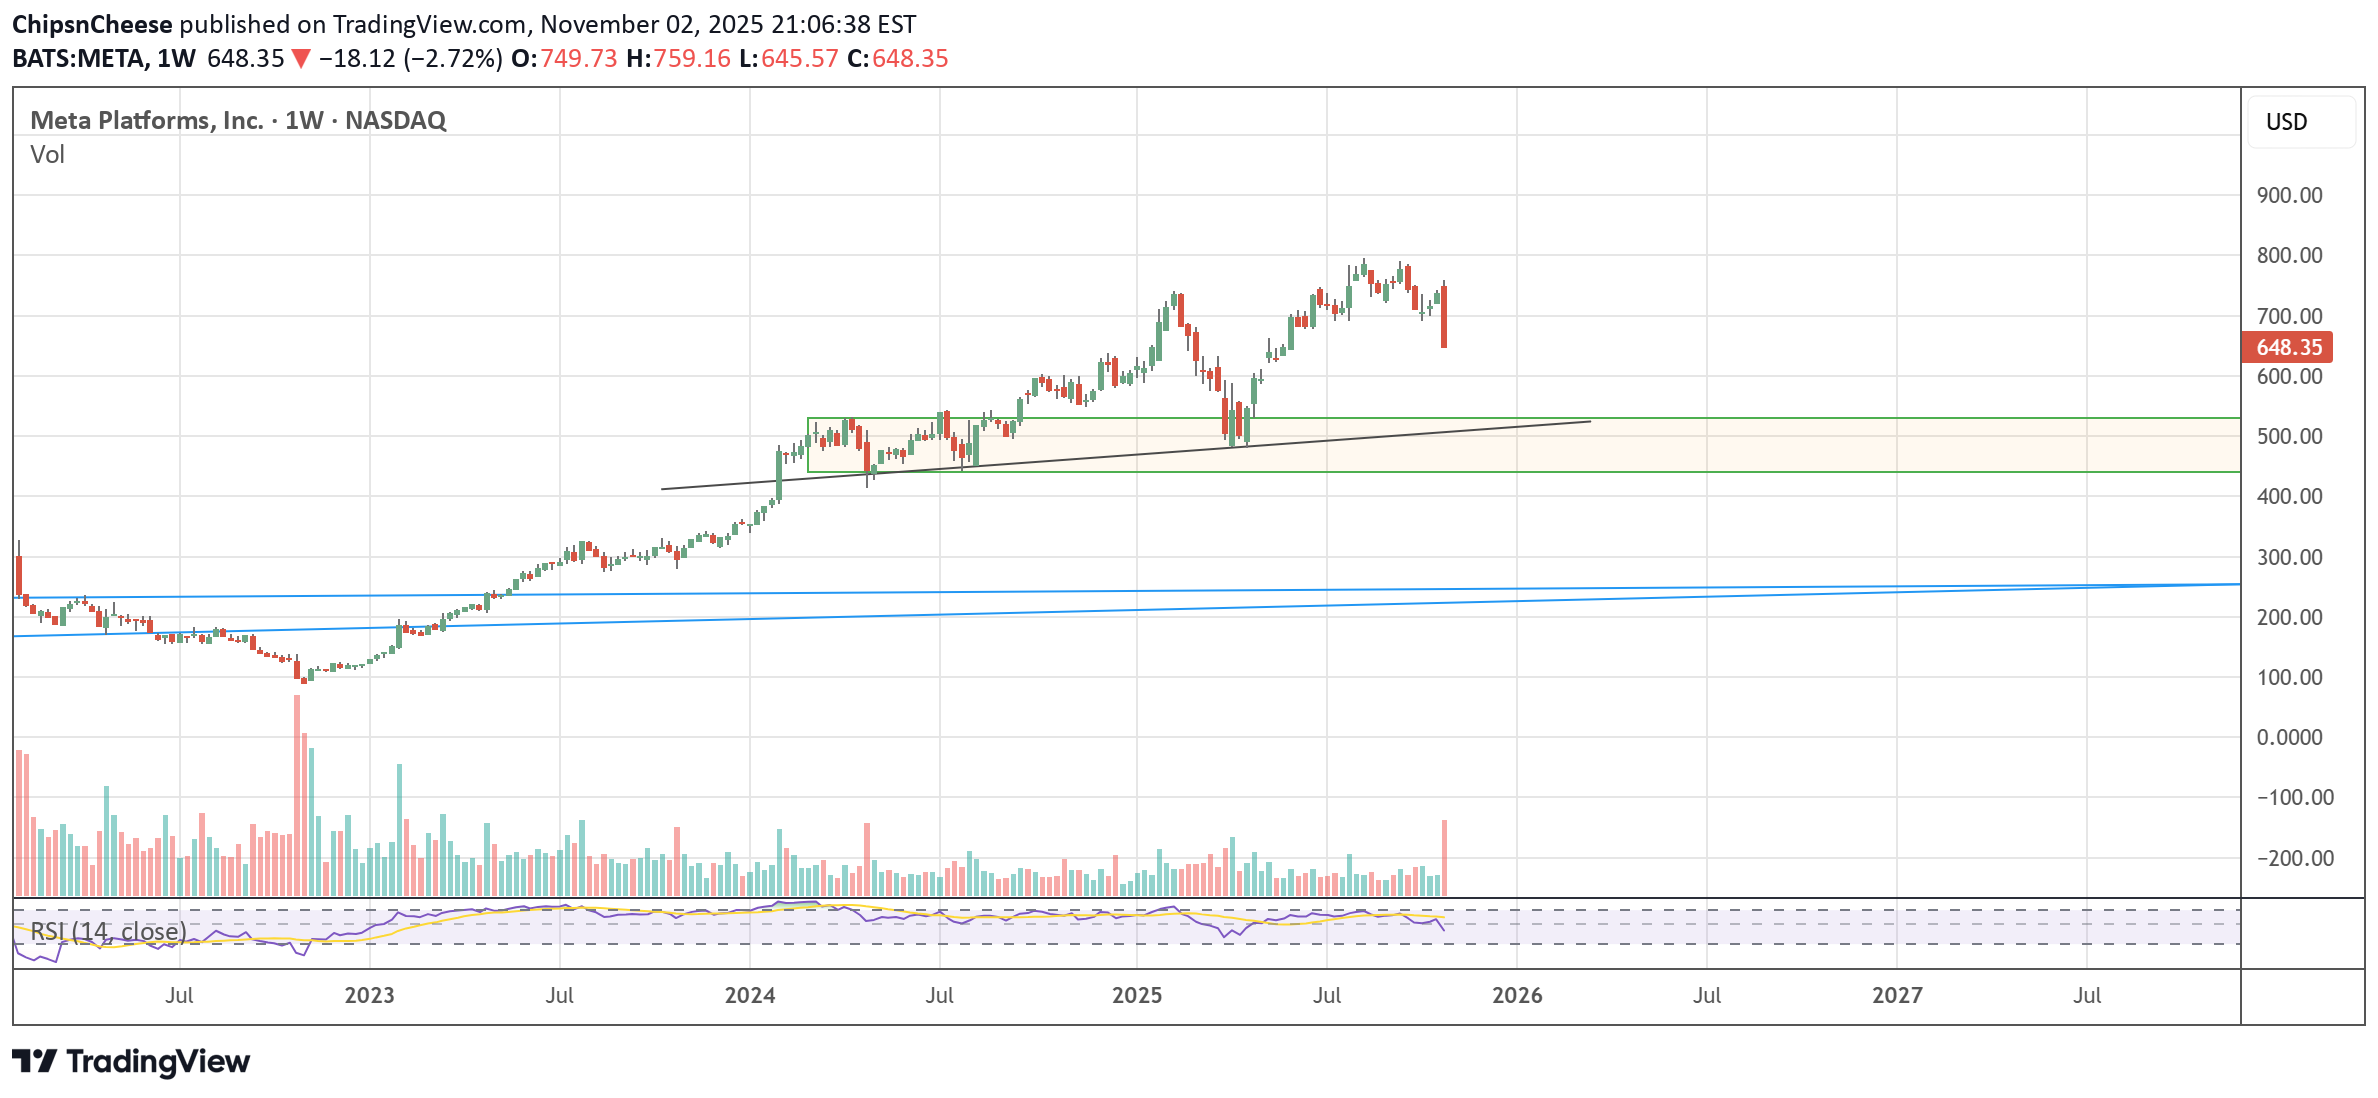
Meta completed its grand cycle 3 on elliot wave structure and entering onto wave 4 now. Wave 4 typically retraces to 0.618 or 0.5 levels of wave 3 which is the zone marked in the box. That zone is also a demand zone and 500 level is the long standing trend line level. If you are eyeing an entry, be patiend and wait for the right level. As the famous adage goes, dont catch a falling knife.
آیا بیت کوین سقوط میکند؟ بررسی فنی دلایل خروج از فاز نزولی!
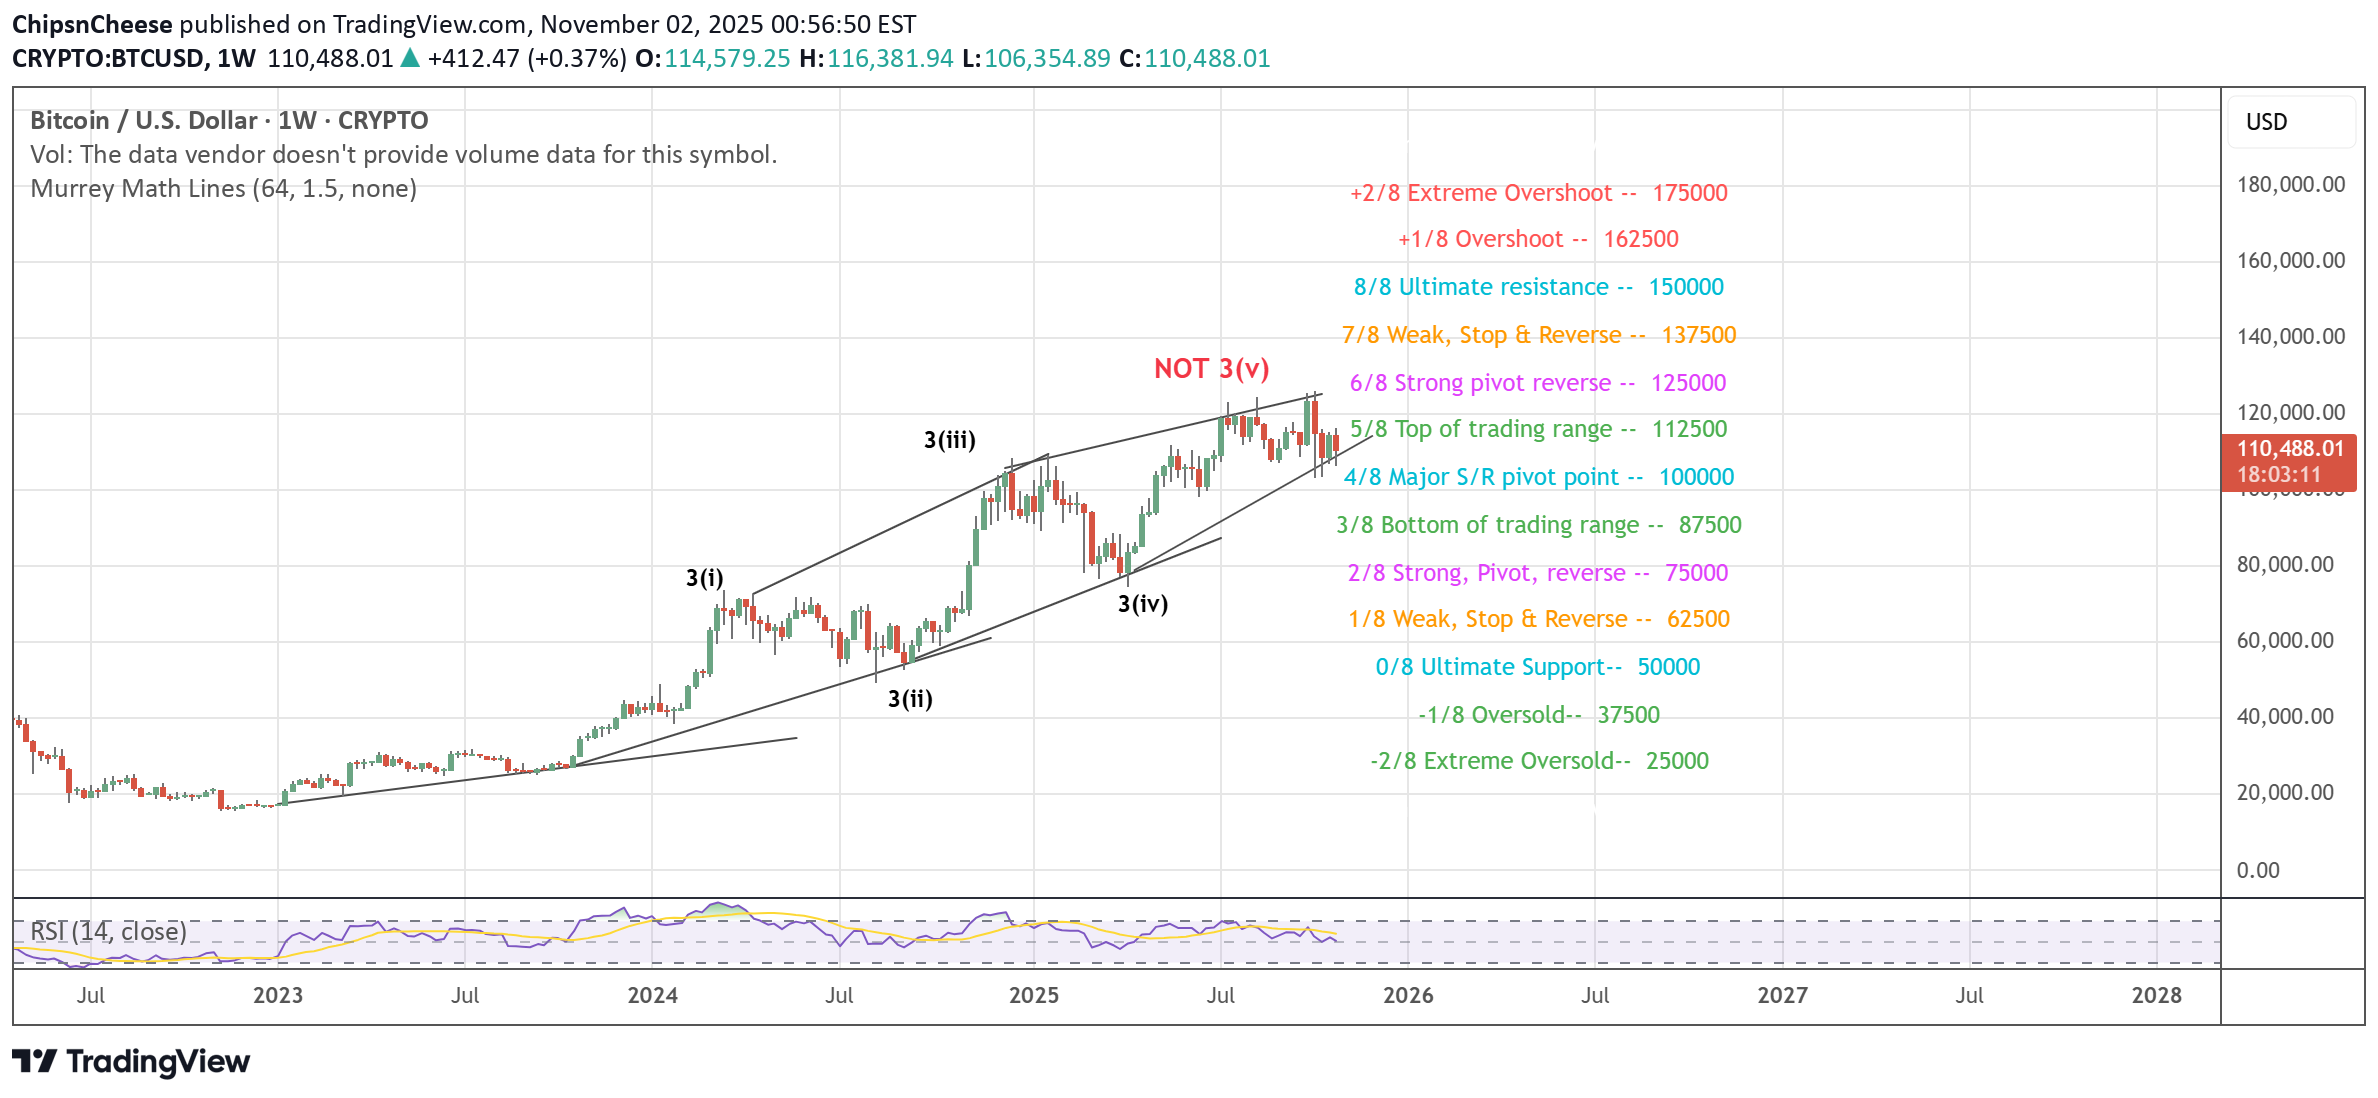
I see a lot of posts talking about how Bitcoin has already topped at 124k and how a major drop is coming. Let's see this from technical view. Let's see what makes people feel bearish and why that theory is not full proof. 1. Decreasing slope of Higher Highs : Its a good indication but in pure TA, it needs to be combined with decreasing slope of higher lows too to mark a trend's end. In BTC chart, we can clearly notice how slode of higher lows is increasing which makes this types of analysis invalid as it depicts a consolidation state 2. Elliot wave : Charts show a potential completion of 3(v) structure. This reasoning has merits but its not conclusive as it doesn't account for wave 3(v) extension. Bitcoin is considered digital gold i.e. a commodity and in commodity, wave v overextends 70-80% of the times (read wave 3(v) = 1.618 wave 3(i), BTC is currently at wave 3(v) = 3(i) and can still go up to 135 to 150k, so this bearish analysis will be inconclusive 3. Bearish trend lines on daily charts : This is a good case but not conclusive because trend lines are supposed to be looked at from different time frames and as they say, when in doubt - Zoom out. So lets zoom out to weekly and look at where we stand. On weekly charts, the current top of 124k coincides with 1.236 of wave 3(iii) and as per Murrey Math's 8 line theory, 1.236 is a powerful zone for reaction with 1.00 levels acting as support, which is very clear on weekly charts. In such scenarios, the final target is typically at 1.618 levels of 3(iii) which stands in 140ks. So if you are a mid term/long term trader - investor, this is not the right time to be bearish on bitcoin. Stay long or worst case neutral, but trend is your friend and there is no conclusive signs of it ending right now.
تحلیل تکنیکال MSTR: فرصت خرید با ریسک بسیار کم و سود نجومی!
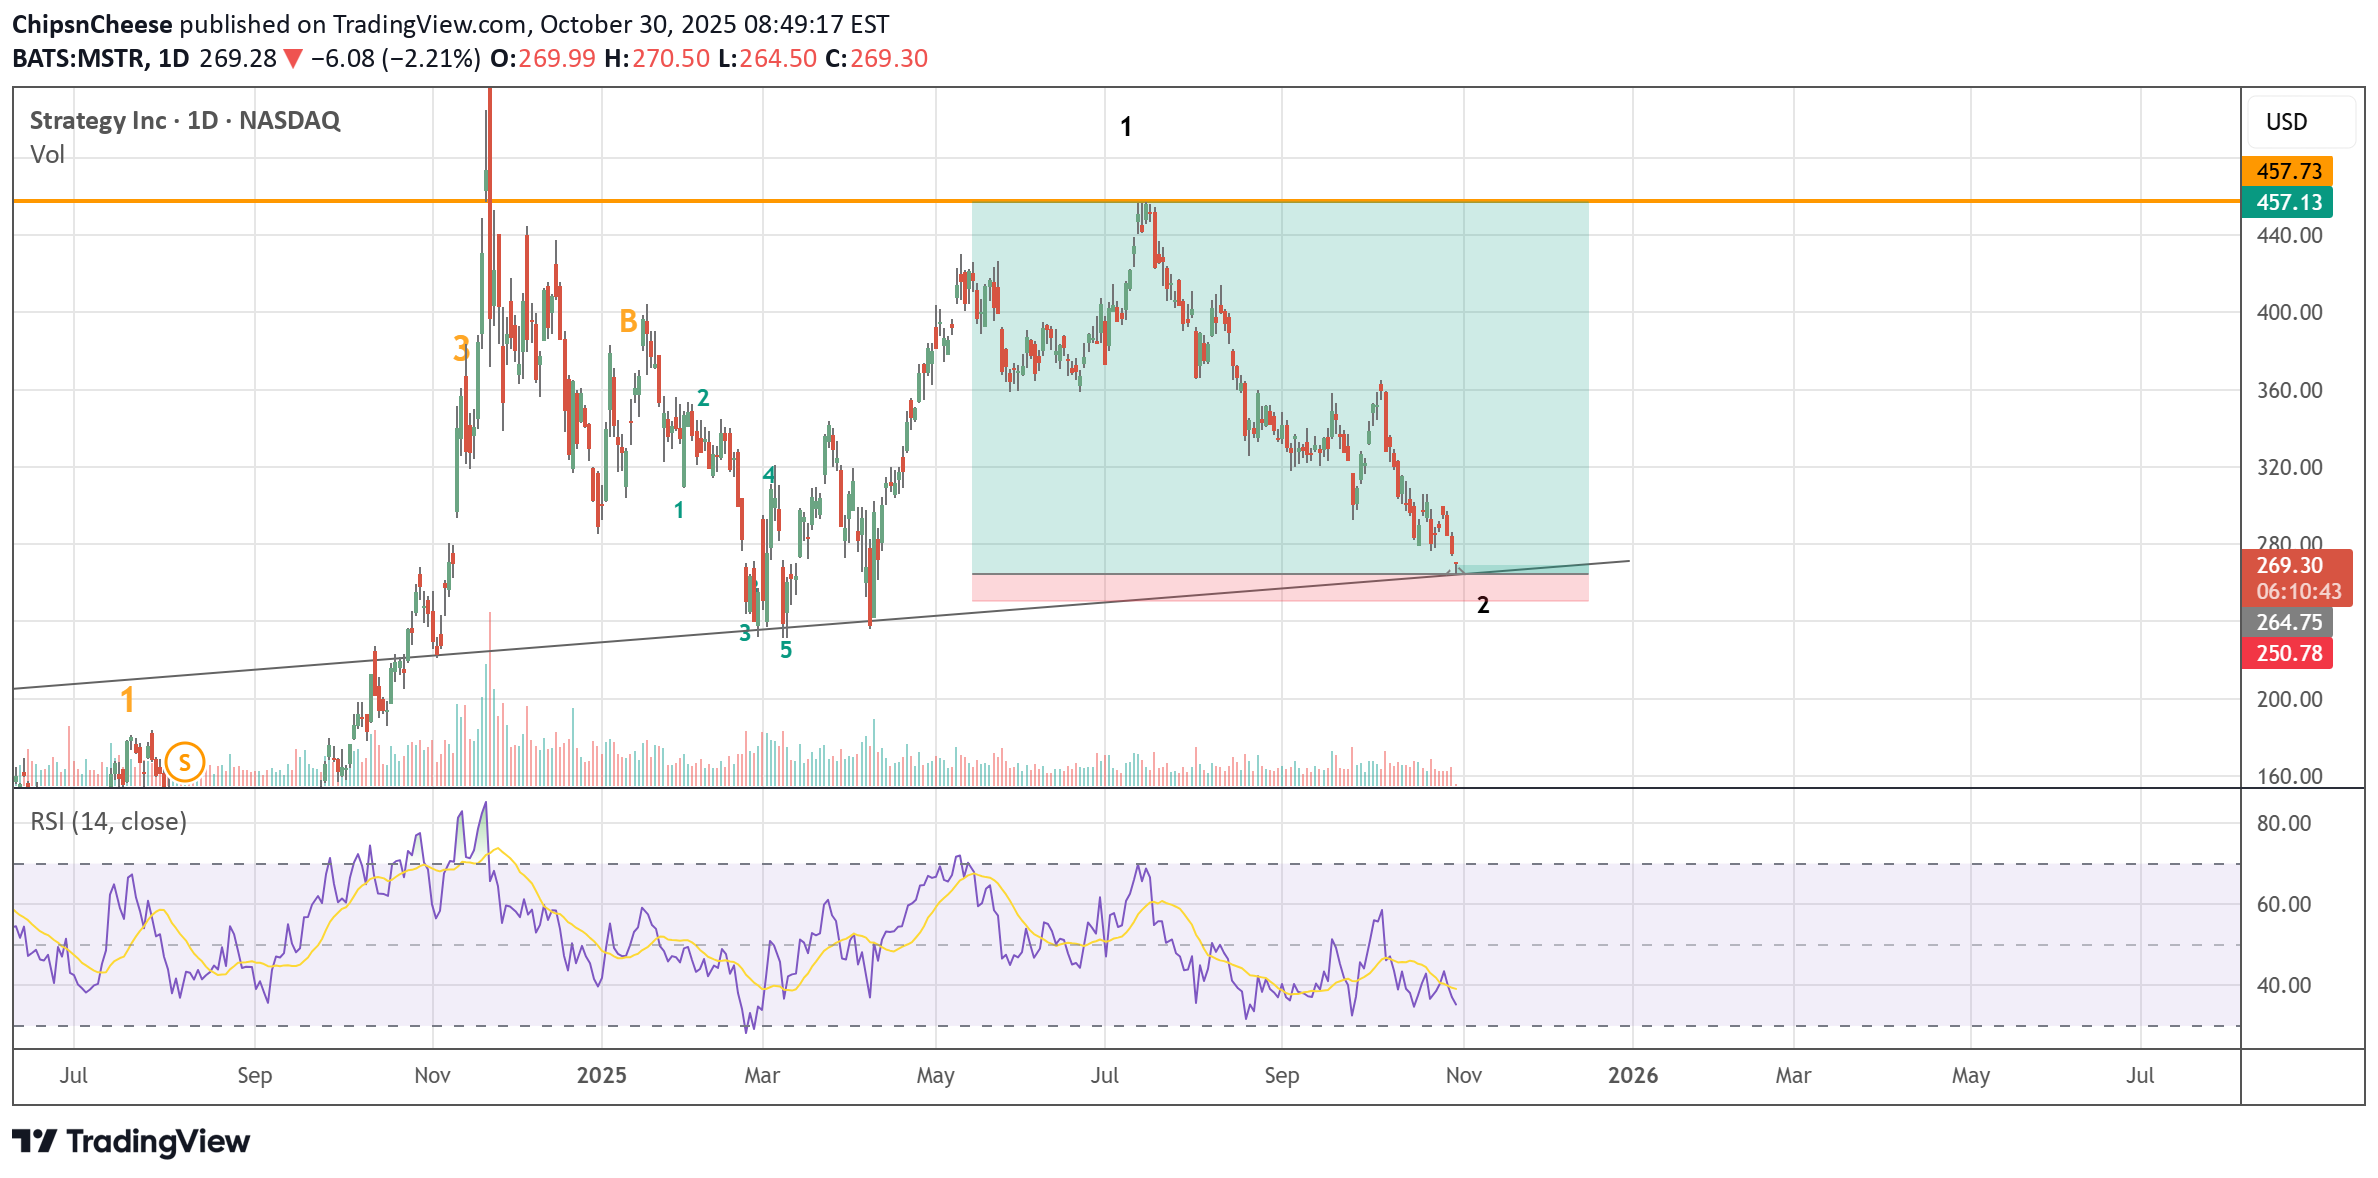
At 267, MSTR is at its long term trend line support. As per ELliot wave it shows the end of corrective waves. Highly profitable entry setup with just 5% risk as stop loss.

My last idea on BTC was a bit premature but at 104k levels we have completed the correction both as per trend lines and as per wave counts on daily, 4 hourly, 1 hourly charts. Time to go long, the cycle's top is getting projected at 140k USD levelsFrom 104k to 124k is going to be a risk free ride now. Being a supply zone previous high, 124k will give resistance. Final target to be between 135k to 150k, will update later on this.Still unsure of final target of this rally, so far we are in middle of a strong wave 3 which likely will end at 129k. It is still a buy and hold for next 10-14 days.The next 7-10 days are going to be interesting, Price change will be picking momentum and BTC will reach to 121k from current 113k levels in no time. From purelty Elliot wave view and considering low volumes, still not very clear if 121k will be a B wave (corrective up wave) end or end of wave 3. WIll update at that level again.current price 108460, on 4 hr chart the wave structure is still showing correction insteasd of upward momentum. 1. On weekly charts the higher highs slope is significantly decreased but higher lows is increased - means consolidation. 2. There is going to be a bounce back to 110k levels in next hours, but if the bounceback is weak and the prices start turning down again, we will close all long positions as it may be start of a significant downtrend again. Its a text book stay cautious zone, if you are long and entered at 104k, stay long, new entries on both long and short side to be avoided.At 108.9k, BTC appears to have completed 3(ii) strcuture too, the structure is looking more and more bullish, this week should seem some fast movesUpward impulse wave structure broke, closing trade at 107k. Smaller time frame is still corrective.
Disclaimer
Any content and materials included in Sahmeto's website and official communication channels are a compilation of personal opinions and analyses and are not binding. They do not constitute any recommendation for buying, selling, entering or exiting the stock market and cryptocurrency market. Also, all news and analyses included in the website and channels are merely republished information from official and unofficial domestic and foreign sources, and it is obvious that users of the said content are responsible for following up and ensuring the authenticity and accuracy of the materials. Therefore, while disclaiming responsibility, it is declared that the responsibility for any decision-making, action, and potential profit and loss in the capital market and cryptocurrency market lies with the trader.