Technical analysis by ChipsnCheese about Symbol BTC on 11/2/2025

ChipsnCheese
آیا بیت کوین سقوط میکند؟ بررسی فنی دلایل خروج از فاز نزولی!
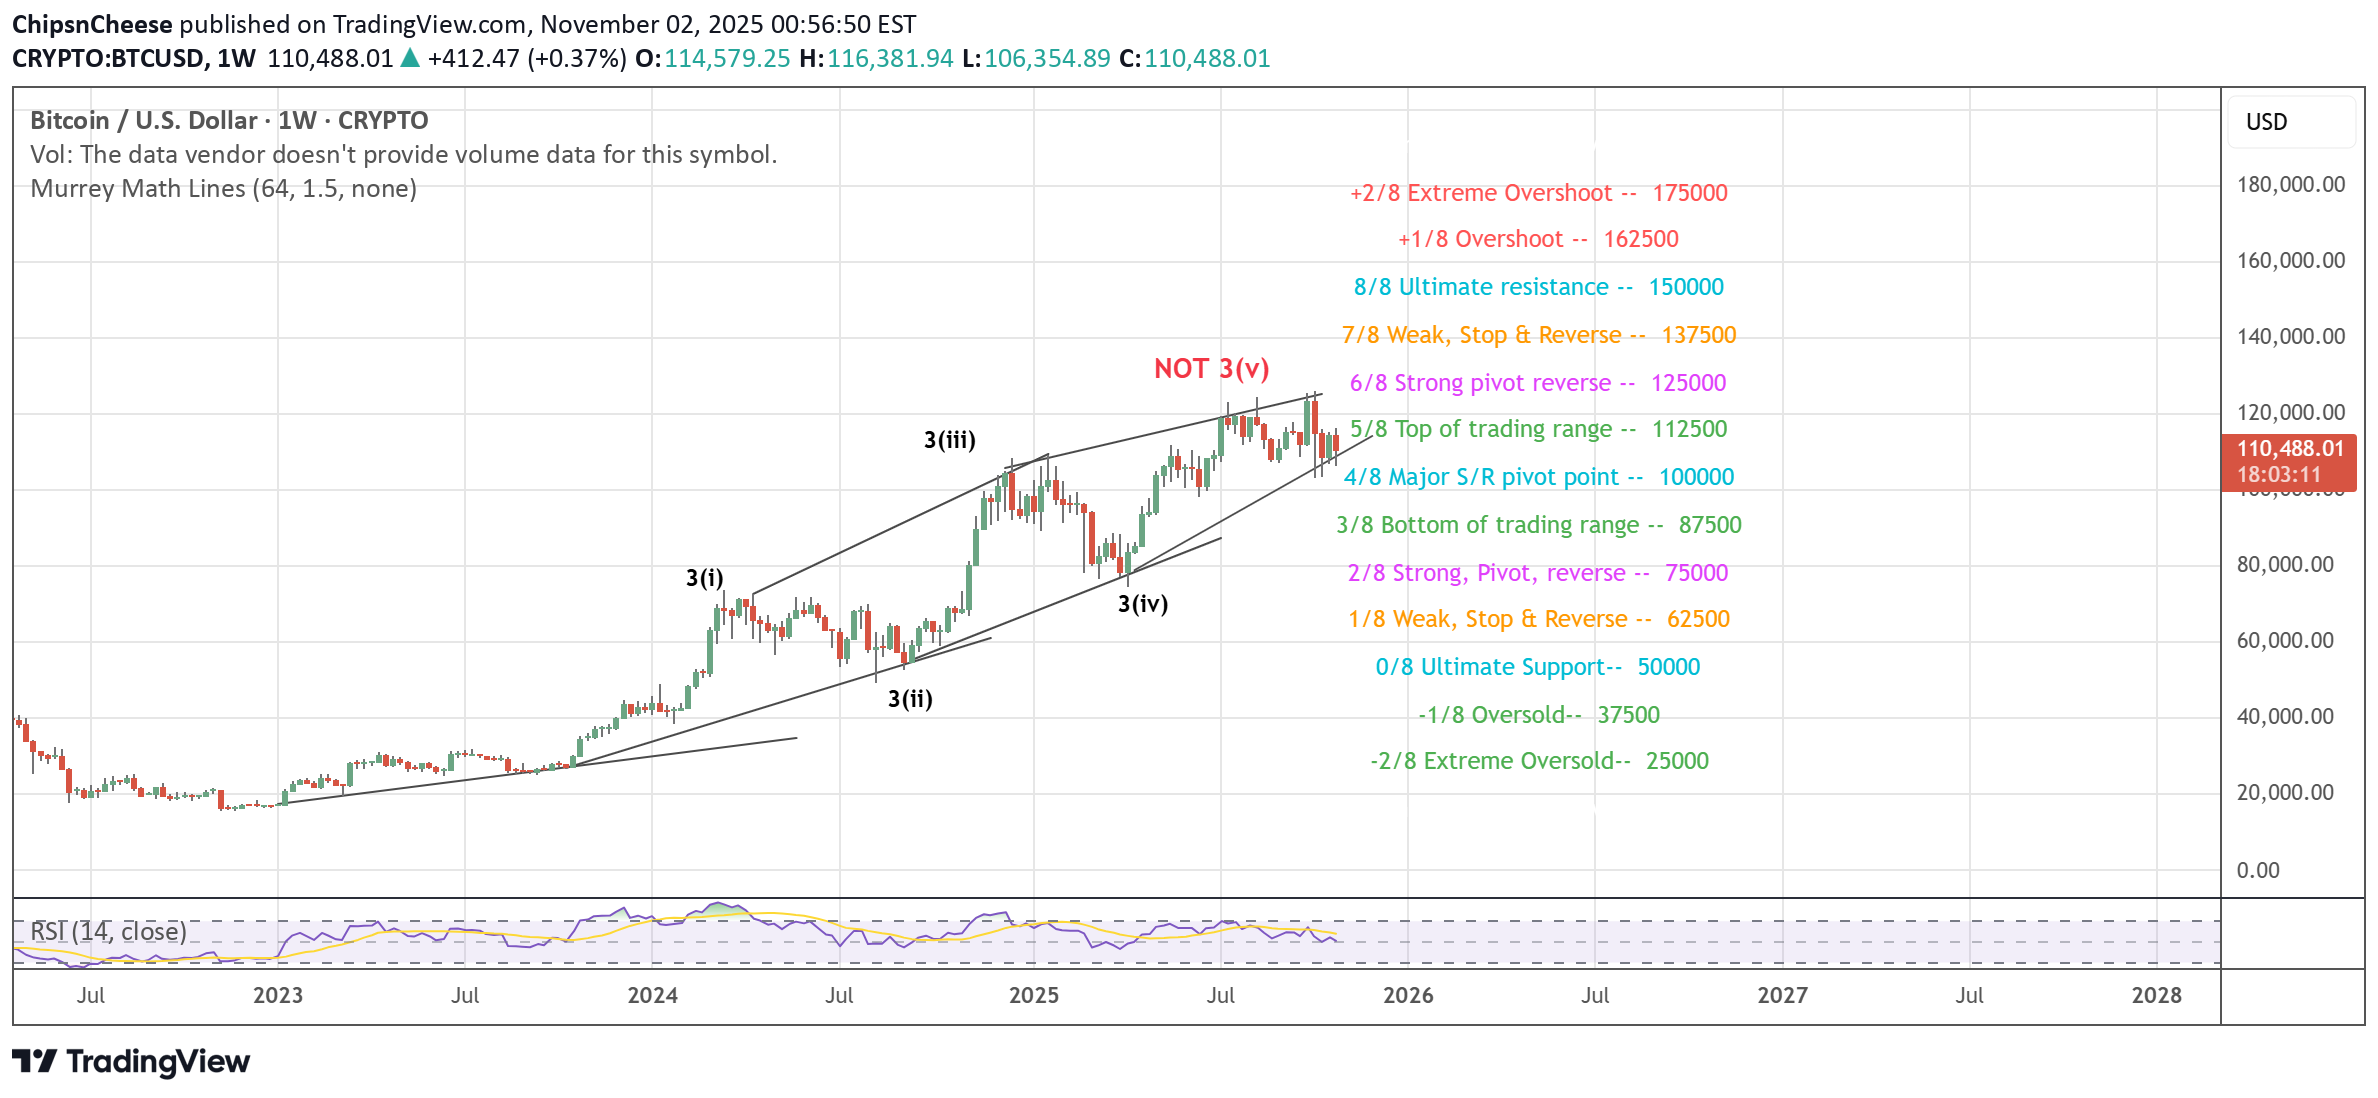
I see a lot of posts talking about how Bitcoin has already topped at 124k and how a major drop is coming. Let's see this from technical view. Let's see what makes people feel bearish and why that theory is not full proof. 1. Decreasing slope of Higher Highs : Its a good indication but in pure TA, it needs to be combined with decreasing slope of higher lows too to mark a trend's end. In BTC chart, we can clearly notice how slode of higher lows is increasing which makes this types of analysis invalid as it depicts a consolidation state 2. Elliot wave : Charts show a potential completion of 3(v) structure. This reasoning has merits but its not conclusive as it doesn't account for wave 3(v) extension. Bitcoin is considered digital gold i.e. a commodity and in commodity, wave v overextends 70-80% of the times (read wave 3(v) = 1.618 wave 3(i), BTC is currently at wave 3(v) = 3(i) and can still go up to 135 to 150k, so this bearish analysis will be inconclusive 3. Bearish trend lines on daily charts : This is a good case but not conclusive because trend lines are supposed to be looked at from different time frames and as they say, when in doubt - Zoom out. So lets zoom out to weekly and look at where we stand. On weekly charts, the current top of 124k coincides with 1.236 of wave 3(iii) and as per Murrey Math's 8 line theory, 1.236 is a powerful zone for reaction with 1.00 levels acting as support, which is very clear on weekly charts. In such scenarios, the final target is typically at 1.618 levels of 3(iii) which stands in 140ks. So if you are a mid term/long term trader - investor, this is not the right time to be bearish on bitcoin. Stay long or worst case neutral, but trend is your friend and there is no conclusive signs of it ending right now.