
ChartingMarketInsights
@t_ChartingMarketInsights

What symbols does the trader recommend buying?
Purchase History
پیام های تریدر
Filter
ChartingMarketInsights
"Gold Breakout Opportunity – Bullish Channel Setup with Buy Sign
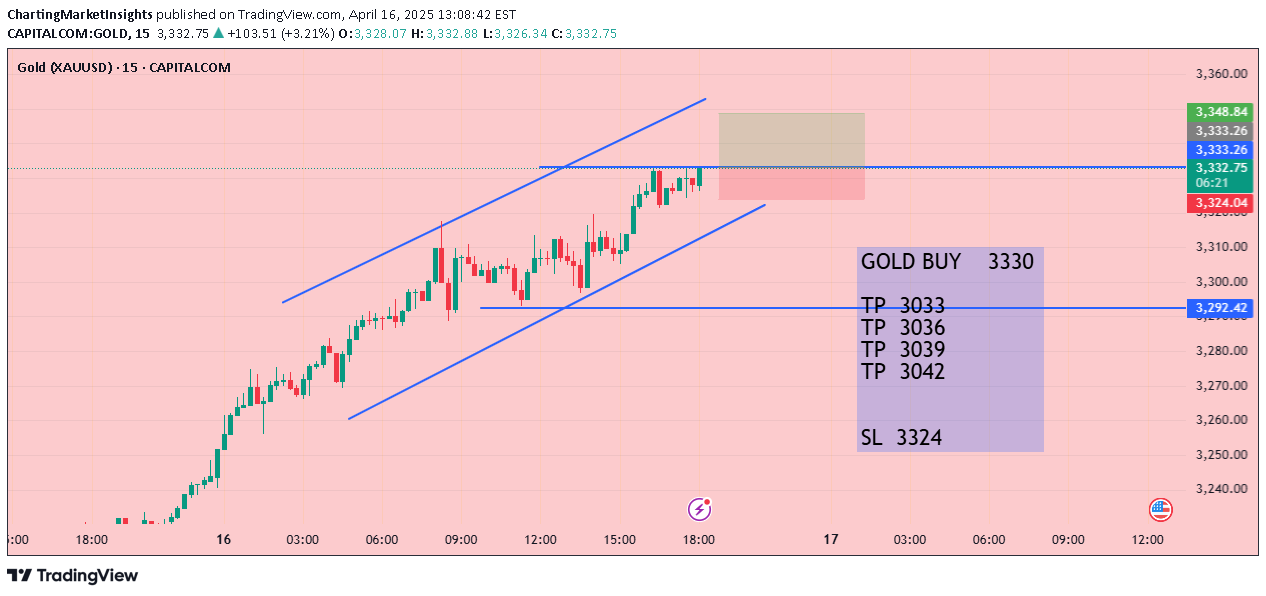
This chart displays a clear bullish channel in Gold (XAU/USD) on the 15-minute timeframe, suggesting strong upward momentum. Price is currently trading near the upper trendline and a potential breakout zone.A buy trade has been suggested at 3330, targeting multiple take-profit levels:TP1: 3033TP2: 3036TP3: 3039TP4: 3042The Stop Loss (SL) is placed at 3324, slightly below recent minor support, to manage risk effectively.The price action remains bullish as long as the price holds above the lower channel support. A breakout above the shaded resistance zone could signal continuation toward higher levels, whereas a breakdown below the SL might invalidate the setup.This setup is ideal for intraday traders looking to capitalize on gold’s upward momentum within the defined channel structure.trade active now quick joine my telegram for more signalsboom boom 3 tp his for more signals joine telegram
ChartingMarketInsights
"Bitcoin Rejection at Trendline – Bearish Breakdown Expected"

This chart shows Bitcoin facing rejection from a descending trendline, indicating potential bearish momentum. After testing the trendline resistance near $85,159, the price dropped sharply, suggesting sellers are in control.The highlighted lower zone between $82,989 and $83,542 represents a key support area. If Bitcoin breaks below this zone, it could potentially move further down toward the next support around $80,842.On the upside, the resistance zone between $85,159 and $86,987 needs to be broken for any bullish reversal. Until then, the overall market sentiment remains bearish with a possible continuation to the downside.tarde continue lets go
ChartingMarketInsights
Gold Breakout Alert: Bullish Momentum Continues Above 3086

🚨 Gold Breakout Alert: Bullish Momentum Continues Above 3086 🚨Trade Analysis (Trader Style):Gold has once again shown strong bullish strength by breaking above the 3086 level. With momentum picking up, we are looking for another ride upward. This breakout confirms buyers are in control — and the path to higher targets is wide open.🔼 Buy Gold Now @ 3086🎯 Target 1: 3088🎯 Target 2: 3090🎯 Target 3: 3092🛑 Stoploss: 3078Bias: BullishTimeframe: 15-Minute (M15)This is a clean continuation setup — those who missed the first move, here’s your second chance to ride the wave! 🚀📈start now trade this time quickboom boom wow tp his enjoy profits so i closed and book profits
ChartingMarketInsights
Gold (XAU/USD) Bullish Breakout Setup

🚨 GOLD TRADE IDEA – BUY SETUP (M15)Gold just smashed through 3068 resistance — bulls in control. Clean breakout, solid momentum. Looking for continuation.💰 Entry: 3074 (Buy now)🎯 TP1: 3078🎯 TP2: 3082🎯 TP3: 3086🛑 SL: 3060🧭 Bias: Bullish🕒 Timeframe: 15-min chartPrice action looks strong — riding the momentum up. Watch those targets. Let the trade work. 📈continue trade quickBOOM BOOM AGAIN MY ALL TP HITSchack my chart post wow120 profits enjoyjoine my telegram for more signalsbook all profits
ChartingMarketInsights
Gold (XAU/USD) Bullish Breakout Setup – April 9, 2025

Gold has broken above a key resistance zone around 3068, signaling a potential bullish continuation. A buy trade is triggered at 3074, expecting further upward momentum toward the next resistance levels.Trade Setup:🔼 Buy Entry: 3074🎯 Target 1: 3078🎯 Target 2: 3082🎯 Target 3: 3086🛑 Stop Loss: 3060Bias: BullishTimeframe: 15-Minute (M15)The breakout candle and strong bullish momentum suggest that gold is gaining strength, with multiple profit targets to the upside.continue trade quice my signals proof in my telegramBOOM BOOM wow wow my all friends 2nd tp hit 80 pips profits close half book for more hits signals $$$$$$ joine my telegram channel $$$$$$$enjoy small trader profits enjoy for more profit joine my telegram
ChartingMarketInsights
Gold (XAU/USD) Intraday Sell Opportunity – April 9, 2025

Gold has shown rejection near the resistance zone around 3068, indicating a possible downside move. A sell trade is initiated at 3058, expecting price to decline toward key support levels.Trade Details:🔽 Sell Entry: 3058🎯 Target 1: 3056🎯 Target 2: 3054🎯 Target 3: 3052🎯 Target 4: 3050🛑 Stop Loss: 3068Bias: BearishTimeframe: 15-Minute (M15)The bearish candle formation and rejection from resistance suggest potential downward momentum, supported by the blue arrow direction in the chart.continue trade is time to sell🔽 Sell Entry: 3058🎯 Target 1: 3056🎯 Target 2: 3054🎯 Target 3: 3052🎯 Target 4: 3050🛑 Stop Loss: 3068Bias: BearishTimeframe: 15-Minute (M15)sorry for the sl hit so joine my telegram for perfact signals
ChartingMarketInsights
Gold (XAU/USD) Bearish Reversal Setup – April 8, 2025

Gold is expected to reverse from the resistance zone near $3013. A sell trade is triggered at 3013, indicating a potential downward movement. The chart highlights multiple target levels as the price is likely to decline.Trade Setup:🔽 Sell Entry: 3013🎯 Target 1: 3009🎯 Target 2: 3005🎯 Target 3: 3000🛑 Stop Loss: 3020Bias: BearishTimeframe: 15-Minute (M15)The strong rejection from the resistance zone and the highlighted red area suggest selling pressure. A downward move is anticipated, as marked by the blue arrow.now sell time trade active nowmy proof in telegram link in bioboom boom tp 1 hit 40 pips profitsmore signals in telegramBOOM BOOM TP 2 HIT 80 pips profits chack my chart in bio for more accurate signals in my telegram bio link
ChartingMarketInsights
sell now gold 3013

Sell Now 3013Target Point : 3009Target Point : 3005Target Point : 3000Stoploss : 3020trade active now continue trads
ChartingMarketInsights
Gold (XAU/USD) Sell Setup – April 8, 2025

Gold is expected to move downward after hitting resistance around the $3000 level. A sell position is suggested at 3000, targeting the following take-profits:TP1: 2998TP2: 2996TP3: 2994TP4: 2992TP5: 2990TP6: 2988🔻 Stop Loss (SL): 3013🔻 Bias: Bearish📊 Timeframe: 15-Minute (M15)A downward move is anticipated from the resistance zone, as marked by the red zone and the blue arrow pointing down.trad now continue start sell xauusdnow sell time quick fast nowif you want to prof my signals joine telegramsell time quick fastproof in my telegram link in bio
ChartingMarketInsights
gold sell setup bearish rejection zone 3036

🔻 Gold Sell Setup - Bearish Rejection Zone (3026) 🔻This is a potential short (sell) setup for Gold (XAUUSD) around the 3026 level. The price is showing signs of rejection near a key resistance zone. The setup is based on a clear structure with multiple take profit (TP) levels and a well-defined stop loss (SL), offering a favorable risk-to-reward ratio.📌 Sell Entry: 3026🎯 Take Profits:TP1: 3024TP2: 3022TP3: 3020TP4: 3018🛑 Stop Loss: 3036🧠 Analysis Insight:The price has tested the resistance zone multiple times and failed to break above it, indicating possible exhaustion of bullish momentum. If price holds below 3026, we can expect a bearish push towards the take profit targets. A break above 3036 would invalidate this setup.📉 Trade with proper risk management and watch for confirmation before entering.📉 Trade with proper risk management and watch for confirmation before entering.come on trade active sell gold 3026 quick fast now sell
Disclaimer
Any content and materials included in Sahmeto's website and official communication channels are a compilation of personal opinions and analyses and are not binding. They do not constitute any recommendation for buying, selling, entering or exiting the stock market and cryptocurrency market. Also, all news and analyses included in the website and channels are merely republished information from official and unofficial domestic and foreign sources, and it is obvious that users of the said content are responsible for following up and ensuring the authenticity and accuracy of the materials. Therefore, while disclaiming responsibility, it is declared that the responsibility for any decision-making, action, and potential profit and loss in the capital market and cryptocurrency market lies with the trader.