
BrytJoy
@t_BrytJoy

What symbols does the trader recommend buying?
Purchase History
پیام های تریدر
Filter
BrytJoy
XRP/USDT – Bullish Breakout With 35% Upside Potential
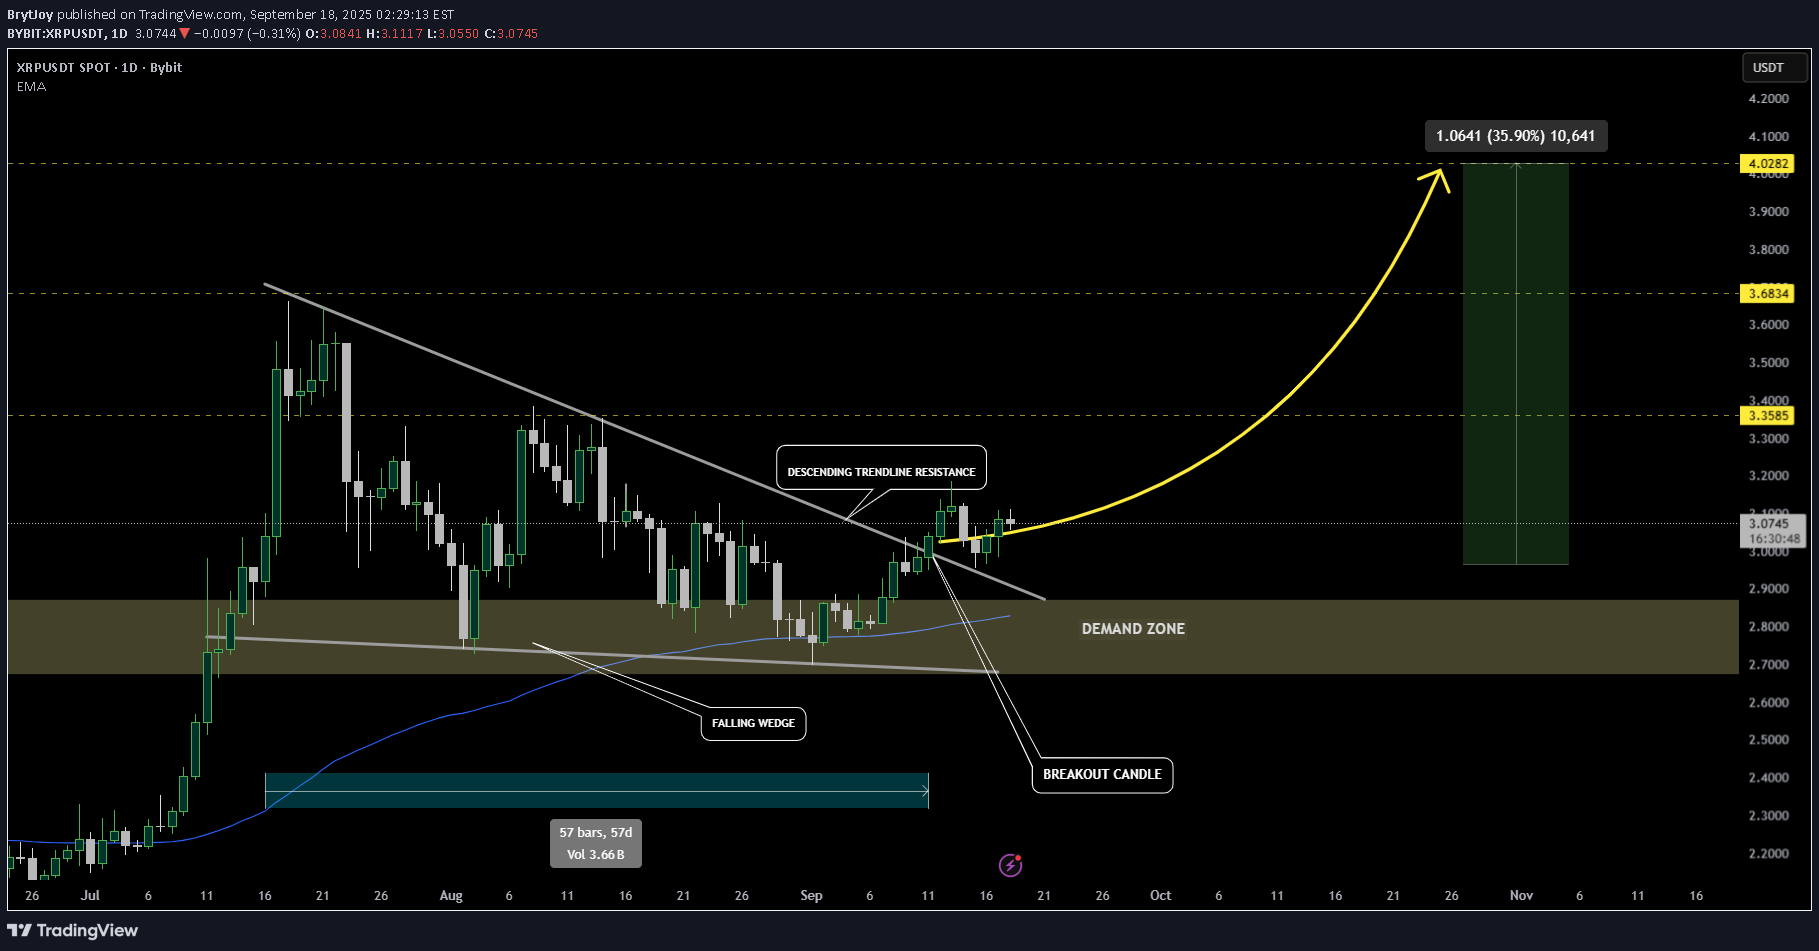
XRP on USDT market pair is showing good strength here after finally breaking out of that descending trendline resistance that’s been holding since mid-July (57 days). We also had a falling wedge breakout and price is now consolidating just above the old resistance, which has flipped into support. That’s usually a strong continuation sign. The retest around $2.90–$3.00 held up perfectly, lining up with the 100 EMA, which makes that zone solid support. I’m watching $3.35 and $3.68 as the first targets as long as its above demand zone. Bigger picture, XRP could stretch toward $4.02 (around +35% from here), which lines up with the mid-range resistance from earlier in the year. What do you think? Alts season looming? #XRP #ALTSEASON
BrytJoy
DOGEUSDT – Adam & Eve Pattern Targets $0.43
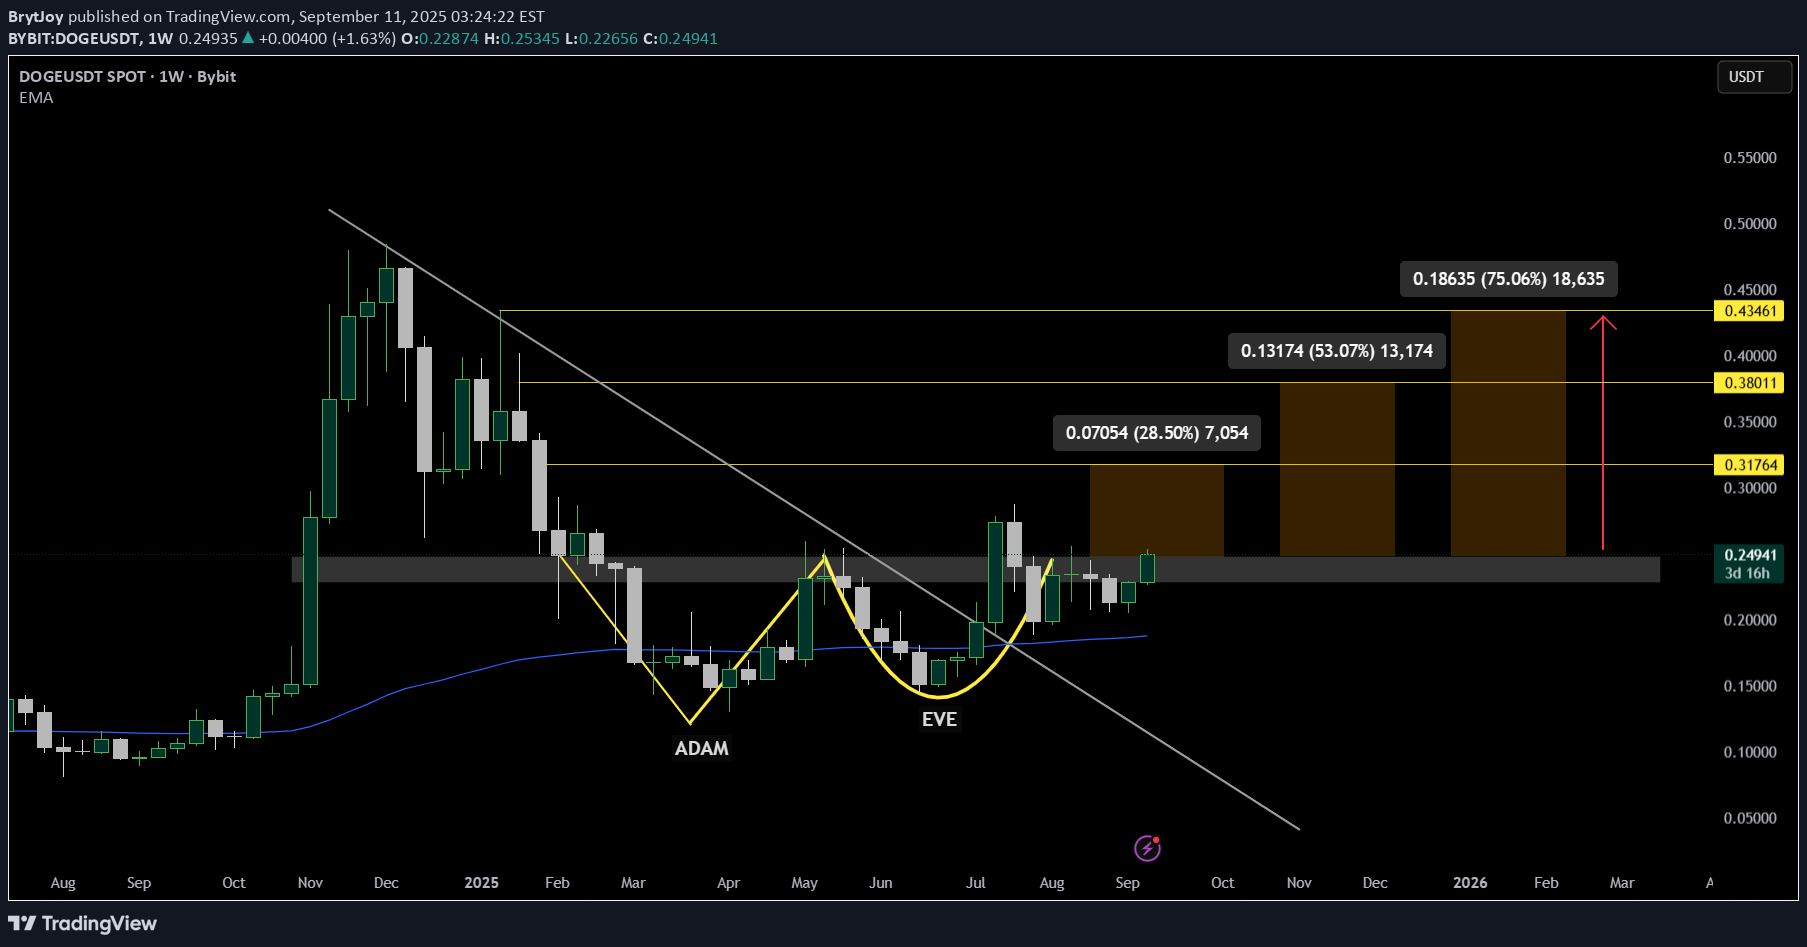
DOGE on USDT market pair is gearing for a move upside after breaking out above the descending trendline. With price forming an ADAM & EVE pattern, it going to provide an opportunity for bulls to obtain profits from a bullish rally with it now accumulating at pattern's neckline. Key upside targets are marked at $0.317, $0.380, and $0.434, As long as DOGE holds above $0.23,it remains bullish. A weekly close below this level would weaken the structure and could trigger a retest toward $0.20.
BrytJoy
BTCUSDT – 3 Black Crows Signal Reversal at Resistance?
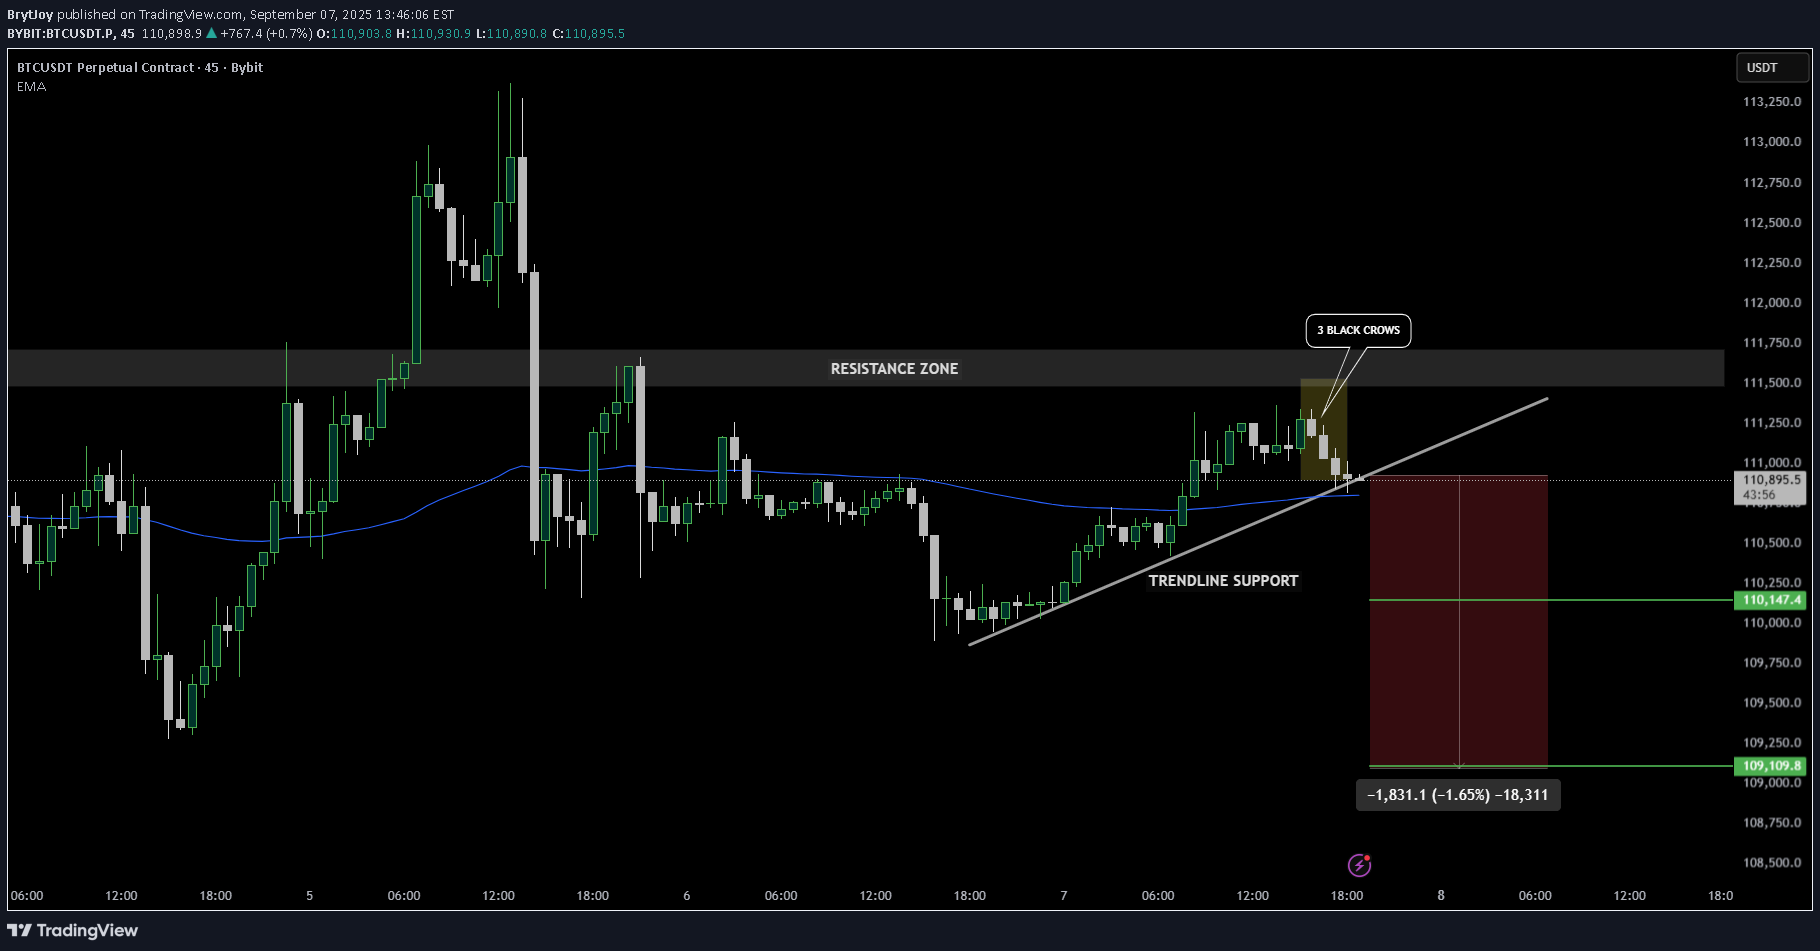
BTC is hovering around 110.9k after failing to break through the 111.3k–111.6k resistance zone. The rejection was followed by a Three Black Crows pattern, which often appears near market tops or at key supply zones. On the 45-minute chart, price is testing an ascending trendline that has been supporting the recent recovery. The EMA at 110.8k is sitting right on this same area, creating a confluence that makes this level very important in the short term. The first area to watch on the downside is 110.1k and a break beneath that could extend the move toward 109.1k, , On the flip side, if bulls defend the trendline successfully, price could rebound for another test of 111.3k–111.6k, but only a breakout above that zone would flip the short-term outlook back to bullish.Setup Invalidated
BrytJoy
SEI/USDT | Falling Wedge Breakout With 30% Upside Potential
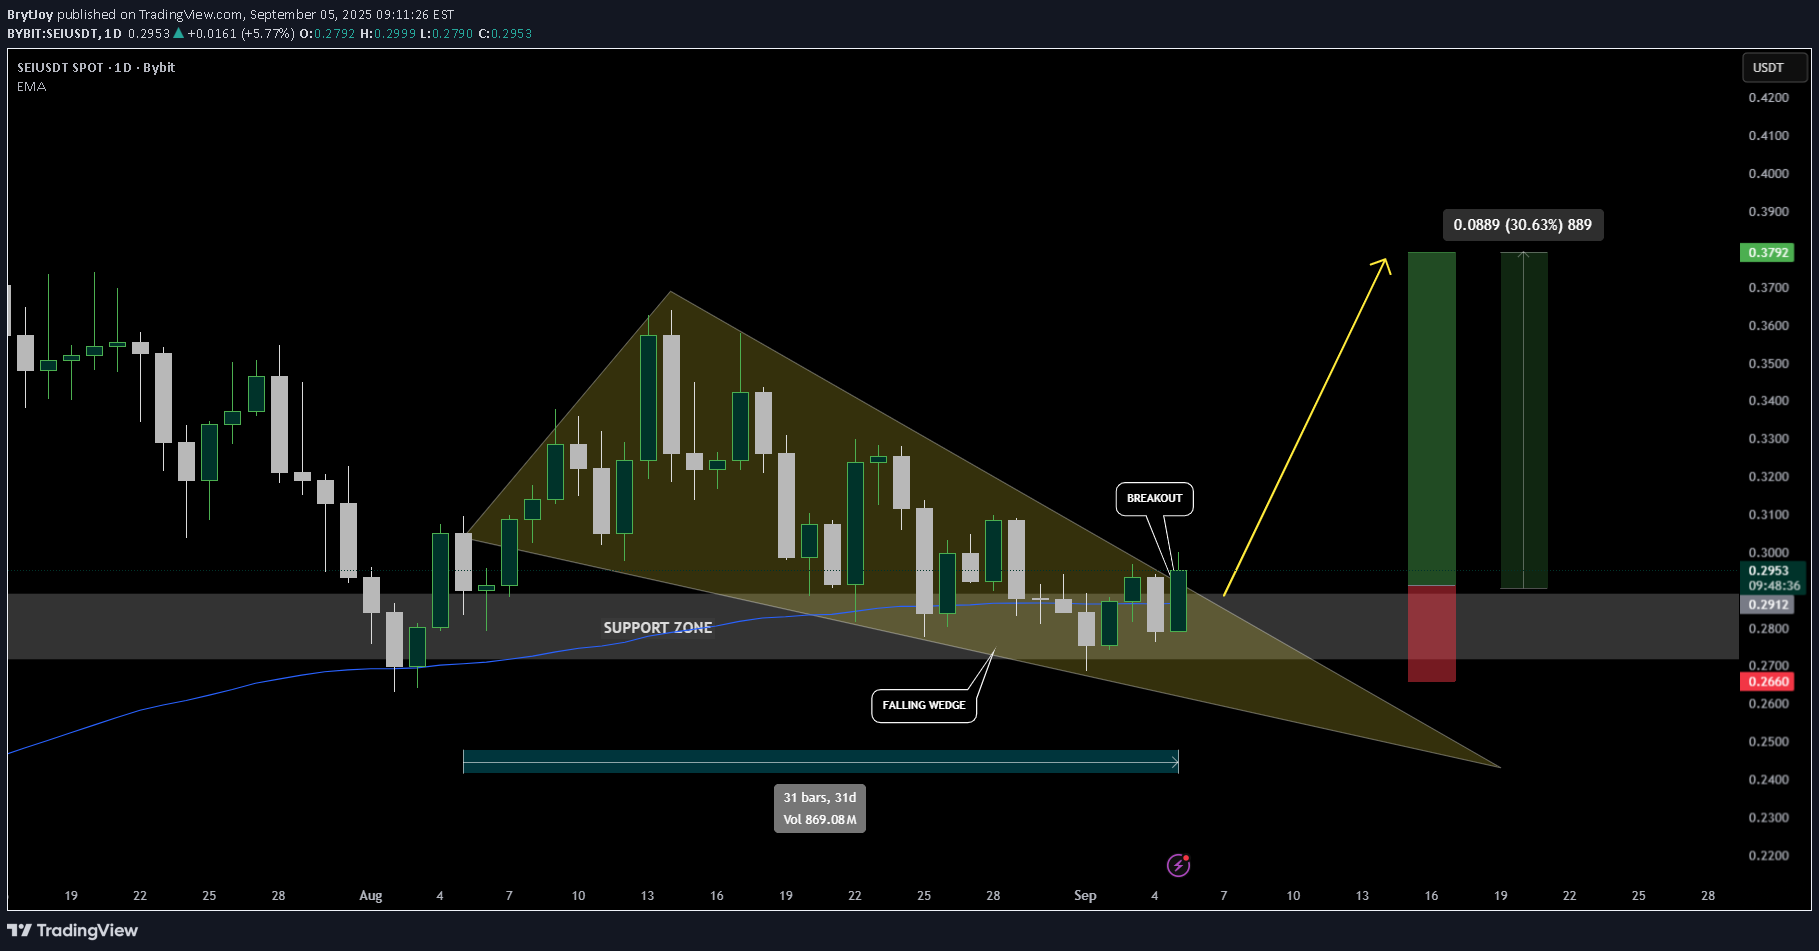
SEI/USDT is breaking out of a falling wedge on the daily timeframe after 31 days of downtrend consolidation, right above the key $0.27–0.29 support zone and the 100 EMA. with a potential target around $0.379 (+30%). Short-term resistance sits near $0.32 and $0.35, areas to watch for possible profit-taking before continuation. As long as price holds above $0.266, the setup remains valid. #SEI #SEIUSDT #Crypto #AltcoinsTrade was activatedfirst take profit zone $0.32 hitsecond take profit zone hit $0.35+26% move before dip
BrytJoy
XAUUSD – Rising Wedge Breakdown Setup
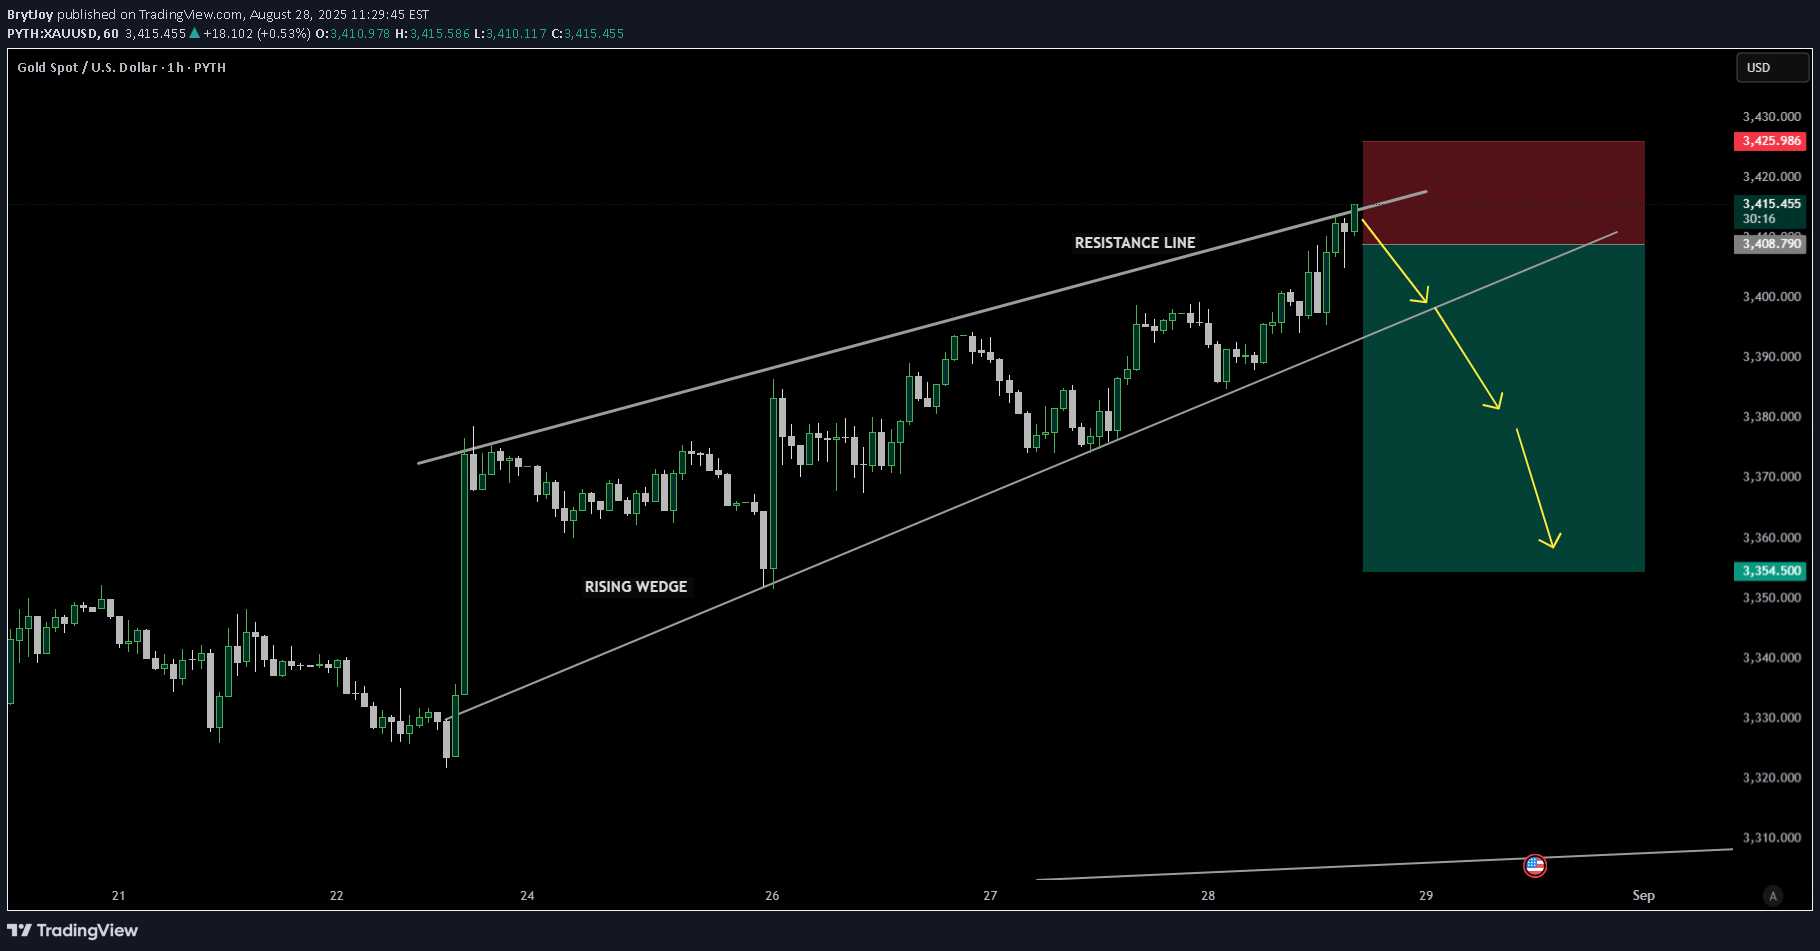
Gold is trading inside a rising wedge, a pattern that often signals bearish reversal. 📉 Price is testing resistance around 3415 – 3425. Failure to break higher could trigger a drop. Trading Plan: Short on rejection or break below 3408 support 🎯 Targets: 3390 → 3370 → 3354 ❌ Invalidation: Close above 3425 Bias remains bearish unless bulls reclaim higher levels. #XAUUSD #Gold #PriceAction #Trading #Forex #ChartAnalysisTrade got activated after price got rejected around resistance zoneSL was touched
BrytJoy
BTCUSDT Inverse H&S in Play: Breakout or Fakeout
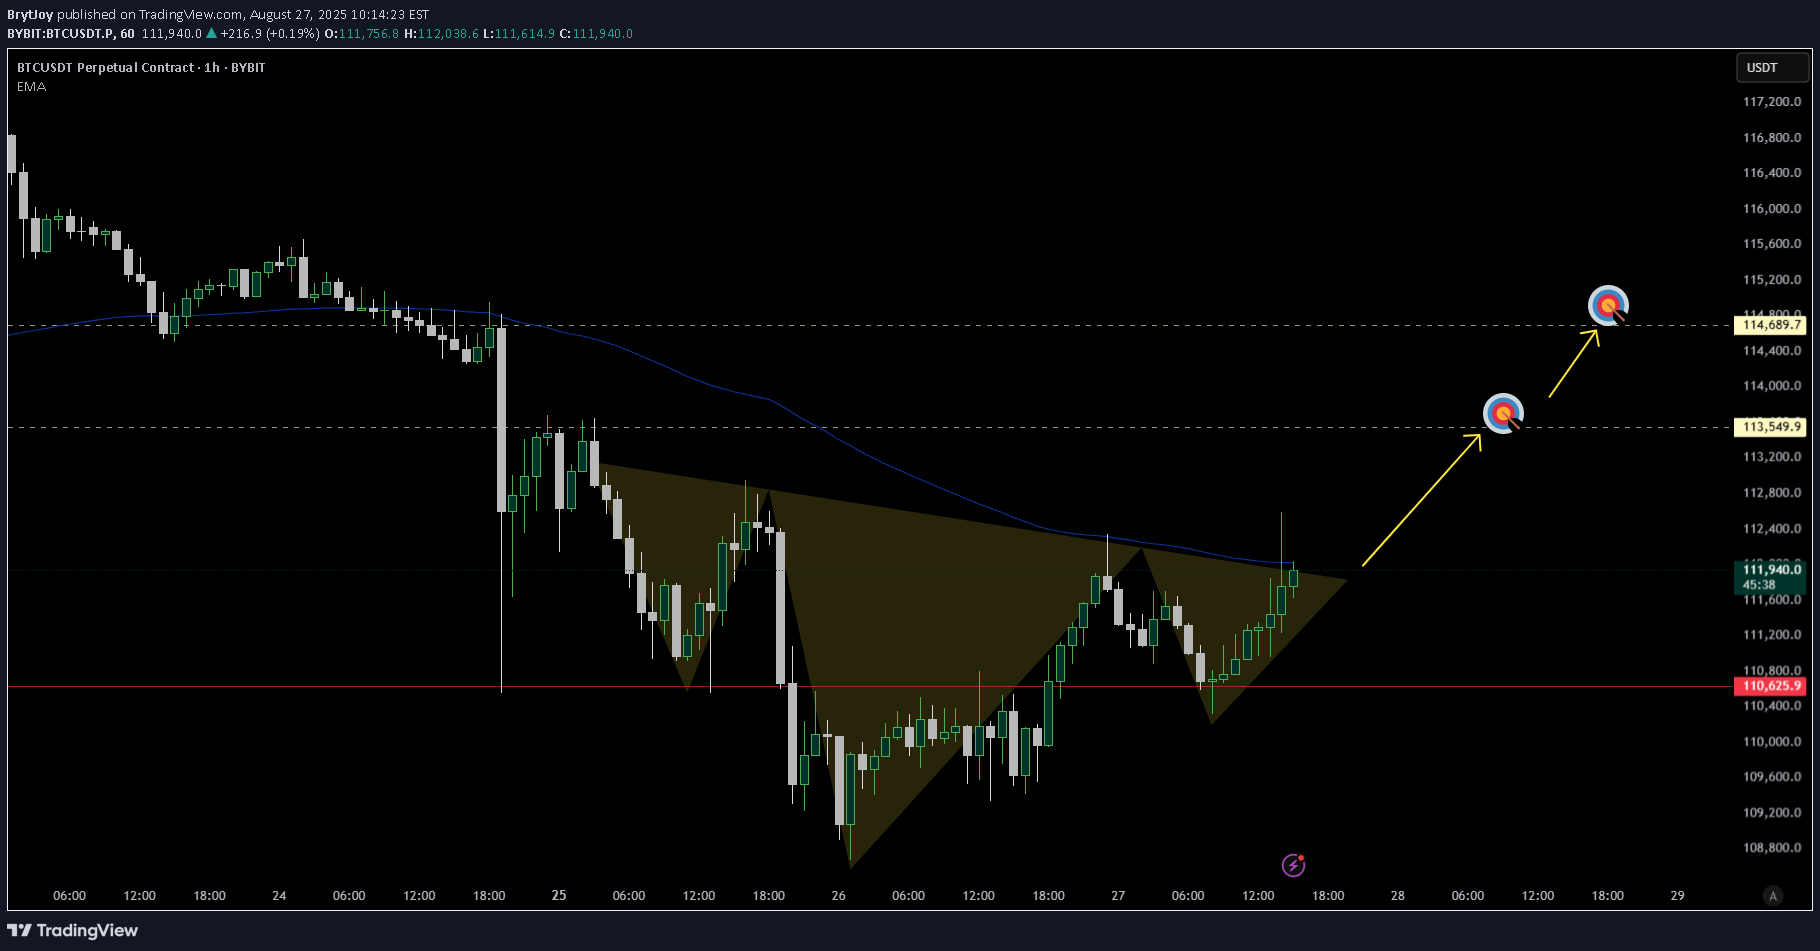
BTC is forming an inverse head and shoulders on the 1H chart, signaling a potential bullish reversal. The neckline sits near 112,000 USDT, aligning with EMA resistance. A confirmed breakout above this zone could open targets at 113,549 and 114,689. Failure to break higher and a drop below 111,000 would invalidate the pattern. Price action at the neckline will be key in confirming the next move. What's your take guys? Are you long? #BTCUSDT #BitcoinTrading #CryptoCharts #PriceActionTrade got activated upon break of 112000 necklinePrice came back to entry after missing target 1 by couple of $
BrytJoy
BTCUSDT – Break & Retest Signals Potential Downside
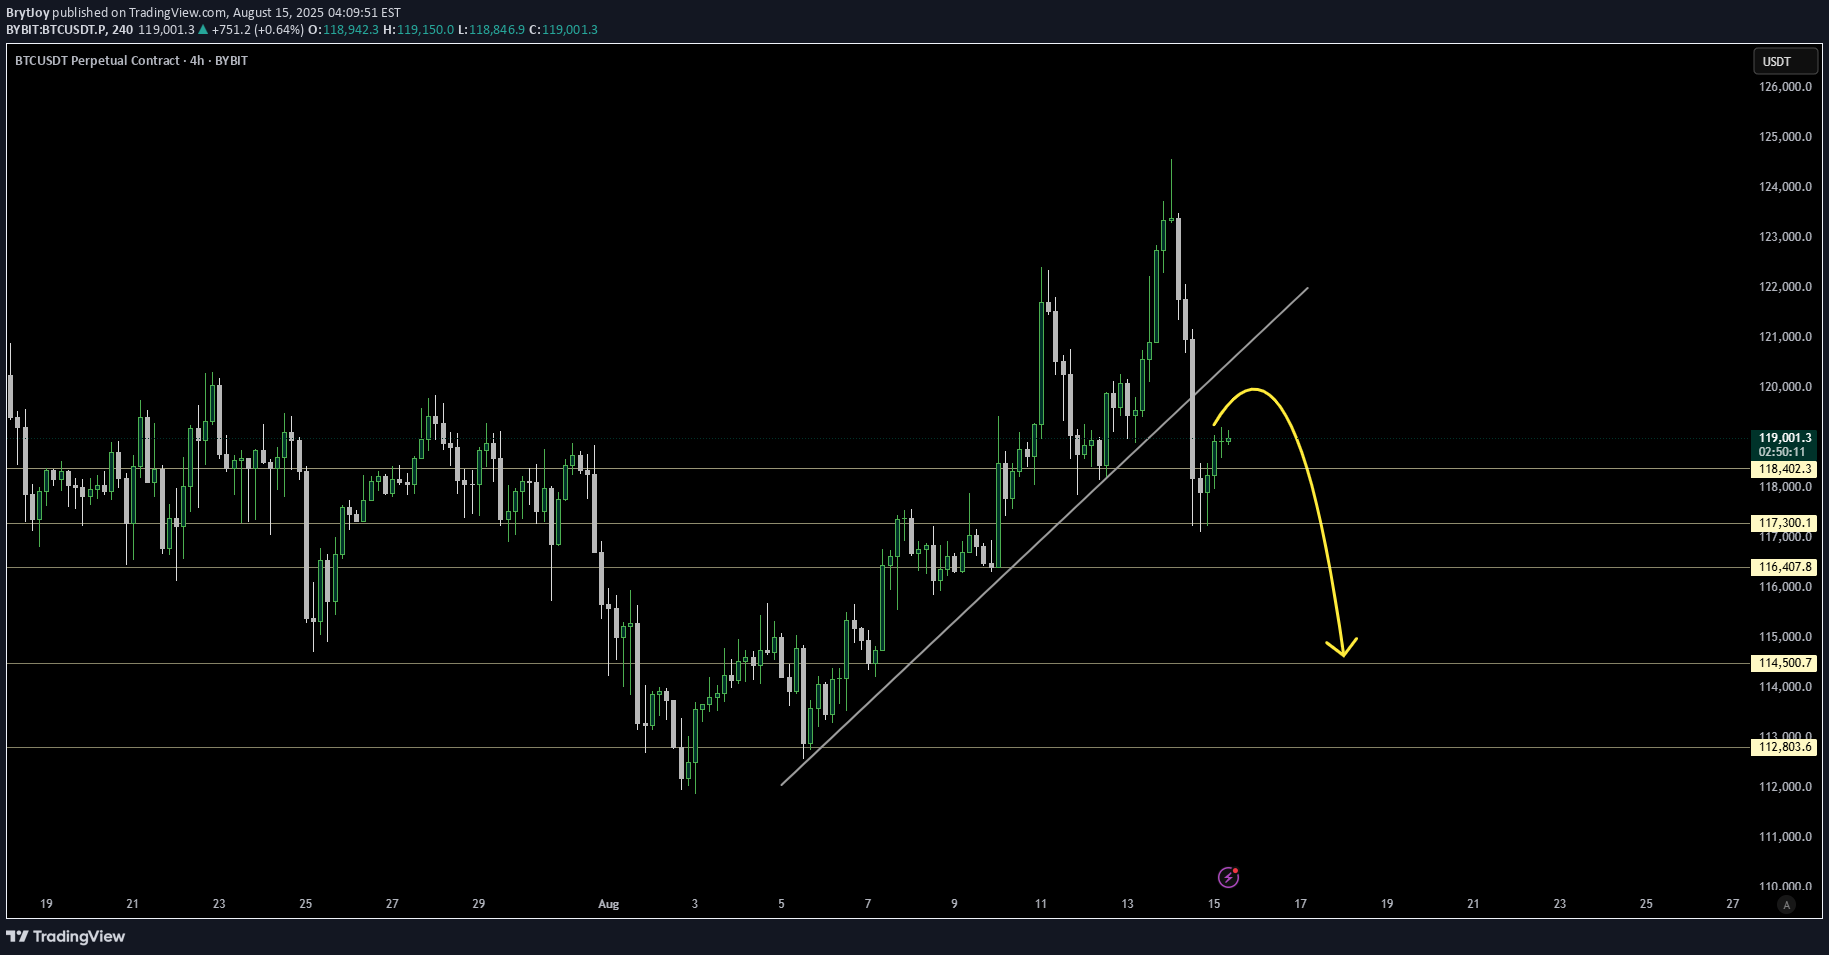
BTC has broken below its ascending trendline from early August, signaling a shift in momentum. Price is now bouncing toward the $119.8K–$120K zone, which aligns with both the broken trendline and prior support a strong potential resistance. Key Levels: Resistance: $119800 –$120500 Targets: $117300K → $116400 → $114500 Deeper Target: $112800 if $114500 breaks The breakdown came with strong sell volume, while the current bounce is weaker, favoring the bearish scenario: rejection at resistance followed by continuation toward $114500. A 4H close above $121500 with strong volume would invalidate this bearish view. Bias: Bearish until $121500 reclaimed.Target 1 hitTarget 2 (116400) hitPrice reached 114500 and held112900 hit
BrytJoy
Ethereum (ETH) Weekly Outlook: Momentum Builds After Range Break

Ethereum’s weekly chart continues to follow a well-defined trading range, oscillating between its historical range lows and highs. Recently, ETH closed decisively above the $2,200 level, marking a key structural break and reinforcing bullish sentiment. This move has already led to the first upside target at $2,484 being successfully hit. Historically, Ethereum has shown a cyclical range-bound pattern — bouncing from the range low and encountering resistance at the top. With the lower boundary now acting as support and the first resistance target cleared, ETH may be entering a momentum phase with eyes on higher resistance levels. The next major targets to watch are $2,910, $3,254, and $3,743, with $4,200 remaining the critical breakout level. A close above this zone could trigger a strong bullish continuation, potentially entering a new price discovery phase. However, failure to push past these upper resistance levels could see Ethereum revert to its range-based behavior. The recent price structure, combined with strengthening weekly closes, provides confidence for bulls — but confirmation at each stage remains vital. Traders should monitor volume surges, price reactions at resistance, and macroeconomic catalysts that could affect sentiment. As always, disciplined risk management is essential as Ethereum navigates these key technical zones. With a breakout above $2,200 confirmed and the first target reached, the market may be gearing up for its next move — and it's one worth watching closely.Target 1 hit (2910)Target 2 hit (3254)
BrytJoy
ALGO/USDT – Breakout Trade Setup (Daily Timeframe)

ALGOUSDT has officially broken out of a multi-month descending channel, signaling a shift in trend. After several failed attempts, price action finally pushed above both the channel resistance and the 50-day EMA (~$0.2197), confirming renewed bullish momentum. Following the breakout, ALGO completed a textbook retest of former resistance turned support around $0.2124. This zone now acts as a demand area and reinforces the bullish bias. The current price action near $0.2275 provides a favorable entry with a well-defined invalidation below $0.1908. 🎯 Trade Parameters Entry: $0.2250 - $0.2170 Stop Loss: $0.1908 Targets: • TP1 – $0.2621 • TP2 – $0.3000 • TP3 – $0.3320 Risk/Reward: ~3:1 Potential Upside: +54.85% 📌 Why This Setup? ✅ Breakout + Retest: Clean structure, respecting trendlines and horizontal zones. ✅ Above EMA: Price now trading above 100EMA, flipping it into dynamic support. ✅ Volume Support: Increased volume during breakout validates buyer strength. ✅ Clear invalidation: A move below $0.1908 invalidates the setup. Summary: With a favorable risk/reward and strong technical signals, ALGO/USDT offers a compelling swing trade opportunity. Maintain discipline on stop loss and trail profits as targets are approached.
BrytJoy
From Compression to Expansion: XLM Eyes 100% Move After Breakout

Stellar Lumens XLMUSDT has emerged from a prolonged consolidation within a descending wedge pattern, delivering a potentially bullish breakout on the daily chart. This technical development could mark a significant turning point. Technical Structure: The Descending Wedge The descending wedge is a bullish reversal pattern that forms when the price action creates lower highs and lower lows within two converging trendlines. Since late 2024, XLM has traded within such a structure, slowly compressing in volatility as the apex of the wedge approached. This formation reflects a decline in bearish momentum and hints at an eventual upward resolution, precisely what occurred in early May 2025. The breakout above the upper trendline of the wedge is a significant technical signal, suggesting a shift from distribution to accumulation. Breakouts from descending wedges often lead to sharp, directional moves as sidelined buyers regain confidence. EMA Confluence and Confirmation: Adding strength to this setup is the reclaim of the 100-day EMA, currently sitting around $0.2872. The EMA had acted as dynamic resistance during the wedge formation, with multiple failed breakout attempts earlier this year. The successful break and hold above this level now signal a potential trend reversal, reinforcing the bullish breakout. The price is currently consolidating above the 100 EMA, creating a new base of support. If this level holds, it could serve as a launchpad for further upside movement in the days and weeks ahead. Key Levels and Trade Context: Immediate resistance lies at $0.3772, which aligns with previous structure highs and horizontal supply zones. Beyond this, higher resistance targets are marked at $0.5008 and $0.6252—each corresponding to major levels from prior cycles. On the downside, the invalidation point sits clearly below the wedge and the EMA at $0.2014. This makes risk management straightforward for traders, with stops logically placed beneath this key level. The defined support zone gives the trade setup a favorable risk-to-reward profile, offering more than 2:1 reward relative to risk if targeting the first resistance alone. Pattern Implications and Measured Move: The measured move from a descending wedge is typically equal to the maximum height of the pattern, added to the breakout point. Based on this metric, a breakout from the $0.31 zone could yield a target close to or even above the $0.60 level, aligning with historical resistance. This makes the potential upside around 100% or more from current levels, highlighting the value of participating in such early trend reversals when confirmed by multiple technical factors. Educational Takeaway: This setup provides an excellent educational case study for traders seeking to improve their pattern recognition skills. The descending wedge is one of the more reliable reversal patterns, especially when paired with additional confirmation such as EMA reclaim, strong volume surges, or bullish candlestick structure at the breakout point. Understanding the importance of confirmation—rather than anticipation—can greatly improve trade outcomes. This chart also illustrates how structure, trend, and timing come together to create asymmetric opportunities in the crypto market. Conclusion: The breakout in XLM/USDT marks a decisive shift in market structure and momentum. The combination of descending wedge resolution, 100 EMA reclaim, and a clearly defined trade setup makes this chart technically attractive. Traders should monitor continuation patterns and volume closely to gauge the strength of the trend, while investors may consider this a signal that the longer-term bottom could be forming. As market sentiment across altcoins improves, XLM 's current technical posture positions it as a prime candidate for outsized gains. Whether you're actively trading or looking for longer-term entries, XLM deserves a spot on your watchlist in the weeks ahead.Target 1 and 2 hit for XLMUSDT75% currently profited
Disclaimer
Any content and materials included in Sahmeto's website and official communication channels are a compilation of personal opinions and analyses and are not binding. They do not constitute any recommendation for buying, selling, entering or exiting the stock market and cryptocurrency market. Also, all news and analyses included in the website and channels are merely republished information from official and unofficial domestic and foreign sources, and it is obvious that users of the said content are responsible for following up and ensuring the authenticity and accuracy of the materials. Therefore, while disclaiming responsibility, it is declared that the responsibility for any decision-making, action, and potential profit and loss in the capital market and cryptocurrency market lies with the trader.