
BrettFogle
@t_BrettFogle

What symbols does the trader recommend buying?
Purchase History
پیام های تریدر
Filter
BrettFogle
سقوط بیت کوین: اصلاح یا فرصت نهایی خرید؟ سطوح مهم پیشرو!
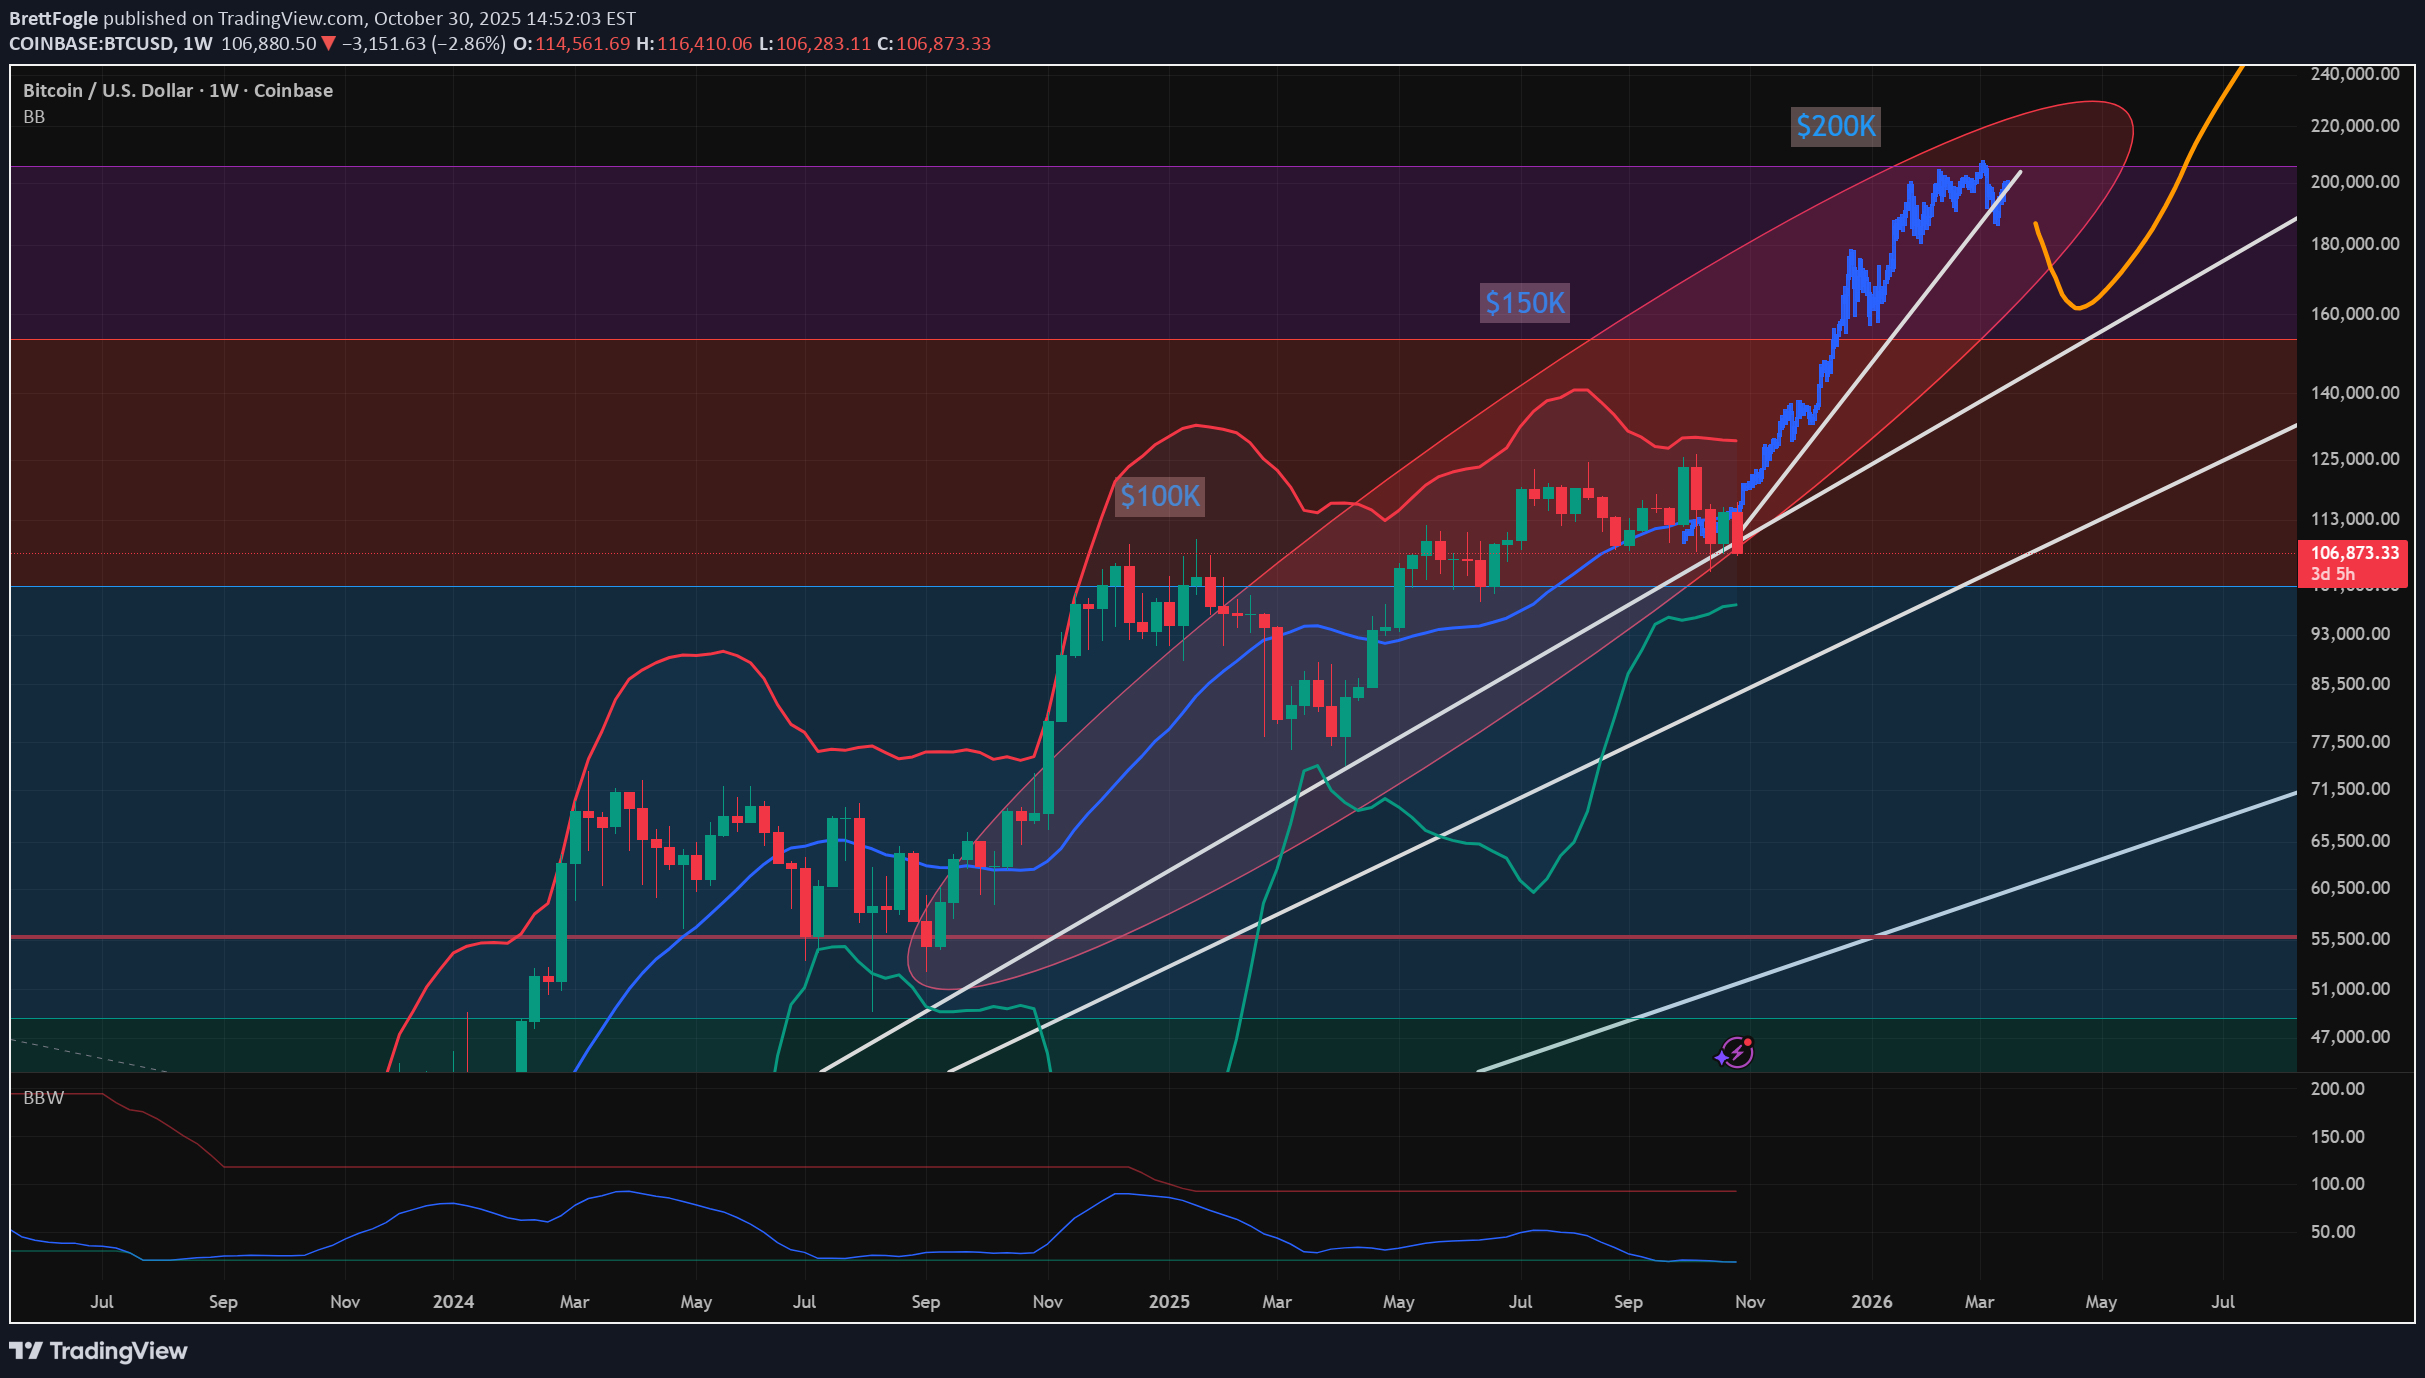
In this video, I examine the narrowing window of opportunity for us to still push up to $150k this year, and potentially $200k by Q1 2026. The weekly Bollinger Bands (Modified for Crypto @ 3STDev) show tightening which signals a likely bigger move is brewing. The question is, do we breakout to the upside... Or continue lower, to the $100k - $105k range where I'm seeing buyers and placing my buy orders. I've been in cash for weeks, waiting for the final shakeout which appears to be happening now. Let me know your thoughts below and what you think comes next! - Brett
BrettFogle
پیشبینی قله بازار و کف احتمالی رکود بعدی: کشف تصادفی چگونه ممکن شد؟
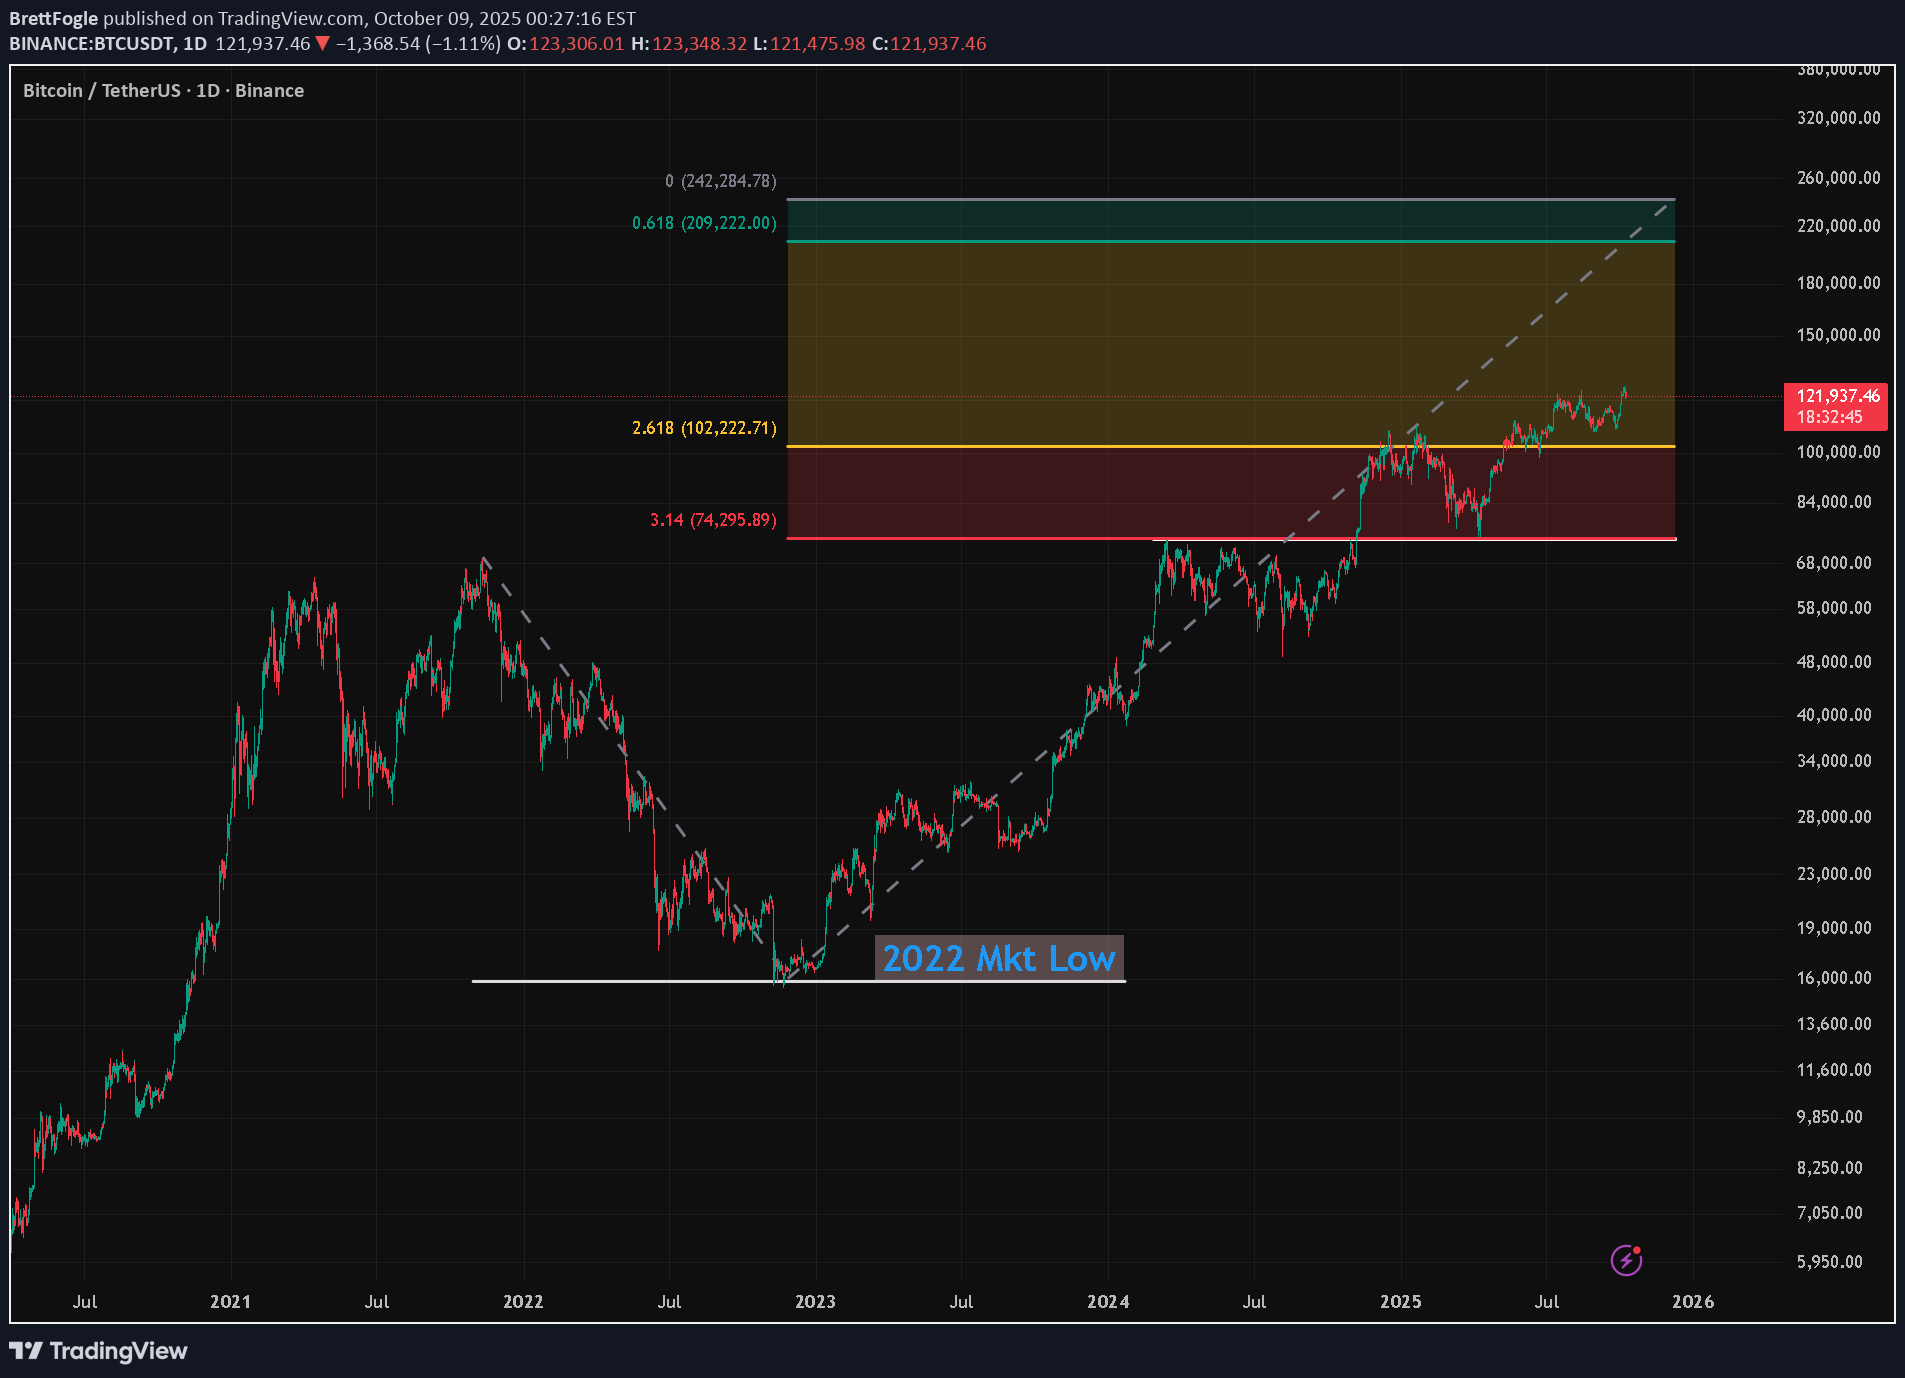
This is an interesting study I originally did 2 years ago. What started as a conversation with a student, who asked me if we could somenow 'project the next Bear market low'... It got me thinking, and experimenting. In this video I share the nearly 'accidental' discovery we made, and I think people might finding interesting (albeit pure speculation and most probably wrong). Any comments welcome. PS> Apologies for the rambling, it's been a long day.
BrettFogle
پیشبینی انفجاری بیت کوین تا سقف تاریخی جدید؛ آیا آلتکوینها از اصلاح بیت جا میمانند؟
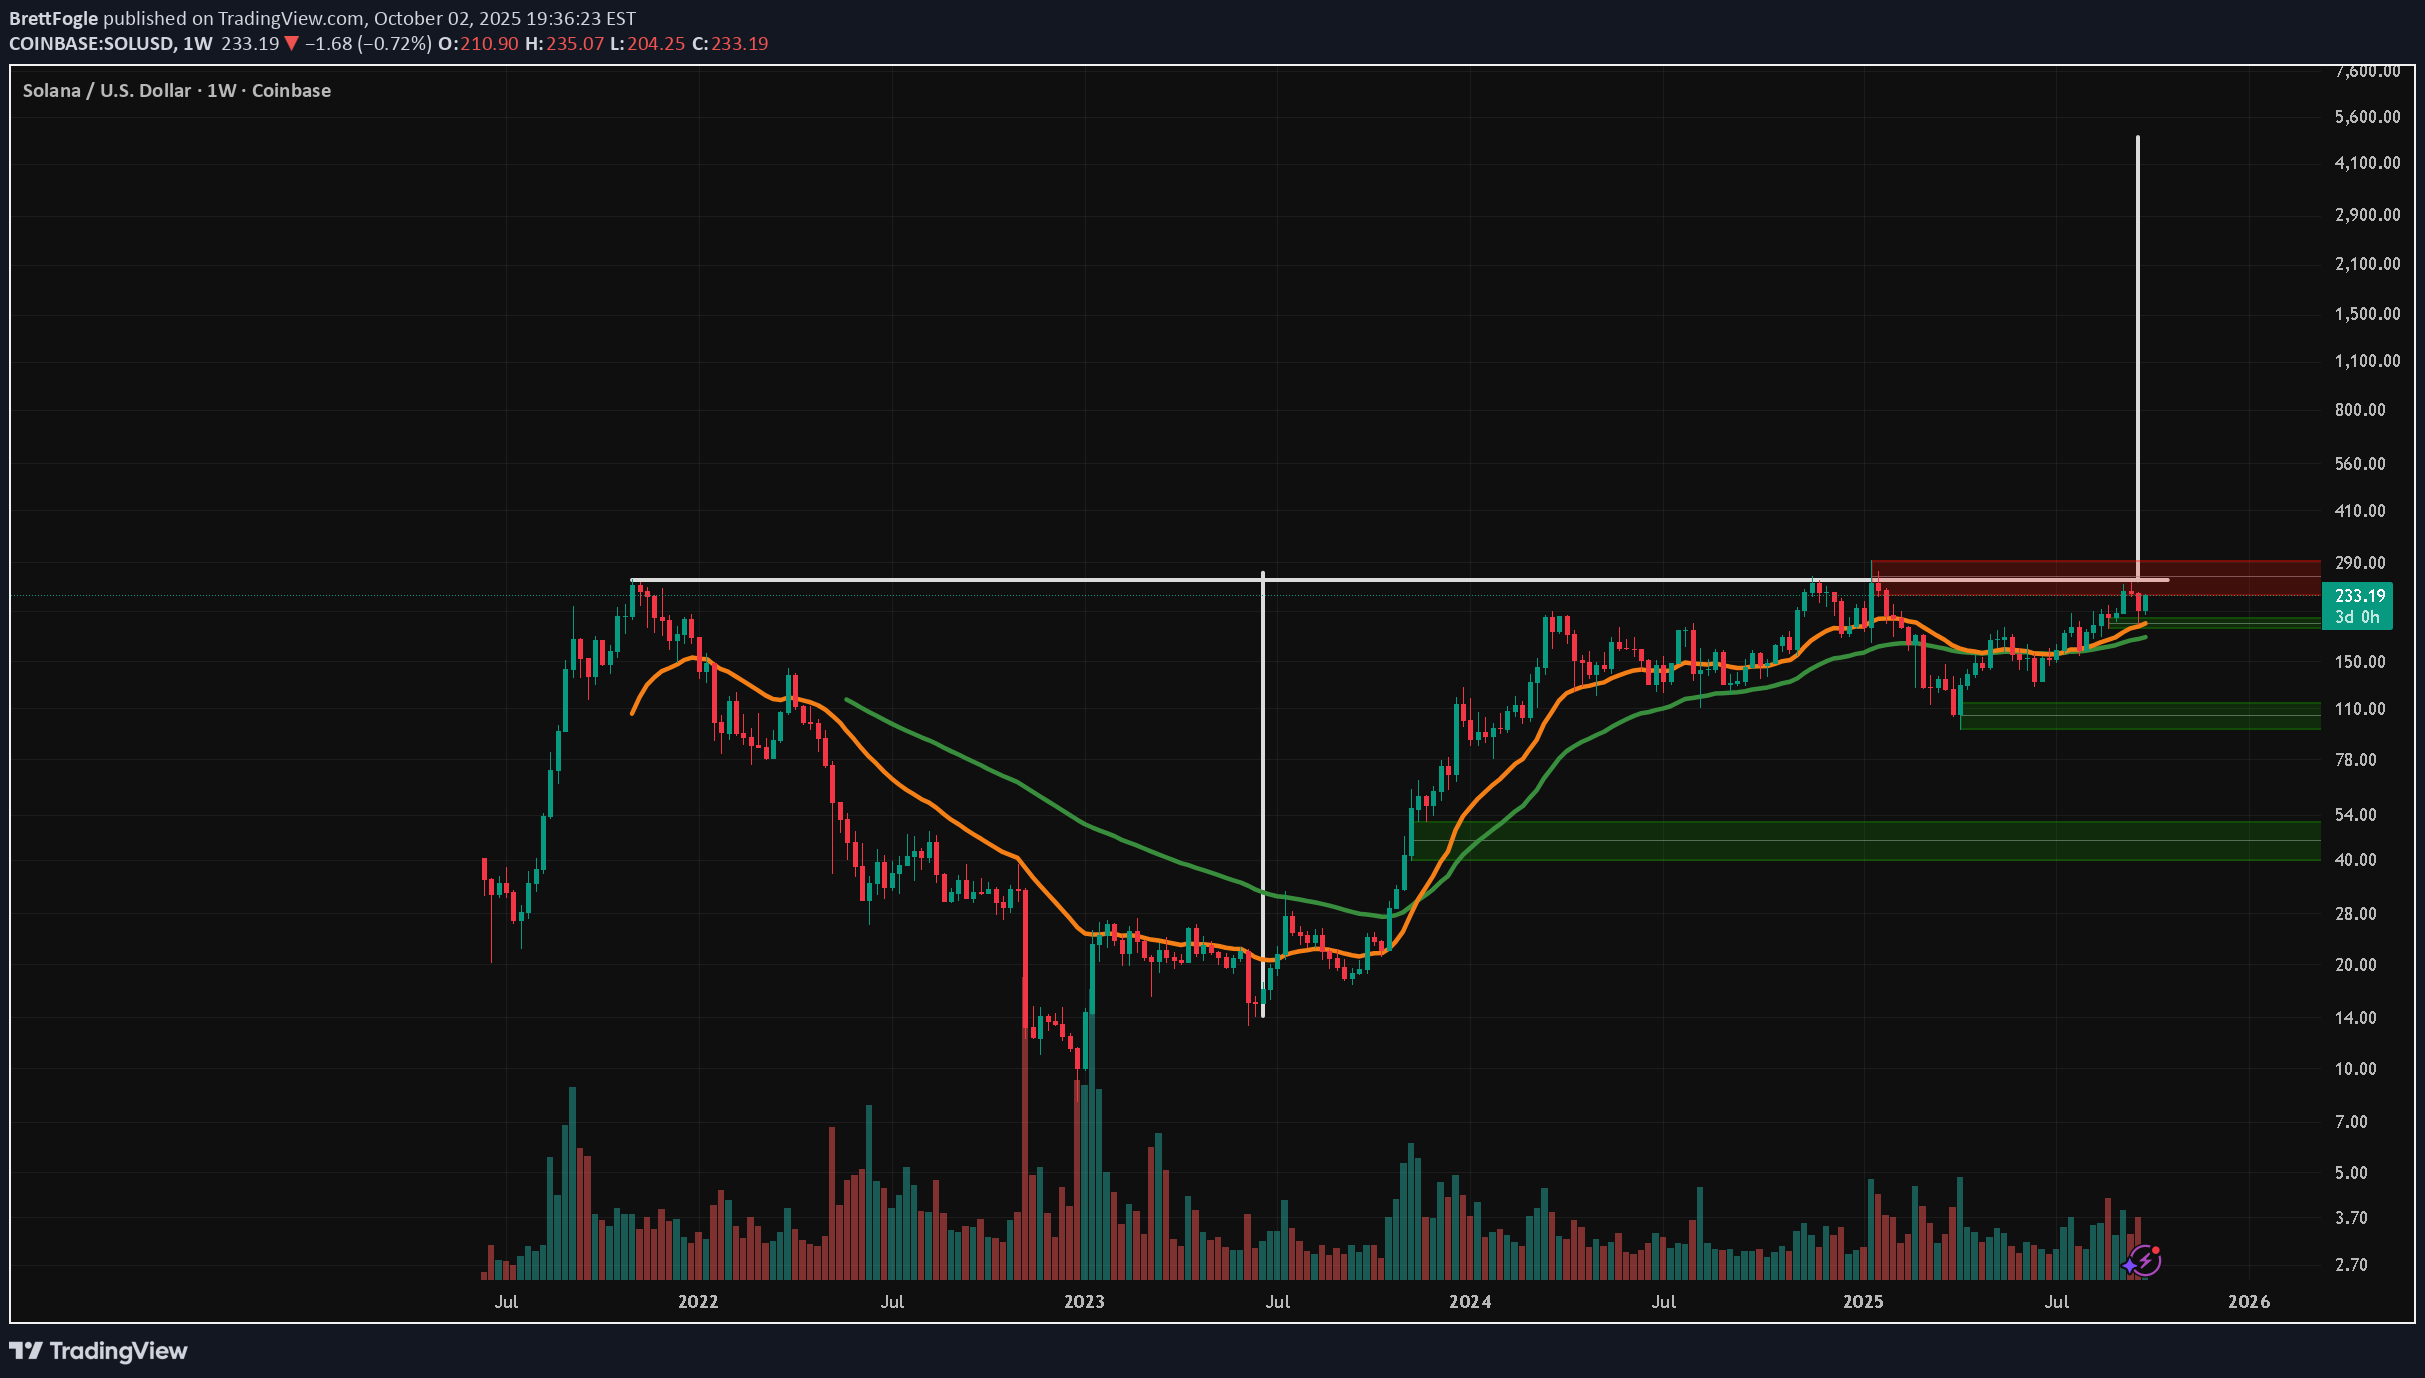
Here's the 'heat map' for Bitcoin, ETH and Solana's prices from here. Despite the big liquidation target zone and buy limit order concentration in the $106k zone in Green... Price pushed higher the last few days as 'Uptober' took hold and the US Government shut down, effectively silencing any negative economic news releases. Plus we can see that 2 more rate cuts are virtually guaranteed in October and December. So, very likely that Bitcoin rallies to new ATH later in October into November. However, I'm seeing sell block pressure just above on Bitcoin in the $121k - $124k range, and also on the TOTAL market cap. What's interesting is that I'm not seeing any sell block pressure on TOTAL2 or TOTAL3, indicating that Alts are more likely to push higher from here, as BTC retraces. What do you think?
BrettFogle
BrettFogle
Global M2 and Bitcoin Fib Bounce Targets Point to $134K Next
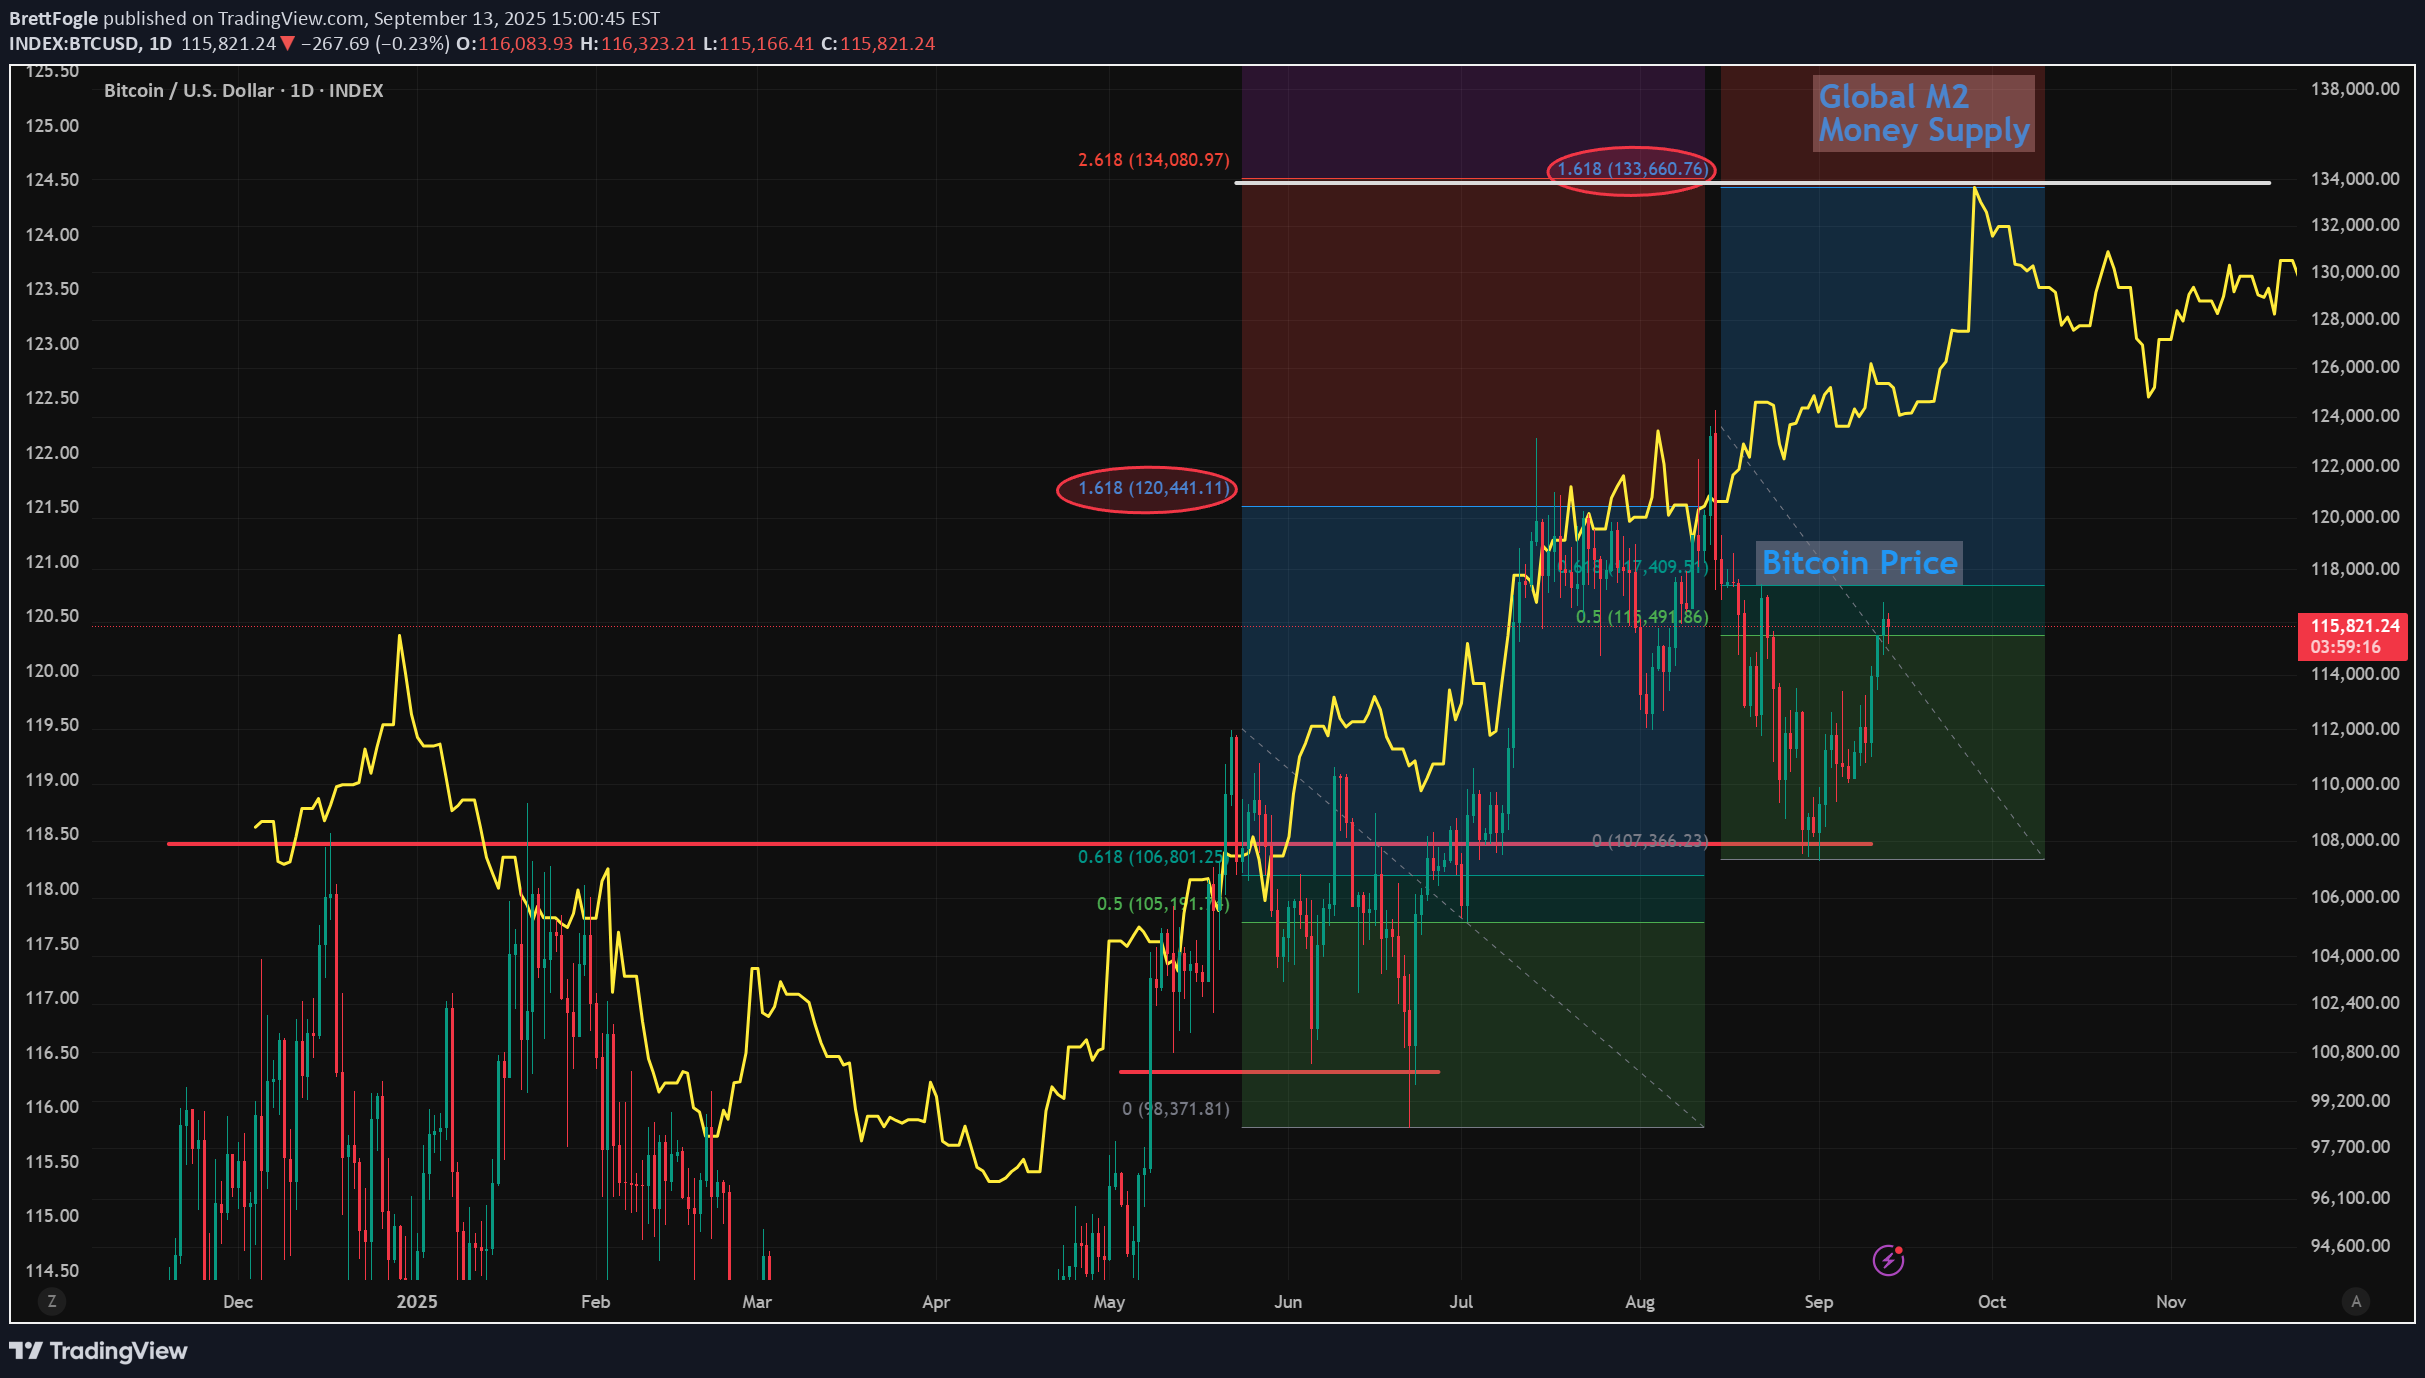
Global M2 has been leading Bitcoin which has been diverging, mostly due to an economic slowdown and waiting for interest rates to start dropping as a catalyst. Since we're pricing in and high probability of 3 rate cuts starting in September, I expect Bitcoin to start pushing higher and several studies point toward $134k - $135k from here. These Fibs studies aren't exactly correct, b/c I drew the high / low using the wiicks vs the real bocy, but still interesting. The first Fib swing high/low correction forecast the pump to the 1.618 target. So using the most recent high/low swing, points toward around $134k on the 1.618 which is coincidentally the 2.618 extension from the first Fibonacci. My bull-flag targets on Bitcoin also point to a measured move of $134k-$135k as the next likely profit target, before another pullback and ultimately on the way to $150k this year I think. Let me know your thoughts below. - Brett
BrettFogle
Bitcoin All Time Highs Forecasted Date
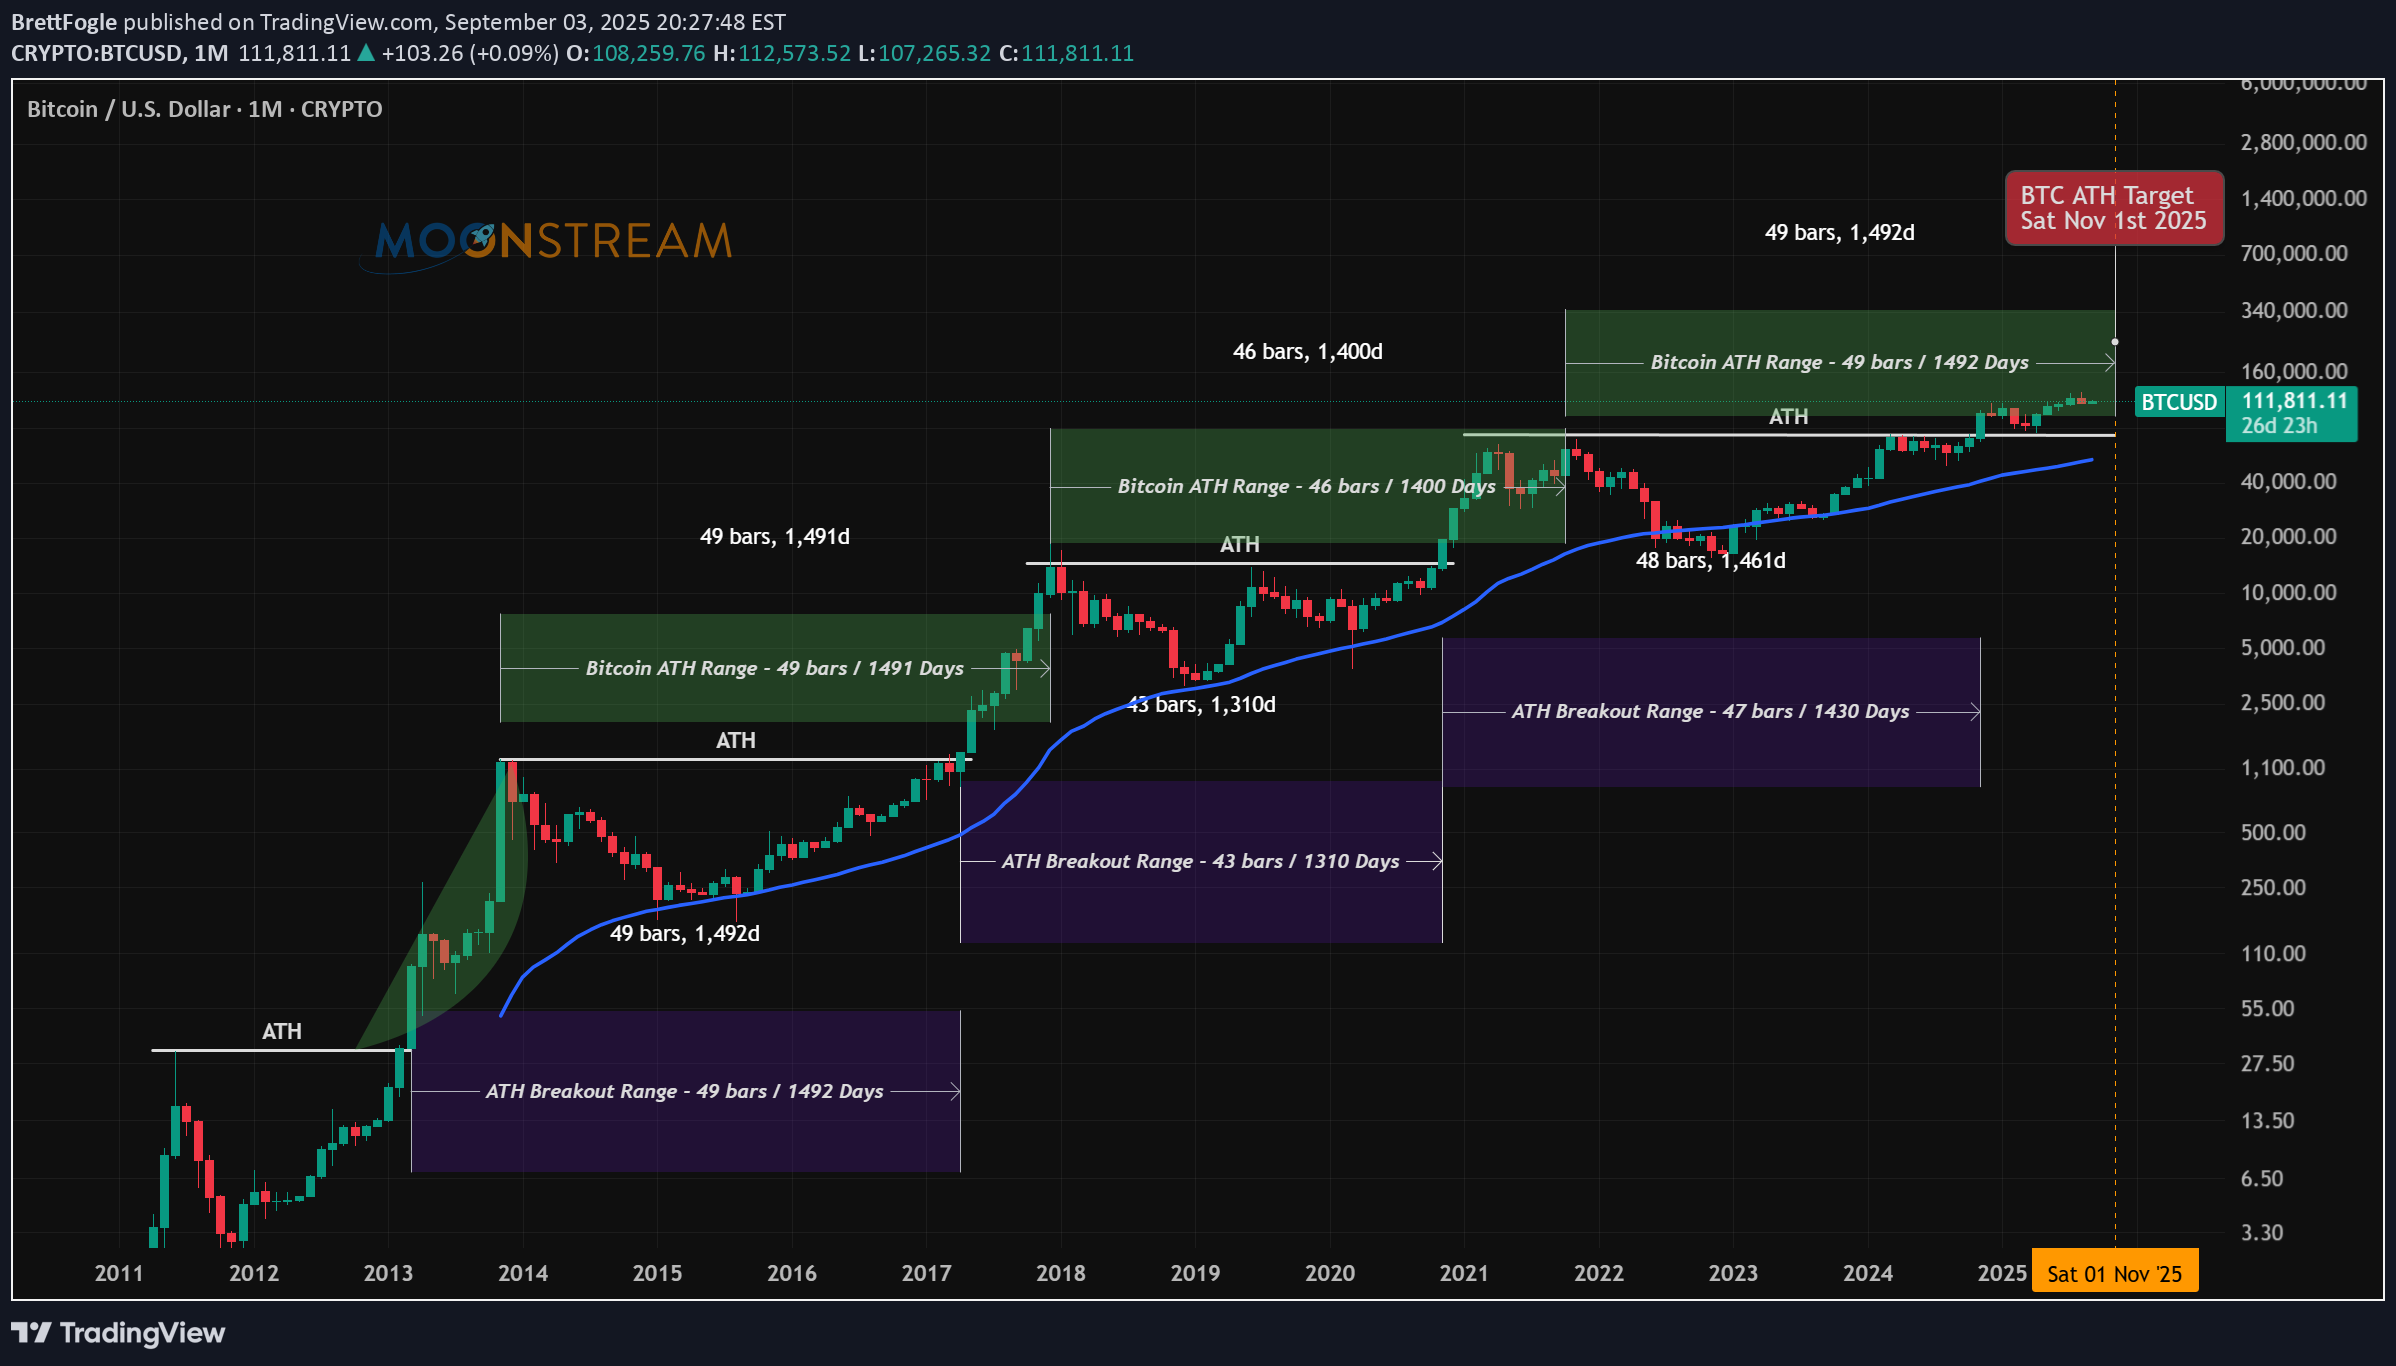
Was just working on a new study showing the number of months and days between prior ATH's for Bitcoin has typically been between 46-49 months or 1400 to 1492 days as shown in the Green boxes. Based on the 2017 cycle, that puts this cycle ATH around November 1st 2025. So we don't have much time if this cycle is going to play out like prior ones. Also global liquidity is slowing down, and BTC is deviating from following M2 Money Supply. However, the daily cycle low is signaling a local bottom is in here. What do you think?
BrettFogle
PENDLE Buy Prices For a DCA Strategy & Fib Take Profit Targets

PENDLE is a great coin for this Bull run, which I think can easily push up to $10 - $20. In this video, I cover where I'm placing limit buy orders below to dollar cost average in and build a bigger position, while lowering my overall cost. Then we'll look at a few reasons why, showing that PENDLE is oversold and likely to push higher here, and into AltSeason. I'm also sharing my 4 Take Profit Targets of $7 (Previous ATH), and the Fib Targets of $10 (F1.618), $15 (F2.618) and $20 (F3.618) as well as hold a Moonbag in case Pendle Moons! We're up 70% on PENDLE already since recommending it in July and expect higher targets in the coming weeks and months, into the Bull Peak. What are your thoughts and comments? - Brett
BrettFogle
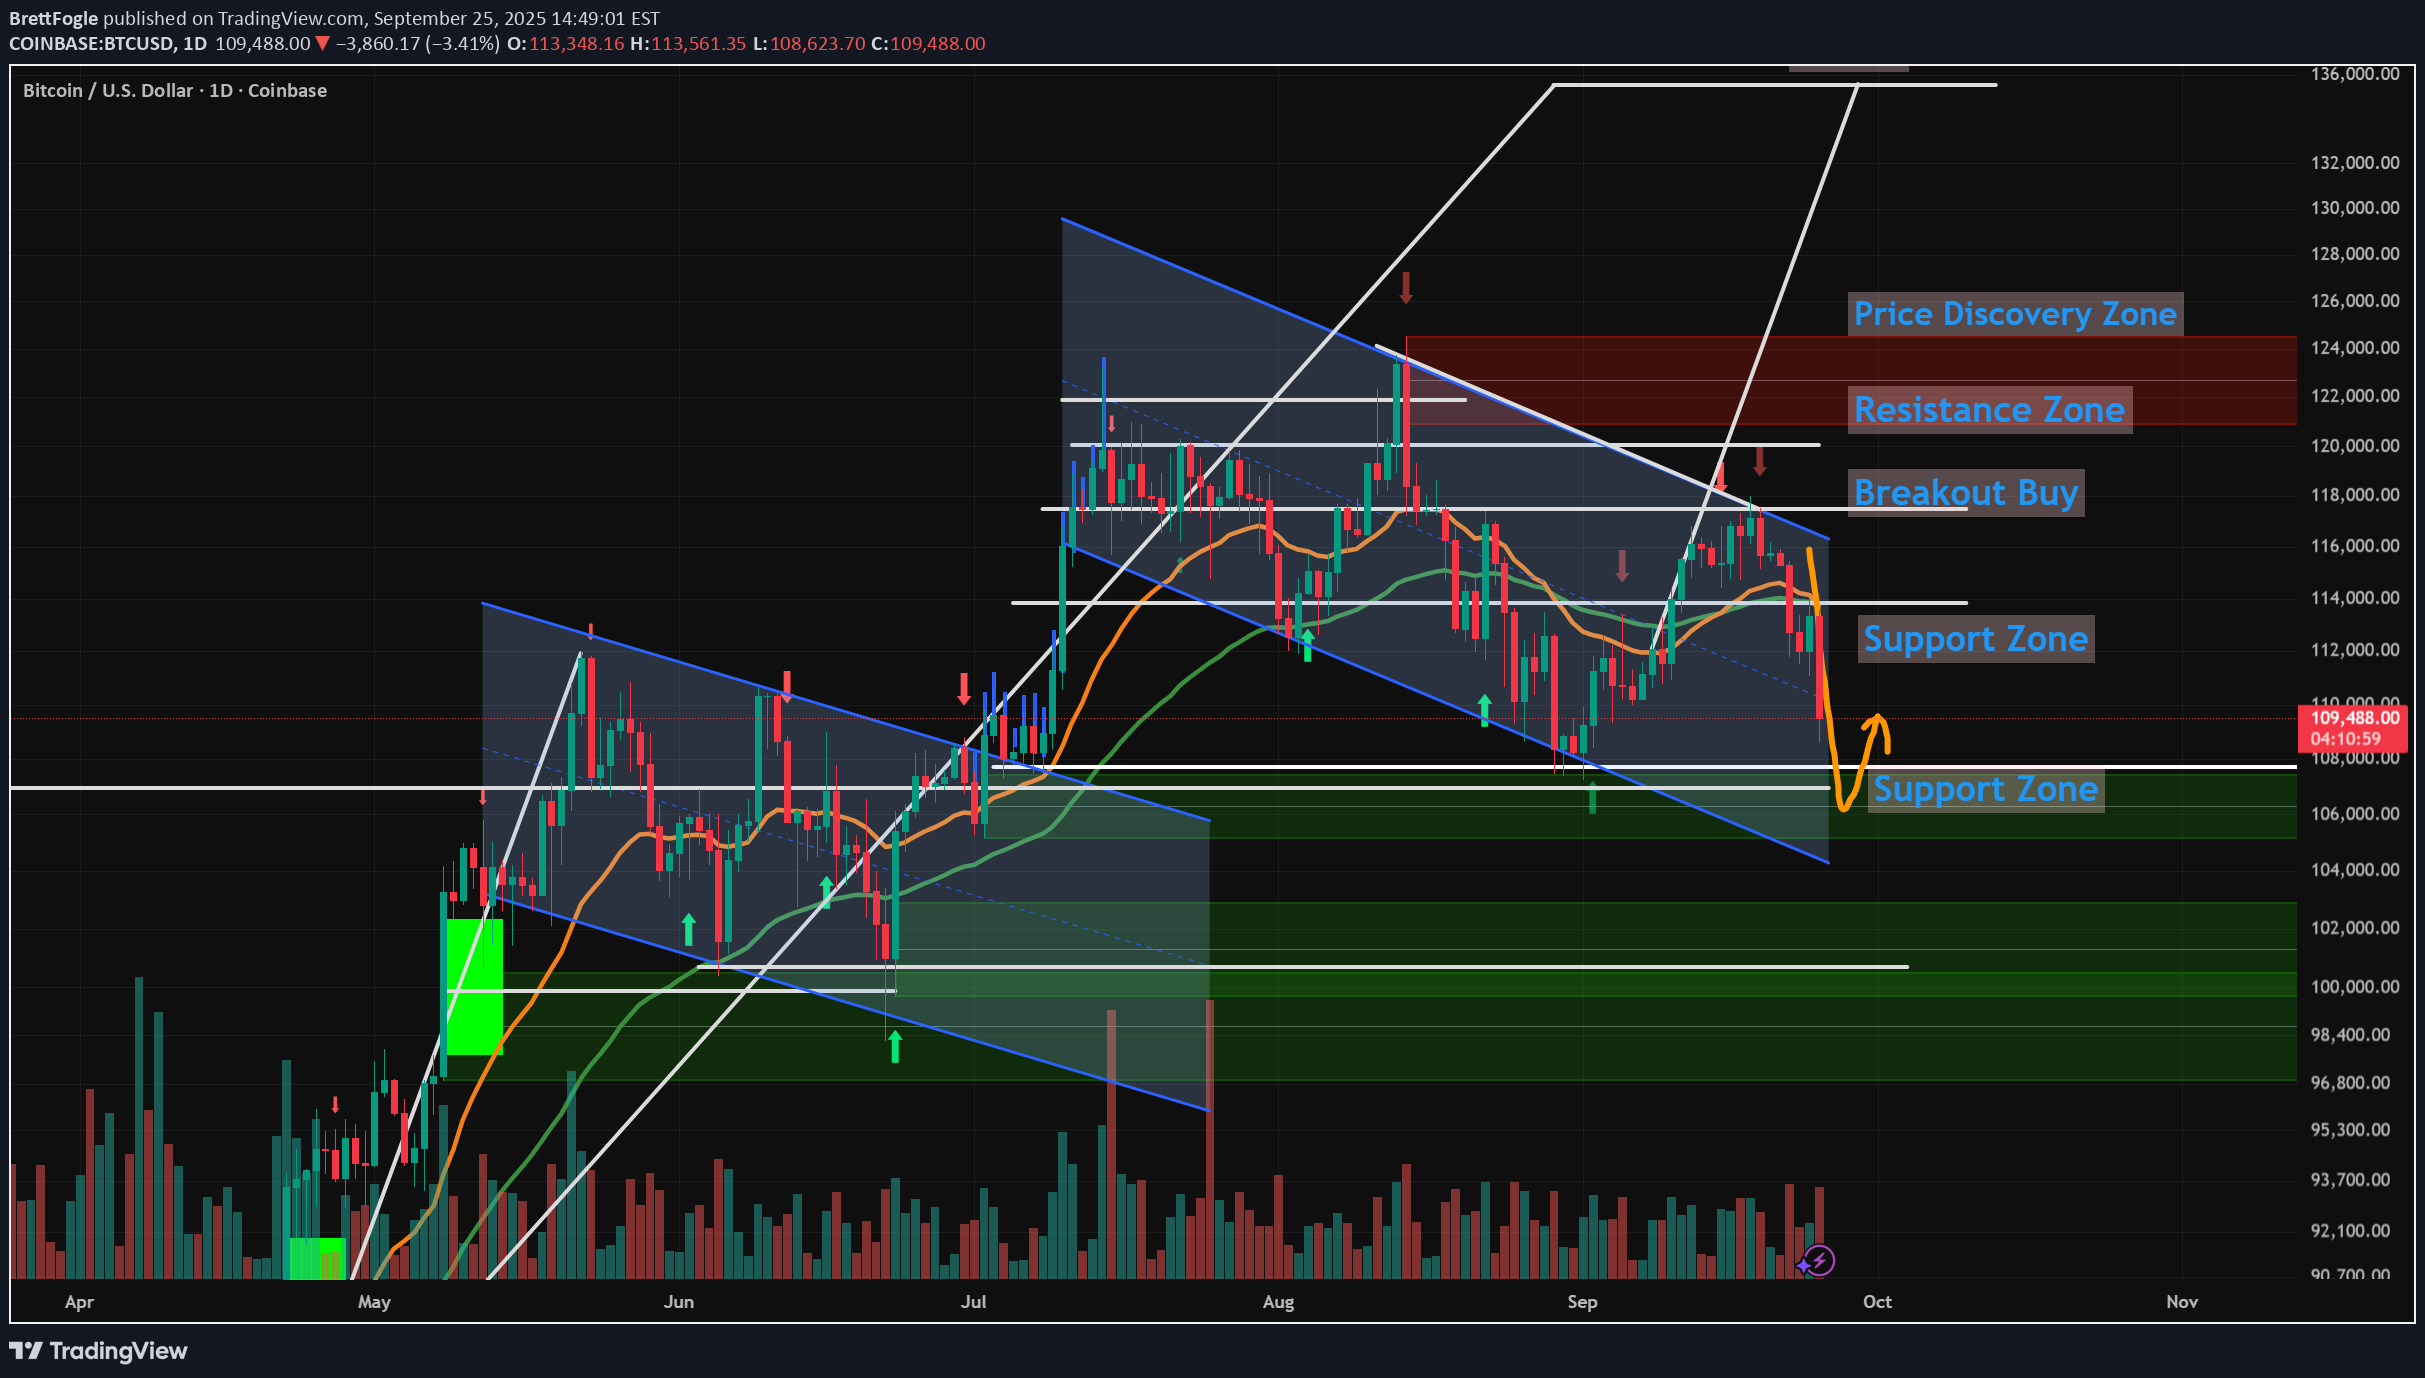
Bitcoin and Broad Market Breakout (BTC, ETH, SOL, PENDLE)
In this video we take a look at why the market rallied Thursday. - 93% of FOMC September Rate cut and 3 possible cuts in 2025 - UK just dropped rates to 4% - President Trump approved letting 401k's invest in crypto - Trump removed resitrictions by banks to 'de-bank' crypto investors The charts looks very bullish here and I revisit the potential path to $150 BTC this year. Also ETH, Solana charts and 'The Rocket' As well as the 25% move on Pendle which I had recommended as a 'Buy' the day before. Let me know what you think... The BULL is Back.
BrettFogle
Revsiting $150k - $200k Bitcoin (AND Next Bear Market Bottom)
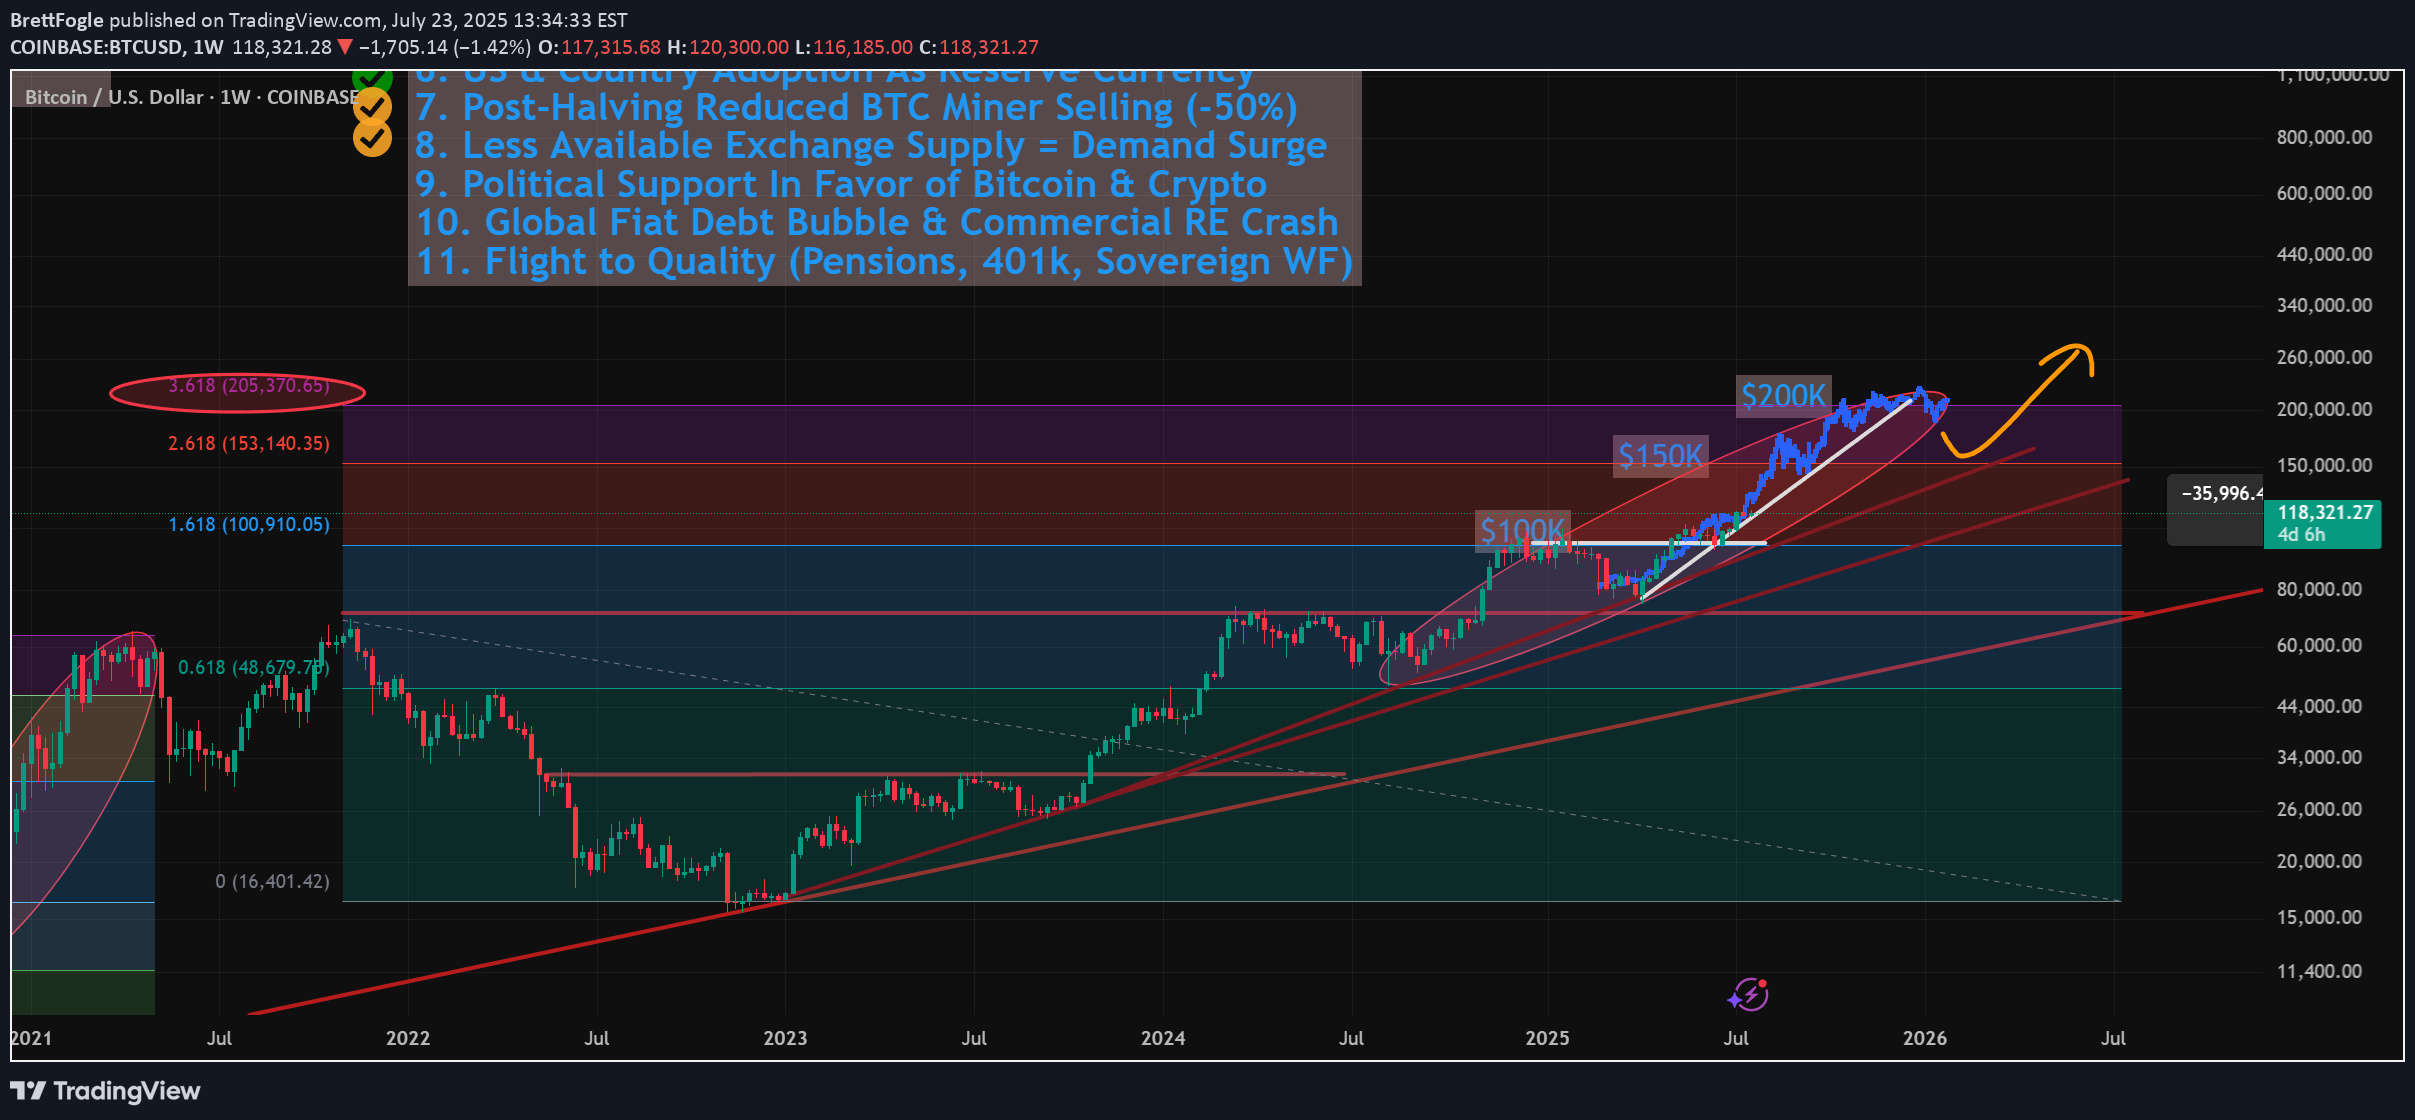
In this video I revisit my 2-year old study showing the potential path for Bitcoin to $150k to $200k and not only how we might get there, but the 11 reasons WHY we can this cycle. This is the same Fibonacci series that predicted the 2021 cycle high at the 3.618 (Log chart) and used the same way this cycle, with some interesting 2025 forecasts of: 1.618 - $100k 2.618 - $150k 3.618 - $200k There are quite a few confluences that we get to $150k like the measured moves from both the recent mini bull flag, but also the larger one from earlier this year. ** Also I touch on revisiting my study from 2 years ago where I may have discovered the retracemebnt multiple that correctlty predicted and held the 2022 lowes around $16k. ** It's a VERY interesting number you all will recognize (buy may not agree with). Let me know what you think.
BrettFogle
$MOG Setting Up For Cup & Handle Breakout - 10x - 100x Targets
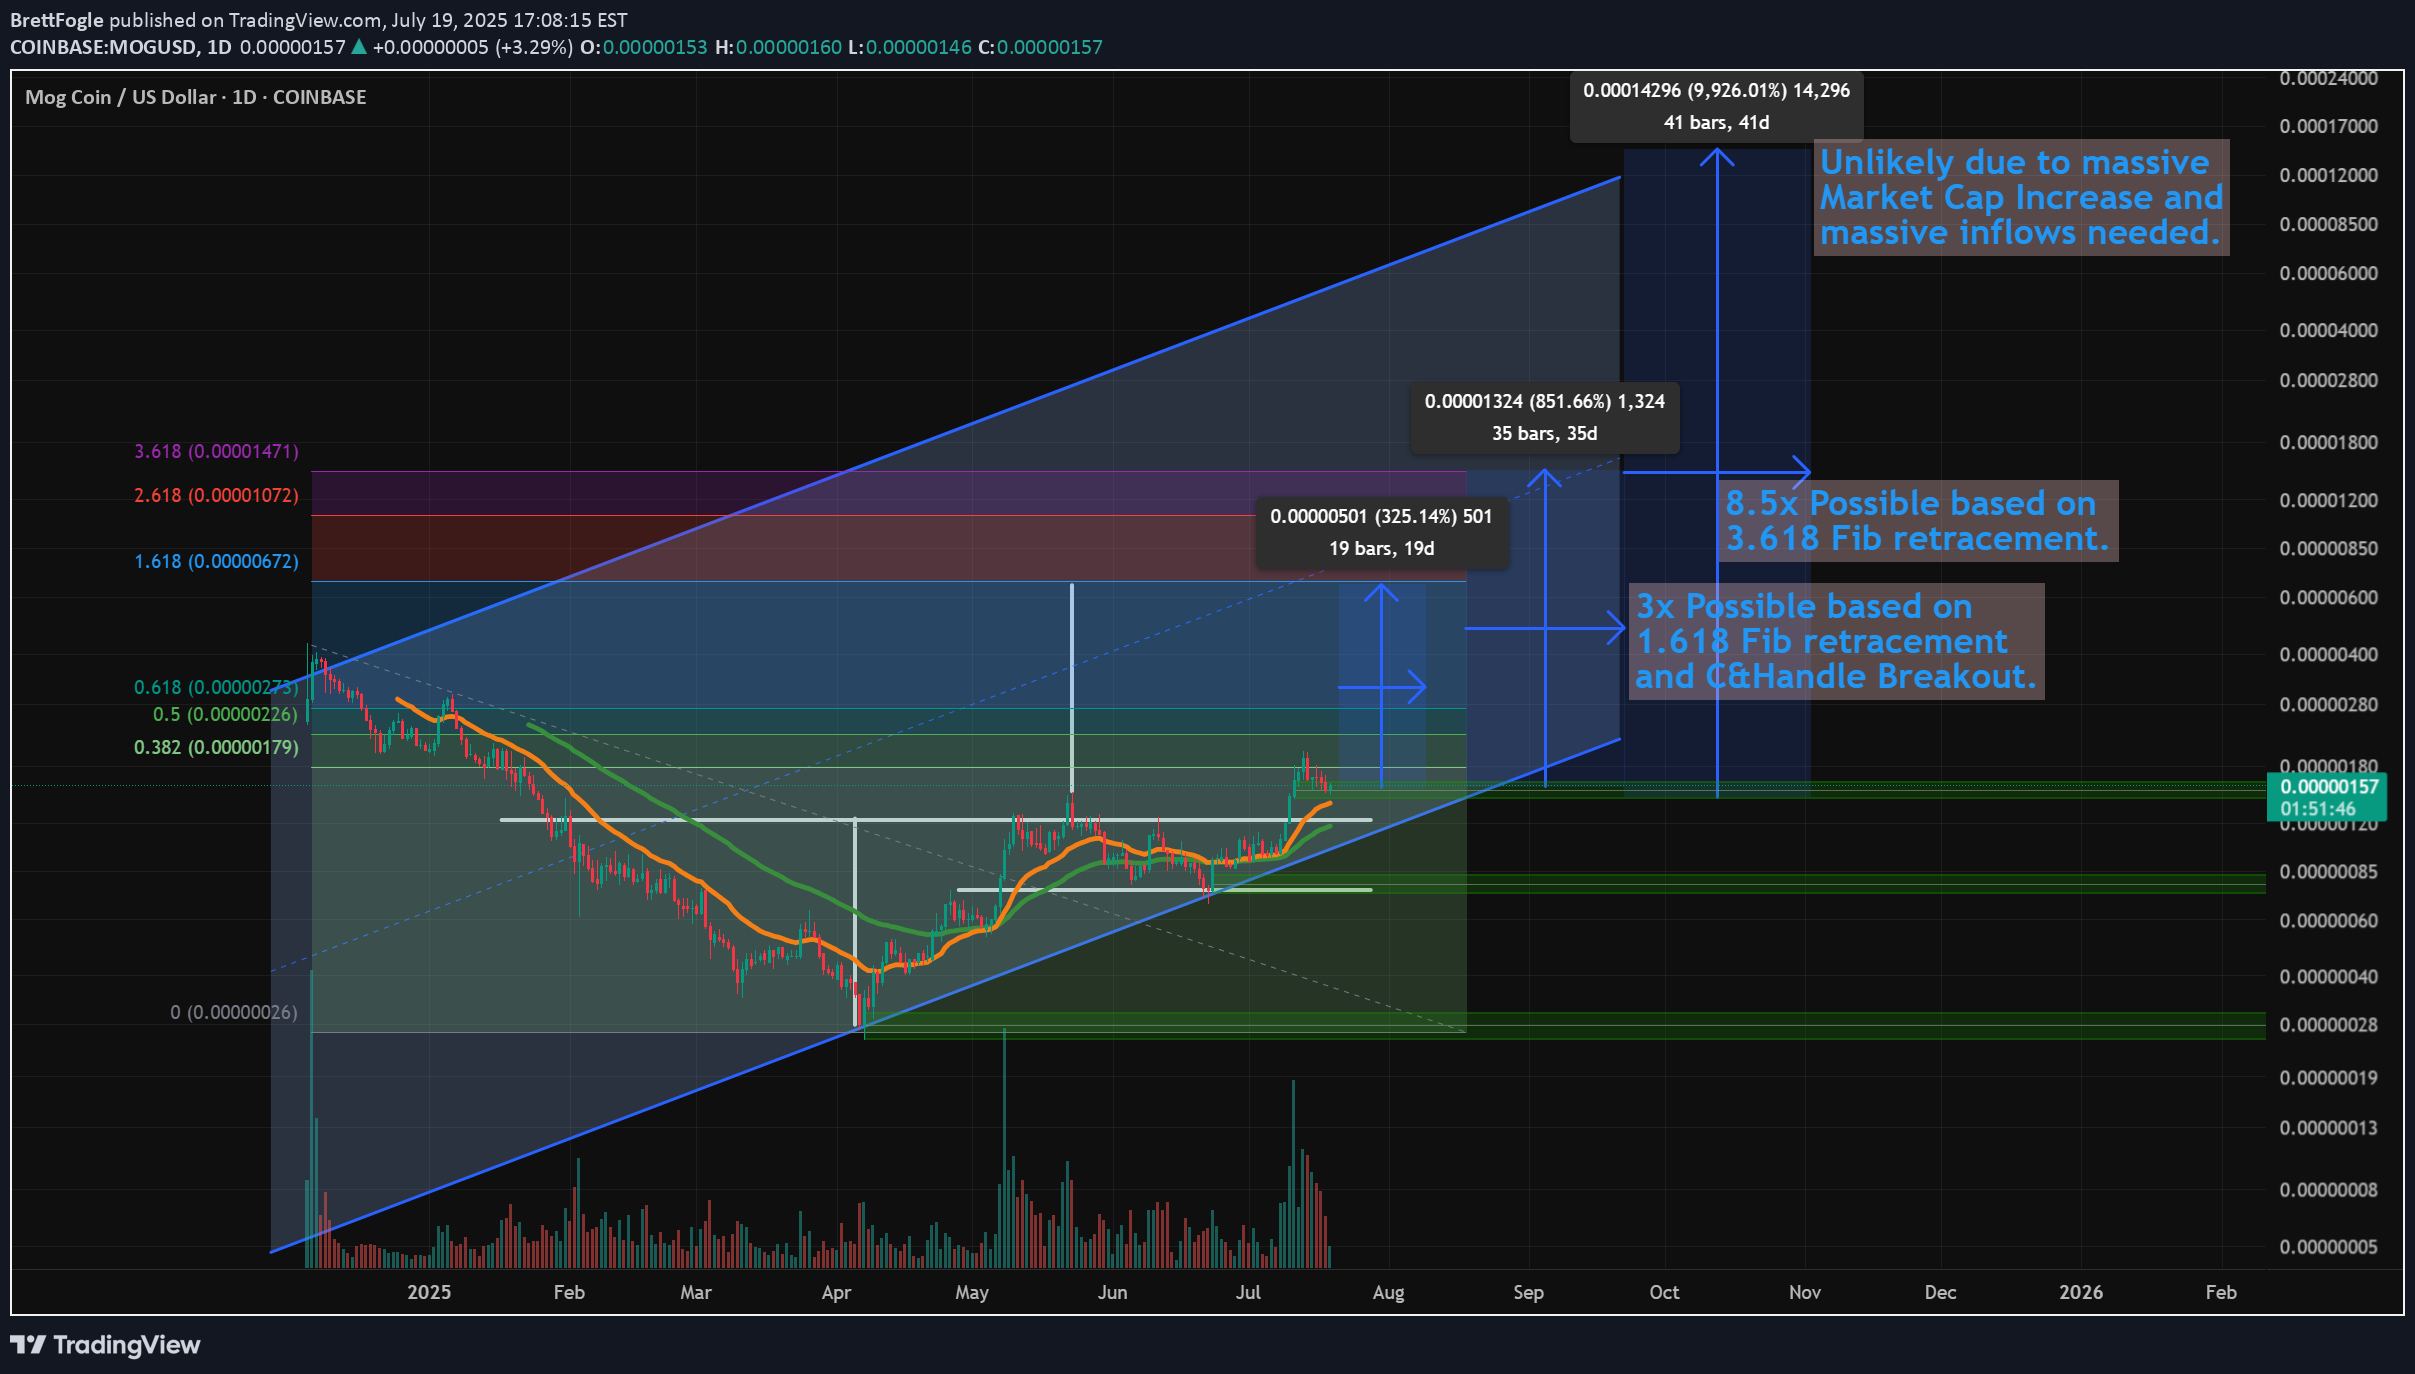
As I stated in the video, I don't normally cover Meme coins, but this is a great looking chart for MOG and thought I'd do a quick study on this with some potential price targets... And how I'm using AI to get a better handle on the likelihood of my TA targets. In short -- 10X here is possible this bull run (8.5x more likely based on the Fib) But 100X is very unlikely, even though the top of the parallel trend channel shows it's potential. No surprise there, but watch how using AI can give clarity on this and these decisions. Let me know what you think...
Disclaimer
Any content and materials included in Sahmeto's website and official communication channels are a compilation of personal opinions and analyses and are not binding. They do not constitute any recommendation for buying, selling, entering or exiting the stock market and cryptocurrency market. Also, all news and analyses included in the website and channels are merely republished information from official and unofficial domestic and foreign sources, and it is obvious that users of the said content are responsible for following up and ensuring the authenticity and accuracy of the materials. Therefore, while disclaiming responsibility, it is declared that the responsibility for any decision-making, action, and potential profit and loss in the capital market and cryptocurrency market lies with the trader.