
BobbyAxelrode
@t_BobbyAxelrode

What symbols does the trader recommend buying?
Purchase History
پیام های تریدر
Filter
BobbyAxelrode
Ethereum Weekly Chart Analysis

Ethereum Weekly Chart Analysis Key Observations: Price Action and Fibonacci Extensions: Ethereum's price is consolidating near the 0.618 Fibonacci retracement level (~$3,445), with a bullish structure forming. Upside targets include: 1.618 extension (~$4,502): Short-term target for continuation. 2.618 extension (~$5,433): A mid-term target aligned with prior resistance zones. 3.618 extension (~$6,328) and 4.618 extension (~$7,210): Long-term targets for a sustained breakout. Trend Indicators: Moving Averages: Price is trading above the 50-week EMA (blue) and 200-week EMA (purple), signaling long-term bullish momentum. The 20-week EMA (orange) is holding as dynamic support, further confirming bullish sentiment. Recent crossover between shorter-term and longer-term moving averages suggests momentum is strengthening. Volume: Declining volume during the consolidation phase implies sellers are exhausted. A breakout above $3,445 with increased volume could confirm the next bullish leg. Support and Resistance Levels: Support Zones: $3,155 (20-week EMA). $2,747–$2,475: Strong historical support aligned with the 200-week EMA. Resistance Levels: $4,116: Local resistance near prior highs. $4,820–$5,433: Key zones for bullish continuation. Divergences: RSI: Currently neutral (~51), showing room for upward movement without overbought conditions. ASO (Advanced Stochastic Oscillator): Shows bullish momentum with no clear reversal signal, supporting higher price potential. Cycle Analysis: Right Translated Weekly Cycle: Recent cycle highs have occurred after the midpoint, confirming a bullish bias. A Weekly Cycle Low (WCL) may have recently formed, acting as a base for further upside. If Ethereum follows this Right Translated pattern, the next move is likely a higher high. Trade Outlook: Bullish Scenario: A breakout above $3,445 could push Ethereum toward $4,500 and beyond. Ideal entries are near $3,155–$3,445, with stops below the 200-week EMA (~$2,475). Bearish Scenario: A breakdown below $3,155 may lead to retests of support near $2,747–$2,475. Invalidation of the bullish structure would occur below the 200-week EMA. Summary for the Post: Ethereum remains in a bullish structure with strong support from major moving averages and cycle patterns. Upside targets include $4,500, $5,433, and potentially $6,328 if momentum continues. Watch for a breakout above $3,445 with volume to confirm bullish continuation, but manage risks with stops below $3,155 or $2,475.
BobbyAxelrode
ETH/USD Long-Term Outlook: Head & Shoulders Pattern Forming?

In this analysis, Ethereum (ETH/USD) is showing a classic Inverse Head & Shoulders pattern on the weekly timeframe, a potential bullish reversal structure that could propel prices higher in the mid to long term. Key Highlights: Support Levels: Significant confluence of support near $2,475-$3,075, aligning with the neckline and major Fibonacci retracement levels (1.618 and 2.618 zones). This range could serve as a key accumulation zone. Resistance Levels: Breakout targets extend towards $4,940 (3.618 Fib level) and $6,062 (4.618 Fib level), with an extended target near $7,184 (5.618 Fib). Trendlines: Long-term ascending trendline remains intact, signaling continued bullish structure since 2020. Moving Averages: The 50-week and 200-week moving averages are holding as dynamic support, with potential golden cross confirmation. Volume Profile: Strong volume at critical support areas, suggesting buyer interest. Indicators: RSI Divergence: Bullish RSI divergence near oversold levels points to potential momentum shift. ADX & DMI: Early signs of bullish crossover, with strengthening trend momentum. Kz RSI Div: Positive divergence and a breakout above 70 may confirm trend continuation. Bullish Scenario: A clean breakout above $3,800 (neckline) with increasing volume could validate the pattern and push ETH towards the upper Fibonacci targets. Bearish Risks: Failure to hold the neckline support and a breakdown below $2,475 would invalidate this setup, exposing ETH to deeper corrections. Let me know your thoughts on this outlook and whether you’d like me to refine it further!
BobbyAxelrode
Soylana dont care rsi divergence. They need sun.

When price breakout from this wedge Its going to be a classic qualmaggie breakout setup where : 1. Wedge consolidation 2. Getting tighter 3. Price surf above sma 10, 20, 50 4. Price has been moving >50% past 3 months This is classic setup happened in 2021 in tesla, ddog , zoom continuation PA. qullamaggie.com/my-3-timeless-setups-that-have-made-me-tens-of-millions/
BobbyAxelrode
Inj good breakout play soon

Allow the chart to consolidate Once price start breakout on range high, prepare your entry at that time.
BobbyAxelrode
Dydx , wihtin 6 months, it will be in my bag
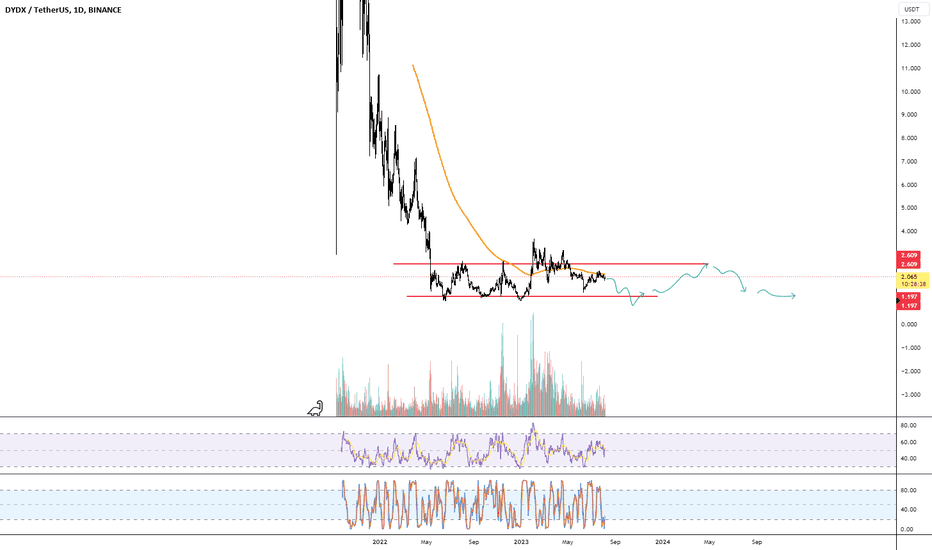
top 21 coin for my bag for trip to mars. we going to stuck within a range of accumulation. Thats when u buy.
BobbyAxelrode
BobbyAxelrode
IM AN OP BELIEBER , JUST 1 LAST DROP LOWER
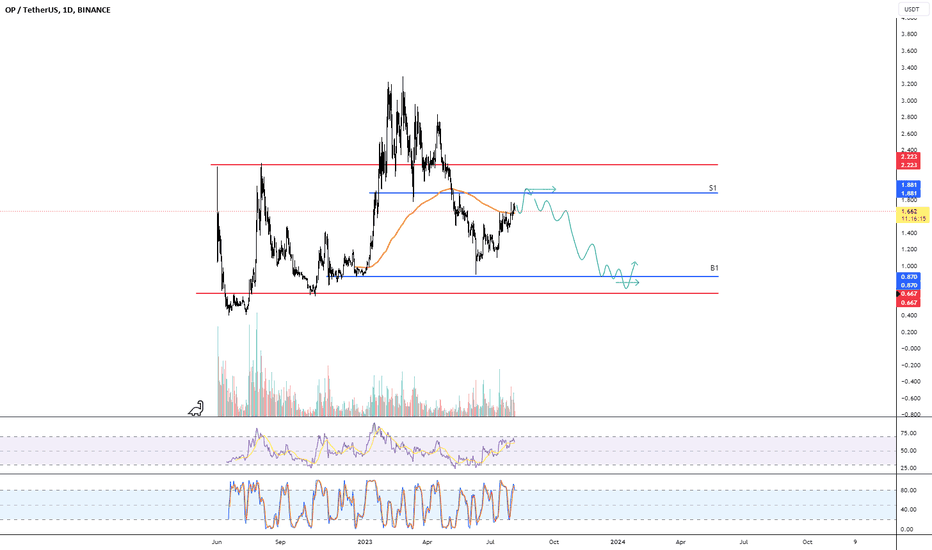
Im a buyer , lover of OP, new shiny things. 1. SELLER AT 1.9 2. BUYER AT 1 and lower. GOODLUCK , SEE YA NOVEMBER PUMP
BobbyAxelrode
Matic 3 Midas Short touch + Flag Human

Matic 3 Midas Short touch + Flag Human Bear Flag 3 Touch flag expansion equal to past expansion
BobbyAxelrode
Range high , thats all noting much, short here

Range high , thats all noting much, short here if wick , bigger stop loss, thats all. dont complicate no need to over trade shit.
BobbyAxelrode
Eth is it a deviation or a trap sir? its an actionable zone

Eth is it a deviation or a trap sir? its an actionable zone right now price in the lower zone but its look like a deviation but still tight confirmation for stop loss just in case price confirm its a deviation But if its a trap, its confirmation then we are making new range lower sir. again tight stop loss. sir
Disclaimer
Any content and materials included in Sahmeto's website and official communication channels are a compilation of personal opinions and analyses and are not binding. They do not constitute any recommendation for buying, selling, entering or exiting the stock market and cryptocurrency market. Also, all news and analyses included in the website and channels are merely republished information from official and unofficial domestic and foreign sources, and it is obvious that users of the said content are responsible for following up and ensuring the authenticity and accuracy of the materials. Therefore, while disclaiming responsibility, it is declared that the responsibility for any decision-making, action, and potential profit and loss in the capital market and cryptocurrency market lies with the trader.