
Blockbullder
@t_Blockbullder

What symbols does the trader recommend buying?
Purchase History
پیام های تریدر
Filter
Blockbullder
SAGAUSDT – Reverse Head & Shoulders Eyeing $4.45 Target

SAGA’s reverse head and shoulders pattern is nearing completion, but the breakout hasn’t quite occurred yet. Based on the measured move of the pattern and aligning it with the Fib 3.618 extension, the target price after a confirmed breakout is around $4.45. We’re currently seeing the price consolidate below the neckline, and if the breakout confirms, we could see a rapid move to the 1.618 Fib at $3.24, followed by the 2.618 Fib at $3.84. The ultimate target, based on the head and shoulders measured move, is the Fib 3.618 extension at $4.45, a significant bullish projection. However, keep an eye on the RSI and RSI Divergence Indicator, which are showing early signs of bearish divergence. This could mean that, even with a breakout, the price might face some turbulence, potentially pulling back to $2.50 for a retest before moving higher. In summary: If SAGA breaks out of the reverse head and shoulders pattern, the final target could be as high as $4.45. First, though, it needs to confirm the breakout by pushing through the neckline. Watch the Fib levels and be cautious of the divergence signals showing on the RSI. Disclaimer: Trading is like surfing—fun, but you might wipe out. This isn’t professional advice—always do your own research and consult a pro before diving in!
Blockbullder
AAVE retesting cup&handle breakout, 300% to ATH

AAVE is looking bullish after breaking out of some key technical patterns. First, we had a large descending wedge, which is a textbook bullish reversal pattern. The breakout from this wedge was followed by a cup and handle formation, another strong bullish signal. Now we’re moving toward some key Fibonacci levels. The 0.382 Fib level at $289 is the first major target, representing an 80% gain from the breakout. Then, we have the 0.5 Fib level at $354, a 118% profit mark, and finally, the 0.618 Fib at $427, which signals a potential 135% gain. If the momentum stays strong, the final stretch would be a test of the all-time high (ATH) near $667, a 300% move from the entry point around $162. AAVE has momentum, but we should watch closely as it approaches these Fib levels, especially the $289 and $354 marks. In summary: AAVE has made a powerful breakout, but keep your eyes on those key Fibonacci levels for potential resistance. Always manage your risk as this could be an exciting, but volatile, ride. Disclaimer: Trading is like surfing—fun, but you might wipe out. This isn’t professional advice—always do your own research and consult a pro before diving in!
Blockbullder
Most were sidelined for the first 143D & most will miss the next

Tick tock, tick tock… That’s the sound of the next 143 days counting down. Most were sidelined for the last 143, and most will miss it again. The chart needs no explanation—this is the last cycle before regulation finally stifles all opportunity for the working class to change their fortunes. Don’t sit on the sidelines wishing, ‘what if…
Blockbullder
WU Breakout & retested descending wedge 400%+ target
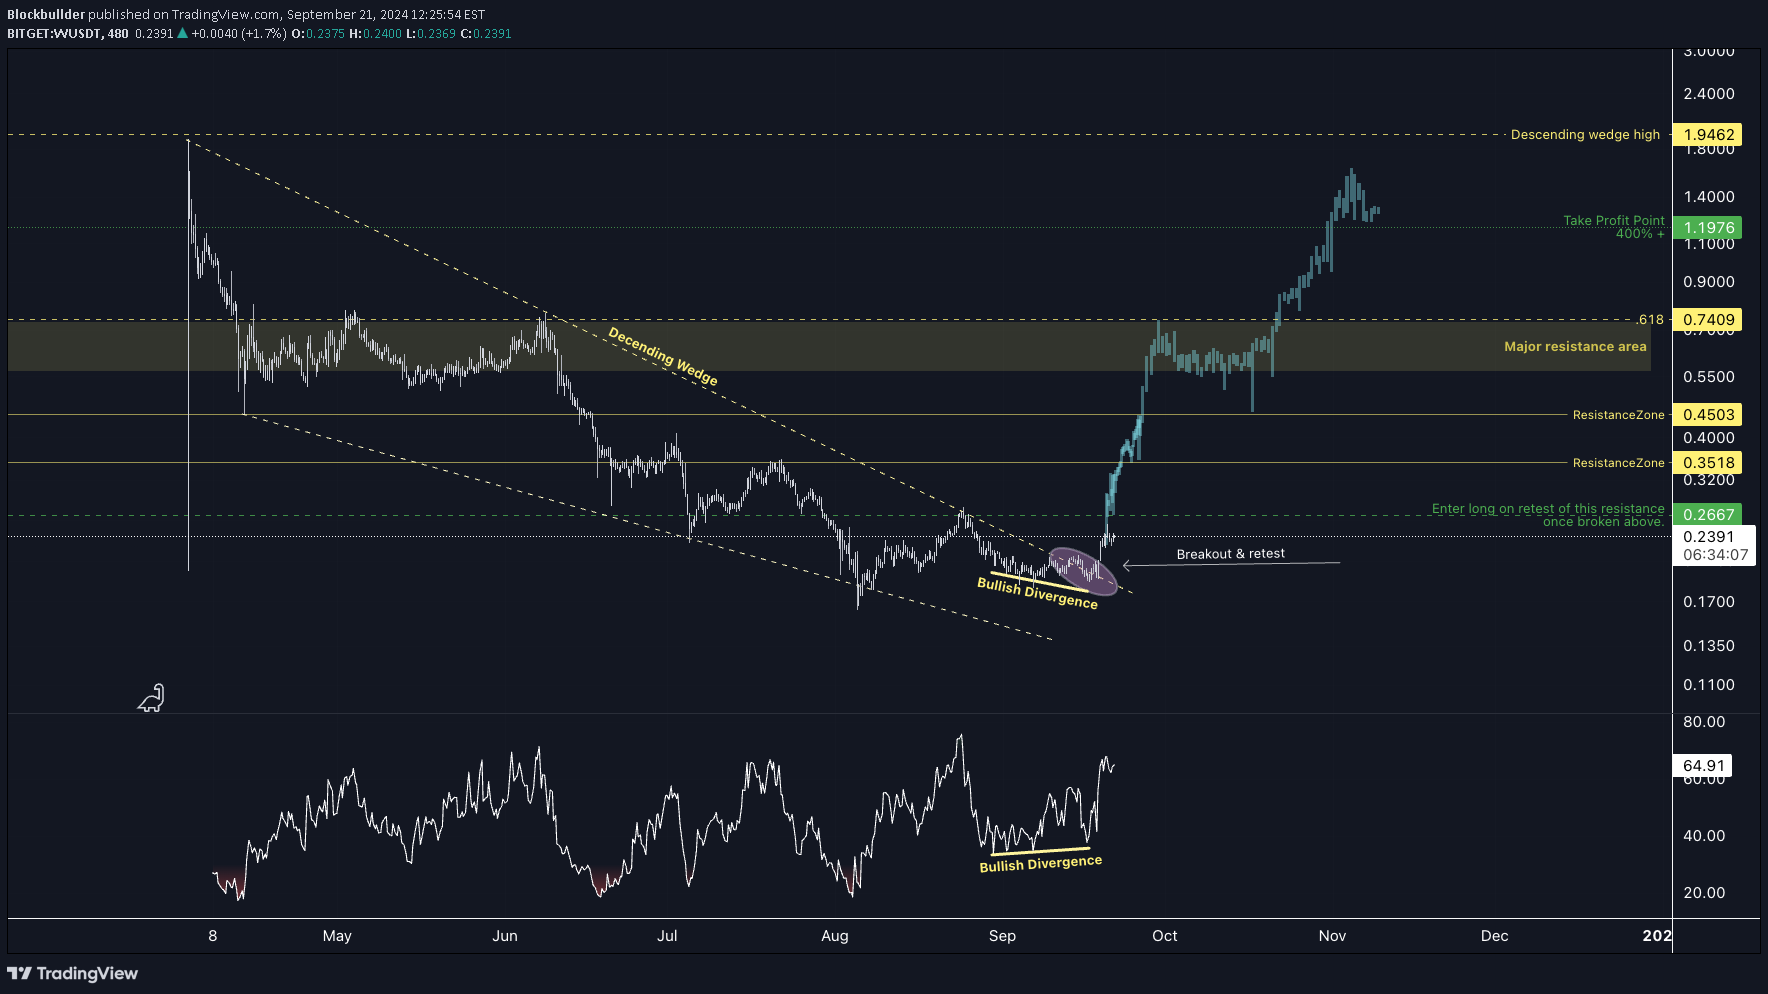
The chart presents a descending wedge pattern, a typical bullish reversal setup. A clear breakout from the wedge has occurred, followed by a successful retest of the breakout level, confirming upward momentum. This breakout is supported by bullish divergence on the RSI, signaling a shift in momentum to the bulls. After the breakout, the price has entered a resistance area. This zone will be critical to watch as price action here will dictate the continuation of the trend. A clear break above this resistance would indicate further bullish continuation & a good second entry into a position with stop loss below the wedge. For an entry strategy, a long position can be considered on a retest of the breakout zone, now acting as support around $0.2667. A stop loss can be placed below this level to manage risk in case of a false breakout. The take-profit targets would be the previous wedge high and the higher Fibonacci extension levels. This is a swing trade setup which coincides with the bull run. I would expect to be in this for many weeks. Trading is like surfing — fun, but you might wipe out. This isn’t professional advice—always do your own research and consult a pro before diving in!
Blockbullder
DOGEUSD – Cup and Handle Breakout: Scalping to the 0.618 Fib

Well, it looks like DOGE has broken out of the cup and handle pattern we were watching. With this breakout, the next immediate target is the 0.618 Fibonacci retracement level at $0.116, which represents a potential 10% move from the breakout point. This level is crucial for traders looking to scalp quick profits before deciding on further direction. Given the strength of the breakout, there’s a good chance we’ll see the price push up toward the 0.618 Fib level. If you’re looking to scalp, this move offers a solid short-term opportunity. However, watch closely for any signs of a reversal or hesitation around this resistance level – breaking through it could lead to further gains, while rejection might pull us back to test previous support levels. In short, with DOGE pushing past the handle breakout, a scalp to $0.116 is looking like a good setup for a quick 10%. Keep an eye on momentum as we approach this key resistance level.
Blockbullder
Sui's correction completed & breakout from a reverse H&S
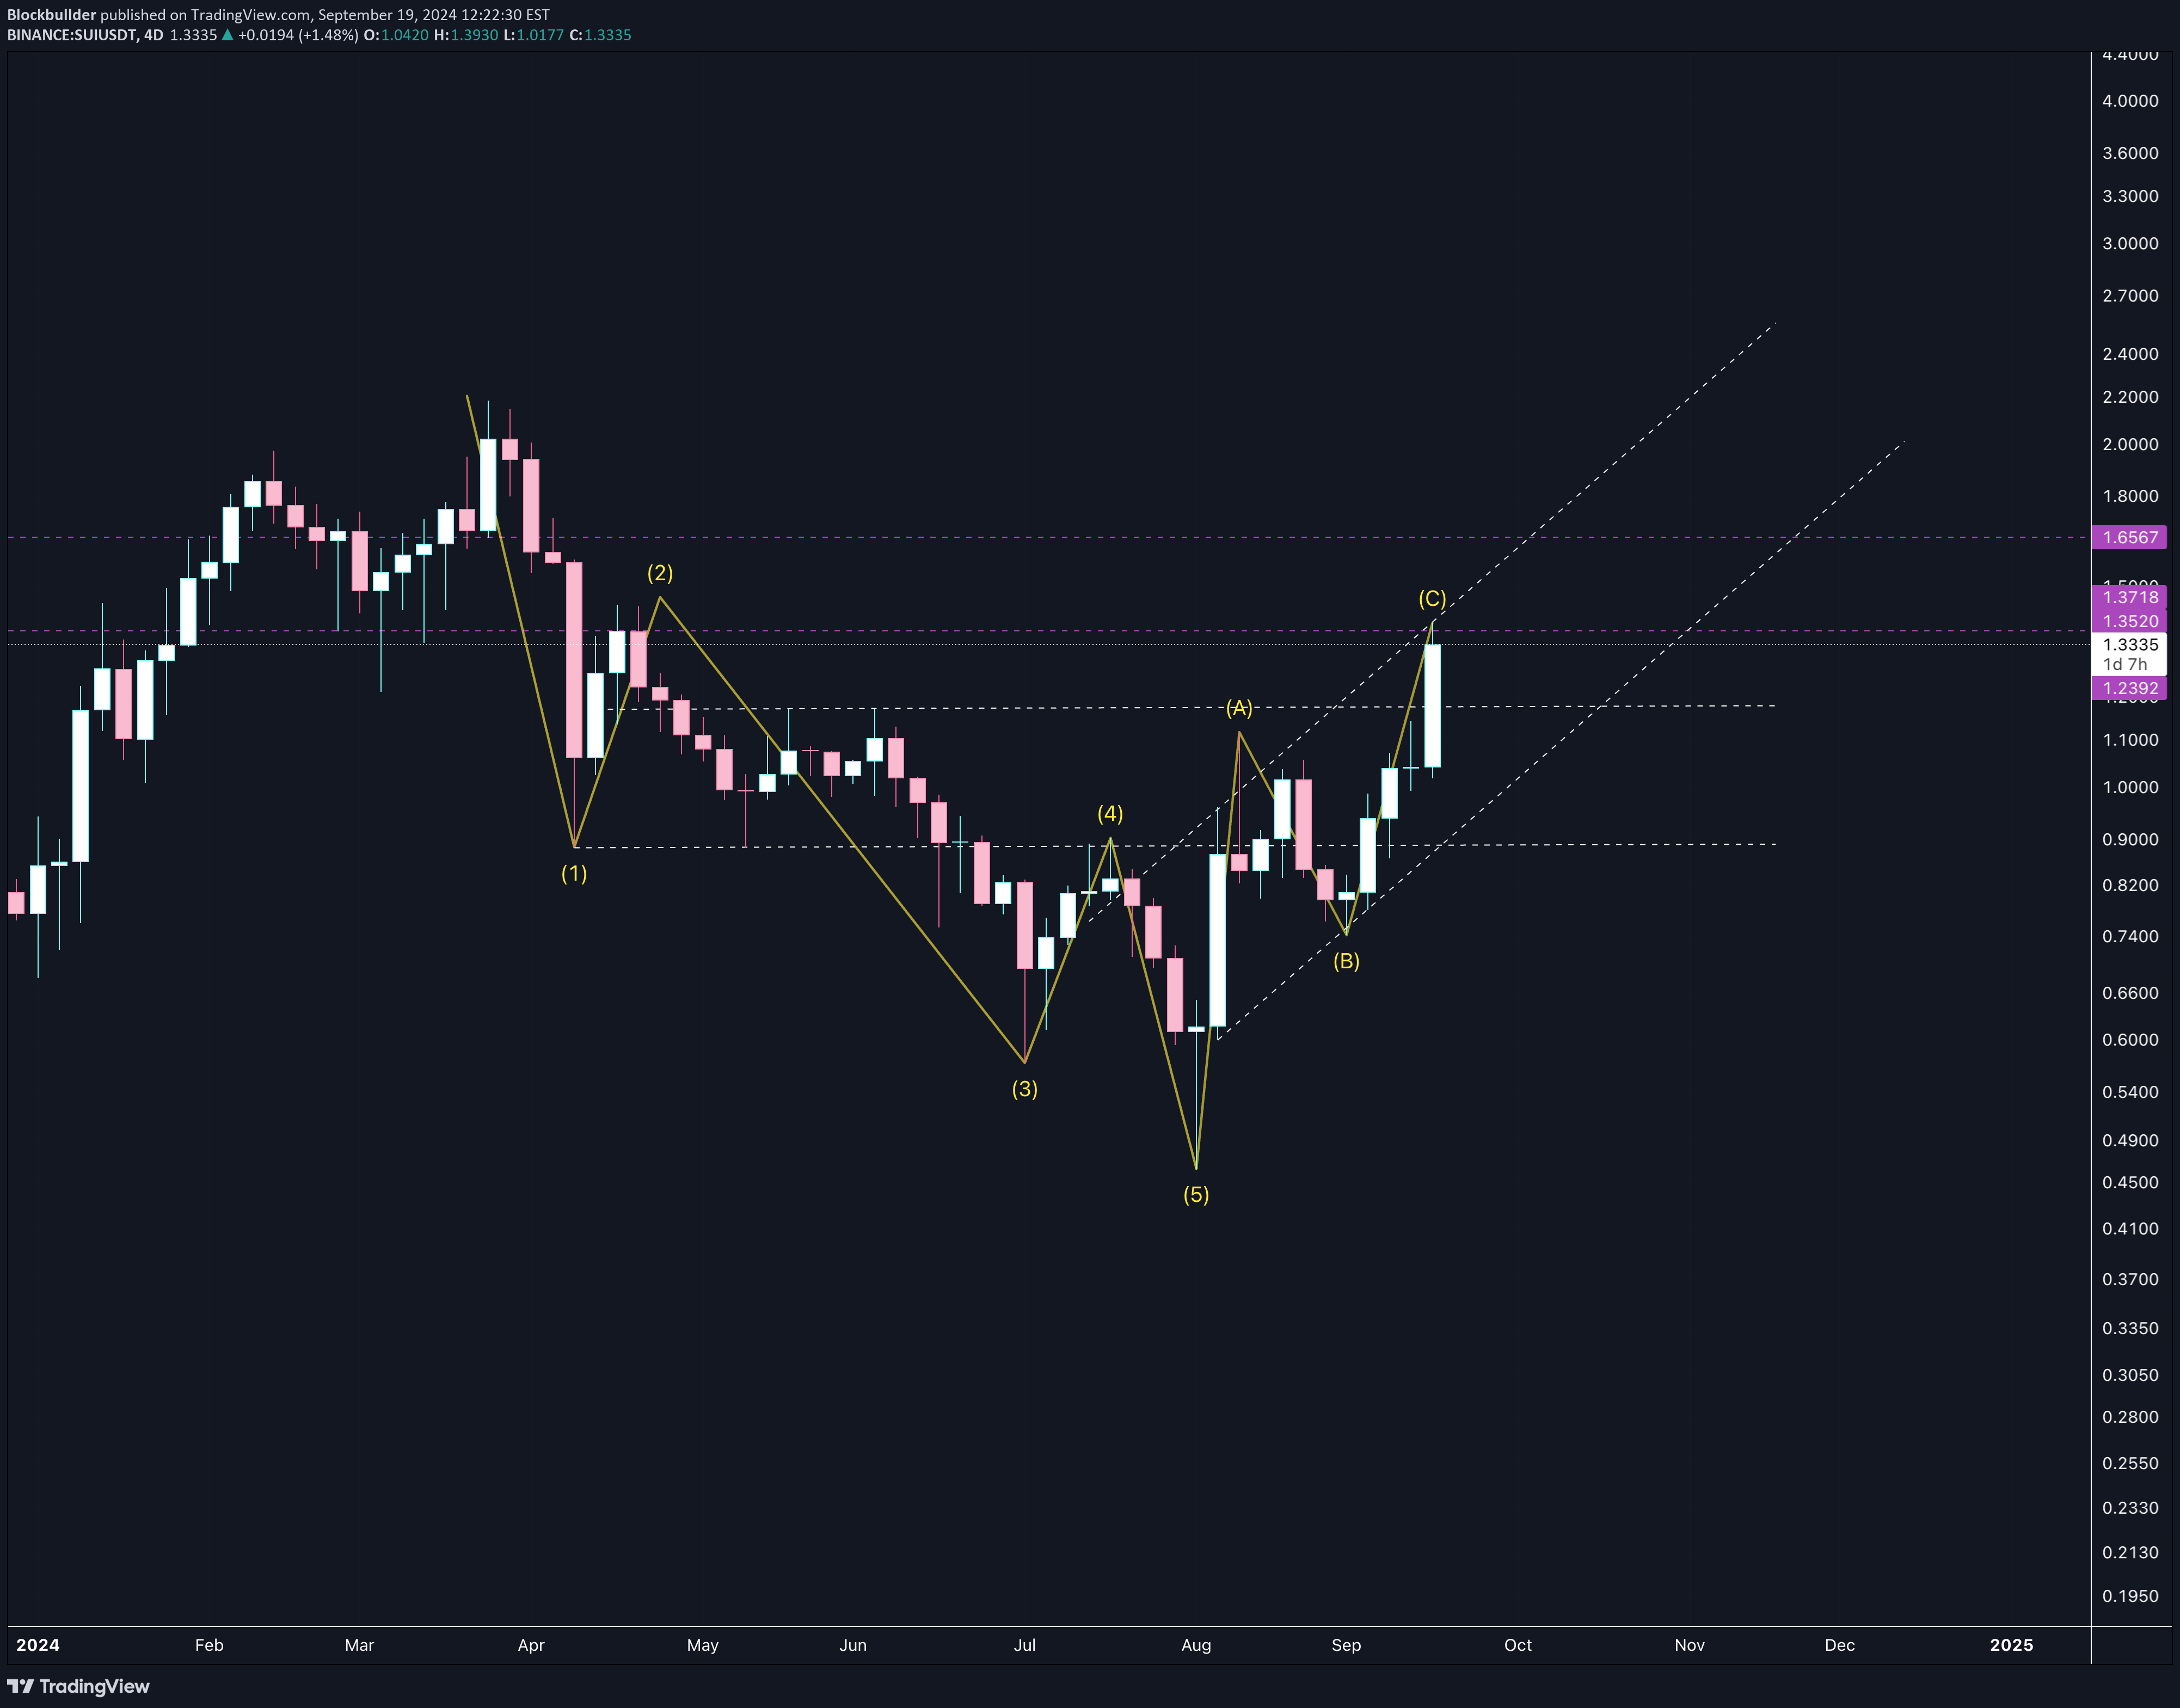
SUI’s been on quite the ride, and right now, it’s looking like we might be wrapping up this ABC correction. Here’s what I’m seeing: 5-Wave Downer (1-5): The market took a hit – we all saw it coming. Classic 5-wave impulse down. And now? We’re watching the recovery take shape in this ABC correction: (A): The first bounce after hitting rock bottom. You knew that was coming. (B): A bit of a fake-out, price dips again just to keep us on our toes. (C): And now we’re pushing up toward the $1.65-$1.70 zone – the magic number that everyone’s watching. Resistance Area: This $1.65-$1.70 level is like a wall. It’s been there before and could be again, so pay attention. If we smash through, we might be talking a move toward $2.00. Upward Channel: Look at that beautiful rising channel we’re in. Price is climbing, but it’s at the top now. This is the part where things get interesting. What Could Happen Next: 1.Breakout City: If SUI powers through $1.70, this thing’s got some legs. $2.00 and beyond is totally on the table. 2.Hard Pass: But if it gets rejected, brace yourself – we could see a dip back down to $1.20, testing that channel’s lower edge. In a nutshell: SUI’s about to make a move. Keep your eyes peeled on the resistance zone. If it goes through, we’re in for a ride. If not, it’s time to buckle up for another drop.
Blockbullder
SOLUSDT – Potential ABC Correction into Resistance
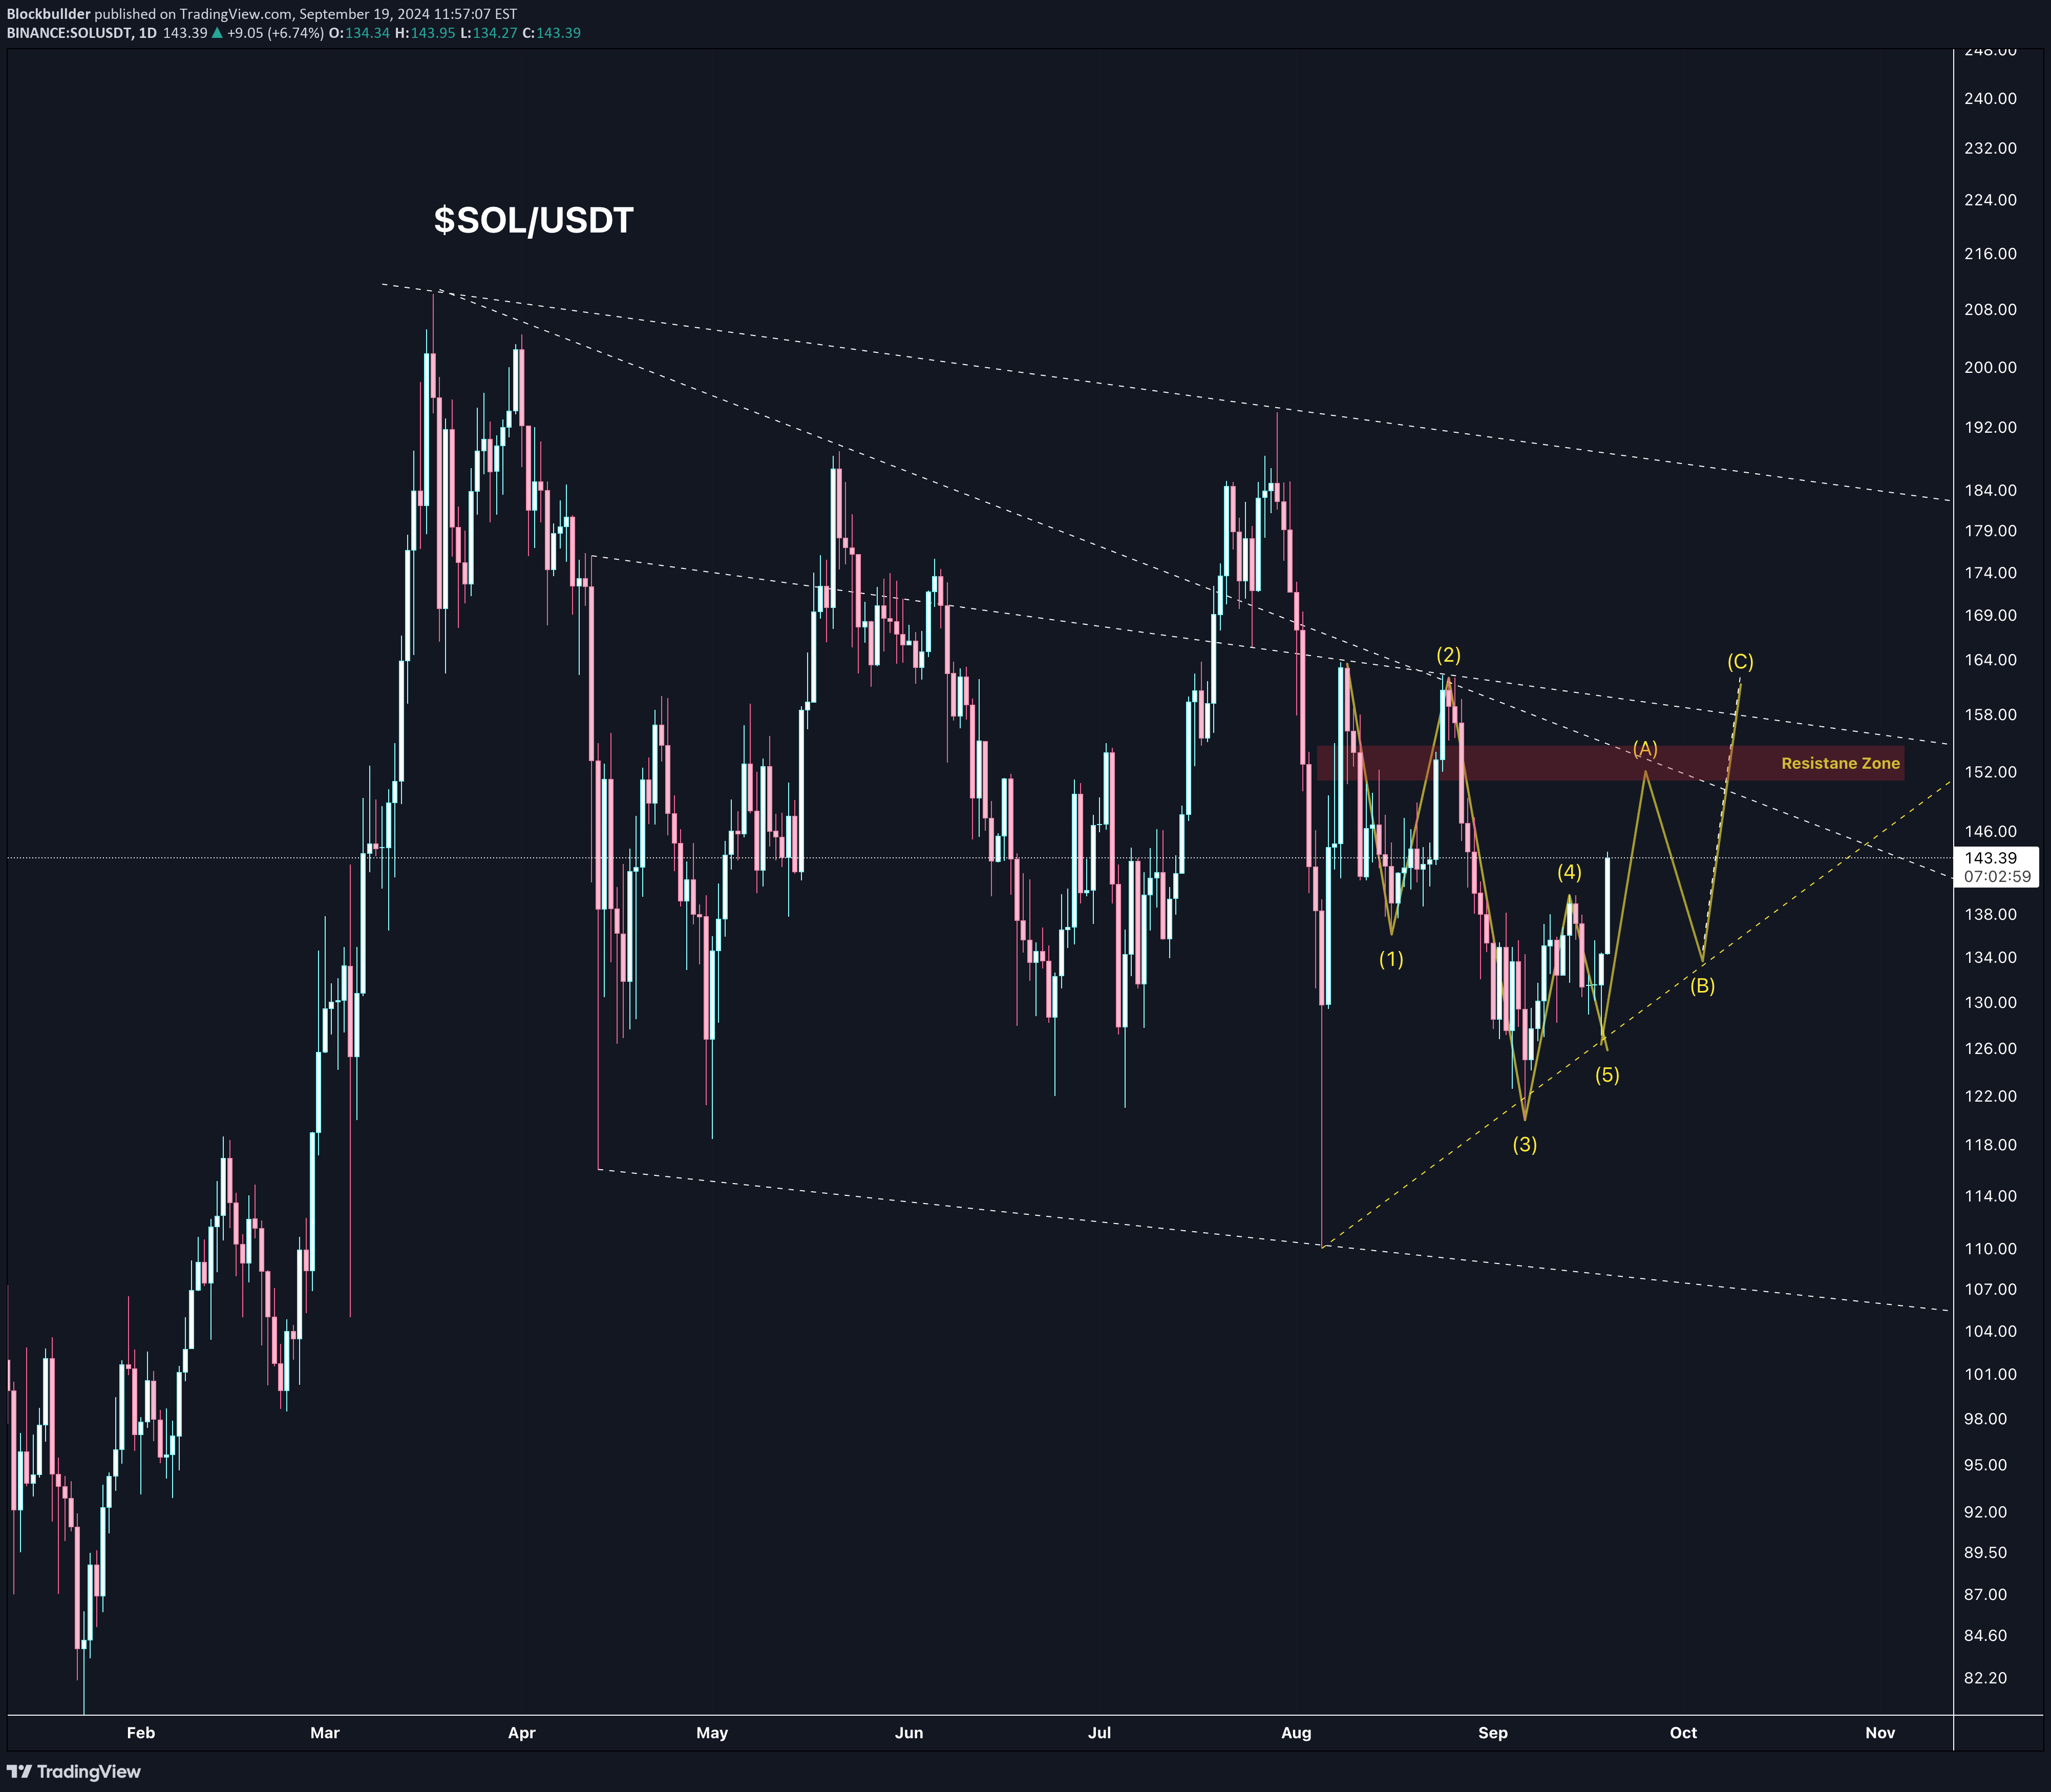
In this analysis, we’re tracking an Elliott Wave structure on Solana’s daily chart. Here’s what we’re seeing: Resistance Zone ($150-$160): This zone has been tested multiple times and remains a critical level to break for further bullish continuation. A break above this area could lead to a much stronger move towards $170+ levels. Elliott Wave Count: We have just completed a 5-wave impulse down, marking a significant local bottom around $129-$130. Now, we’re possibly in the midst of an ABC corrective wave: (A): First push upwards off the $129-$130 zone. (B): Expected pullback after testing the resistance. (C): Potential rally back to $150-$160 resistance to complete the ABC structure. Support Trendline: The ascending yellow trendline connects key lows and is guiding the price upward. This line will act as dynamic support, and any break below it could invalidate the bullish scenario. Key Levels: Watch the resistance zone at $150-$160 closely; breaking this with strong volume would confirm a bullish breakout. Failure to break above could push SOL back to retest support around $130-$135. Conclusion: SOL is entering a critical phase. The ABC correction points to a potential test of the resistance zone at $150-$160, but traders should be cautious of rejection here. If the bullish scenario plays out, we could see a move toward $170+. However, invalidation below the ascending support trendline could lead to more downside.
Blockbullder
Solana’s 2024 Cycle vs. 2020: Hidden Divergence Fractal

In this chart, we’re comparing Solana’s 2024 cycle to its 2020 cycle, with a focus on hidden bullish divergences in the RSI and similar bar structures. Both cycles are displaying key similarities in terms of duration, volume, and momentum shifts, which suggest that SOL might be gearing up for another strong rally. 2024 Cycle (Left): Hidden Bullish Divergence: The current cycle shows a clear hidden bullish divergence in the RSI, which is often a sign of continuation in the prevailing trend, in this case, a long-term uptrend. This divergence is forming over a 273-bar period (~273 days), very similar to what we saw in 2020. Volume Analysis: The volume during this consolidation phase is 81.725M, suggesting accumulation is happening despite the price consolidating in a range. Compare this to the 2020 cycle’s lower volume during the same period, and it becomes clear that there’s substantial interest in Solana during this phase. 46-bar Correction: The recent 46-bar correction (~46 days) aligns almost perfectly with the 2020 fractal, indicating a possible repeat of the pattern. 2020 Cycle (Right): Fractal Comparison: The 2020 cycle, also showing a hidden bullish divergence over a 273-day period, led to a significant rally. After a similar 46-bar correction, SOL saw a major move upward, ultimately breaking through resistance levels. The hidden divergence on the RSI was the key signal of the bullish continuation that followed. Volume: The volume during this phase in 2020 was notably lower than the 2024 cycle, reinforcing the idea that more liquidity and interest is now present, which could amplify the move when the breakout occurs. Key Takeaways: Hidden Bullish Divergence: Both cycles have strong hidden bullish divergences, which historically signal continuation. In this case, that would point to a resumption of the uptrend. Fractal Consistency: The near-identical bar counts and price structures suggest that the 2024 cycle could follow a similar path to 2020. A breakout from this consolidation could take SOL to new highs if the fractal pattern continues to play out. Volume: The higher volume in 2024 compared to 2020 supports a stronger potential breakout. Traders should keep an eye on the RSI, volume, and any price action around key support and resistance zones, as Solana may be setting up for a move similar to its explosive 2020 rally.
Blockbullder
BTC Fractal suggests bottom is in, with a flagpole to $90k+

In this chart, we are looking at a clear fractal pattern, which has been unfolding in a bullish structure. After a significant rally post the April 2024 halving, Bitcoin entered a consolidation phase, which is visually highlighted by the yellow channel on the right side of the chart. Key Observations: 1.Bullish Flag Formation: We see a clear bullish flag structure following the sharp rise. Bitcoin has moved within this flag (marked by the yellow lines), indicating a healthy consolidation after the rapid ascent. This kind of price action often signals a continuation of the previous trend, which in this case is bullish. 2.Historical Fractal Patterns: Similar consolidation patterns (circled in purple) occurred in previous cycles, as seen in 2023 and prior. Each of these consolidation zones eventually broke to the upside, leading to the next leg higher. The current price action mirrors these past structures, suggesting that BTC could break out soon. 3.Volume Contraction: As we approach the end of the flag, volume has contracted, which is typical before a breakout. This is a classic sign of accumulation as sellers lose momentum and buyers prepare for the next move. 4.Breakout Potential: If BTC breaks above the upper boundary of the flag, we could see a swift move toward the $80K range, with the possibility of even higher targets beyond that in the next leg up. Next Steps: •Watch for Breakout Confirmation: A breakout above the upper yellow line with increasing volume would provide a strong signal that Bitcoin is ready for its next rally. •Target: Once confirmed, the price projection based on the flag pattern would suggest a target around $90K+. •Risk Management: In the event of a downside break, the lower boundary of the flag and the 52K support level will be key areas to watch. Bitcoin’s price continues to follow the 2016-2017 fractal pattern closely, and based on this historic model, the next few weeks could offer substantial gains for the bulls.
Blockbullder
Further 50% decline in store for TON with bearish continuation

TON/USD – Bearish Continuation with Elliott Wave & Head and Shoulders Setup Toncoin has completed a Wave B as part of an ongoing A-B-C correction in the Elliott Wave structure. We are now entering Wave C, targeting a .618 Fibonacci level around $2.81. This level coincides with a previous high retest, adding further confluence to the idea of a potential bottom there. Additionally, a Head and Shoulders pattern has formed, with the head peaking in May 2024 and a lower right shoulder forming around July/August 2024. The neckline sits around $5.00, and a confirmed breakdown below this level could accelerate the move toward the $2.81 target, completing Wave C. Key Levels: •Current Price: $5.61 •Neckline: $5.00 •Wave C Target: $2.81 (50% drop) Both the Elliott Wave and the Head and Shoulders pattern suggest further downside, with $2.81 acting as a critical support zone. A break of the neckline could signal more selling pressure. Keep an eye on price action near $5.00 for confirmation.
Disclaimer
Any content and materials included in Sahmeto's website and official communication channels are a compilation of personal opinions and analyses and are not binding. They do not constitute any recommendation for buying, selling, entering or exiting the stock market and cryptocurrency market. Also, all news and analyses included in the website and channels are merely republished information from official and unofficial domestic and foreign sources, and it is obvious that users of the said content are responsible for following up and ensuring the authenticity and accuracy of the materials. Therefore, while disclaiming responsibility, it is declared that the responsibility for any decision-making, action, and potential profit and loss in the capital market and cryptocurrency market lies with the trader.