
Binary_Forecasting_Service
@t_Binary_Forecasting_Service

What symbols does the trader recommend buying?
Purchase History
پیام های تریدر
Filter
Binary_Forecasting_Service
آخرین شانس برای رسیدن به هدف ۴۰۵۸ تا ولنتاین ۲۰۲۶: رمزگشایی از مسیر ۱۰ ساله!

Binary_Forecasting_Service
پیشبینی انفجاری طلا: مسیرهای پنهان رسیدن به ۶۸۸۸ در ۵۰۰ روز!

This continues directly from previous post. I will add more in time.10/02/25, 5:43 PM ET, SO FOR THE LONGEST TIME: 1) I saw gold would hit 3500 2) and I saw this at 1600s, evidence here (hit replay twice) 3) but I could not justify what price would do following that 4) and IT'S NOT GOING TO FOLLOW THAT ROUTE FURTHER (this I know) 5) and the fact that price hits this circle from this post (hit replay) 6) forced me to confirm all the the details of the "blue route" I wrote about in last post 7) like this (where gray route is yellow now in chart at top):8) now I want you to understand that I see 6888 in 500 days 9) and that CURRENT PRICE ACTION FAVORS BLUE ROUTE 10) that means 4333-4555 before checking 3888, finally 6888 11) but I do not see 3965 breaking, I just do not 12) and that means that what I think is coming is this:13) if you read anything anywhere lately, the banks are now calling 4000-5000-6000 and 7000 is now being talked about 14) yeah, all fine and good, but they are talking 2028-2029 15) that means nothing to me 16) I see 6888 in 500 days 17) that part is easy to understand 18) but the only outcome worth waiting for 19) is the 3965-3215 route, where 3215 would be THIS DECEMBER 20) I had previously eliminated this route 21) but finally on good historical data, in my view... 22) this should be the base case AS LONG AS PRICE DOES NOT BREAK ABOVE 396523) but of course, the blue route would be the mirror image like this:24) so the finally decision is LAST 10 DAYS OF NOVEMBER 25) and as I said in August, DECEMBER IS WHAT WE ARE ARE WAITING FOR 26) until then, I want to see red line above finally break
Binary_Forecasting_Service
But reality doesn't work that way. Odds change when facts change. And right now here are the facts: 1) this continues directly from "6200 BY HALLOWEEN" 2) which I stayed was not going to happen AHEAD OF THE WEEKEND 3) which Trump bombed Iran and everything... 4) so here we are, I wrote of 3 routes in play 5) in chart above here's how it's going to go 6) the most important line right now is the bold black line 7) pointing at 2165 in December 8) FOR ANY OTHER ROUTE TO WORK, THIS LINE MUST BREAK 9) why? because the top now has perfect setup to move for 1-2-3 levels 10) if price breaks dashed line AT #2, that's a seriously problem 11) because 3-4-5 would become favored once 2 gets hit 12) past 8/11 where the those two lines crossed 13) w/ the giant arrow pointing at it 14) this means 6-7-8-9 which would BREAK THE 45 YEAR LINE 15) and hit the 14-year line at 2165 and simultaneously 16) hitting the the red down trend line from 2790 17) obviously... for gray route (previously black) to work, 18) gray bold line matters (but it can still break and get re-made) 19) blue route needs blue line to hold 20) in all scenarios, this October promises to be a big one 21) IN THIS SCENARIO, SILVER NEEDS TO HOLD 26-26.50 AREA 22) that is a wrap7:20 PM, NO, it doesn't have to be October 23) while it can be, I cannot prove it's favored 24) I would have to call the entire window from October to February 25) 2180 GIVE OR TAKE9) in my opinion, in chart above 10) this is the call of the year for 2025 11) this is the call of the year for 2026 12) because it is essentially a super-giant "V" formation 13) this justifies the following rally to hit 11500-12500 in the following 6 years 14) again, I don't care what silver thinks is going to happen 15) until it can lead, it can only react to go gold16) honestly, this took all my experience and education to "call this" this way 17) I will add notes from time to time as we go down6/28, 10:17 AM ET NY TIME, no, the floor MUST BE 2550 OR HIGHER 1) this I know now 2) so same pattern, higher floor like this:3) chart above goes through 2028 4) this much is knowable now5) on 6/29, very close to a strong draft 6) it should be 2255-2333, somewhere in there7) 10:05 PM ET, I've solved all of it 8) we go under previous 3120 low, maybe as low as 3050.... 9) but it means nothing because bulls will break that bold line causing this:10) this is basically the second outcome mentioned leading to this post 11) if bulls raise the floor in August, then there's nothing left to talk about 12) except where this rally tops, which is 6200 or 7250 or a bit a higher13) so checklist is the following 14) first we stall Mon, probably Tuesday as well above 3300 15) then we move under previous 3120 low by mid July 16) then we break bold line and put in a third top 17) which we will know "is a third top" by September 18) this will zig zag to a November low at 2870 19) I have nothing to add to this unless this changes meaningfully 20) if not, see you in 4-5 months6/30, it's never going to stop shifting 21) there's no way to know except totally continuous updating 22) and I am not going to do that 23) the demand is not there 24) good bye20) in chart above on 07/29/25... 21) it's really hard to explain silver's price action since gold hit 3500 22) but if it intends to take out 41.50 and 45.00 23) gold has no choice but take out 3760 24) the problem is that we don't have a historical situation like this 25) that is unless you believe gold will hit $11500-$12500 by END OF 2028 26) meanwhile, I no longer have the equipment to do around the clock subs 27) so please stop asking about that8/19, What is the absolute longest stall at 3320, because it's trading 3319 as I type.... a) at 2:33 PM ET NY time... b) so I cannot tell what will happen between now and November c) bc the odds of 3120 and 3600 is about the same d) but understand that Ukraine peace deal would have ramifications e) BUT ONLY UNTIL DECEMBER f) if at 31xx in December, then max 3320 can hold until 02/15/26 g) or roughly Valentines day h) 2026 end of year high 5500-600008.26.2025 so here is route to 6300:1) this means that price will move for 3600s maybe 3700s 2) and retest 3420 3) after which this will repeat again 4) except that the second move for 3600-3700... 5) should be weaker 6) this will end at 3420 again first half of December7) from December to May 2026 is the move for 4900 8) then the move for 6300 finishes December OF 2026 9) so again, it's going to be December 10) what we need to see is 3700+/- 50 in next 40 days11. detailing says the 3600-3700 high can take 12. 60 days, so second half October13) in this situation, the low is the next 5 weeks 14) but the pattern is the same, and time frame is same 15) nothing worth talking about until December16) so all in all? 17) let's just wait until December
Binary_Forecasting_Service

This took a lot of headache to figure out, but I finally did it. And here's what I see: ` 1) we top this October, gold at 6200 2) silver, I could care less until it surpasses gold meaningfully 3) and I still don't see it this year 4) silver's 45-year line is UNDER $51, I do not see this breaking 5) despite gold moving agressively to 6200 6) that is what the math says convincingly 7) this is not the the top for metals 8) but because of the 6X move since beginning of 2016 circa 1000 9) there's going to be a hard retrace that could take a year 10) I don't see silver making waves until well into 2027 11) in chart above, the setup for 6200 requires gold to hit 3850 12) this by first week of July 13) tomorrow is FOMC, we should be above 3500 the day after that 14) obviously this is giant move in a very tight window 15) we will see what I can for semi continuous coverage06/18/25, 12.5 hours ahead of FOMC, 12:28 AM ET, New York time and I posted this chart in last post: a) in chart above, I use arcs and curves to illustrate what trend maps are saying b) that is to say there has to be a mountain of technical evidence behind this type of analysiis c) with that said, a picture is worth a thousand words, for example:d) in the most basic read of chart above e) this rally, from end of 2015 or beginning of 2016 when price was about $1050 f) is comparable about 2.91 time frame wise vs 1976 through 1980 time frame when price ... g) went 100 to 875 or 8.75x h) so if we DISREGARD THE PATTERN DIFFERENCE, when price goes vertical ... i) which it is about to do in the 125 days ahead j) and runs into the the arc curving backwards, that's the top k) in other words 6200 about October 17-21 this year l) where the difference in pattern matter is that this time is NOT THE TOPm) and why? n) because the right side of chart above is deceiving... o) meaning it doesn't need that curve for 6200 p) WE ONLY NEED THIS ONE:q) in chart above, that's the black curve and here is zoomed in:9:01 AM, looks like more stalling today. 1) don't know if it will move yet 2) not saying it can't 3) but first impression says more stalling4) 9:09 AM, it keeps saying almost ready10:00 AM ET, chart above is full count since 1610 1) with two more counts remaining 2) meaning approximately 12500 and 250003) but this would take several more years4) but it all makes sense like this:5) in chart above, where 6200 is blue 3 6) hence the explanation why silver hasn't moved 7) despite that 700 target I wrote about ago 8) because it's still early 9) even gold at 6200, would likely correct 5200, 4800 maybe even lower 10) it's at this correction after 6200, which would take place by this December if early... 11) and by next August if late... 12) that we confirm the point I made a while ago 13) that silver weakness WEAKENS vs gold weakness 14) that is to say we would see silver CORRECT LESS IN % TERMS THAN GOLD 15) then the silver market boom would finally start16) in chart above that would mean that the FOMC meeting today will disappoint 17) so what can cause the reverse up? 18) REAL WAR, maybe the U.S. gets in 19) maybe something else 20) in any case, 3650 for JUNE 24TH stays as the target10:20 PM 6.19, this is taking way too long to break out...10:20 AM, 6.20, 3368 after passing 3333 test and... 1) this is not going to work 2) I cannot make sense of all of it together 3) too many conflicting signals in gold, silver, trend and fundamentals 4) so I the first obvious understanding is this move cannot happen 5) what will happen? 6) no idea, but it doesn't look great because the setup is gone 7) there's only one move left to entertain and right now not worth entertaining 8) the endSunday 12:14 AM ET, 6/21... 1) I am aware Trump bombed Iran 2) and in a big way... is it enough? 3) in a word, no it's not 4) even if price some how made it to 3850-40xx 5) this move is over 6) we need an 15-20% correction 7) before the rally to what looks like 6200-6400 8) and this would push that 6K top into Jan of 2027 9) so in the mean time? 10) no doubt this bombing results in 3400 again 11) beyond that is still much in doubt 12) and if no new high soon? 13) that means 2870 before 6200_640014) when do I expect 2870 if top is in? 15) September or October 16) if some how we get one more high? 17) then November 18) but my attention would turn to China-Taiwan 19) as the cause for 6200 gold prices 20) and for silver? 21) 135 cap if 125 breaks 22) all this by Jan 2027 23) but I expect nothing interesting until 24) 09/20 to 11/20 window 25) I will see you then1) in chart above, this would make everything make sense 2) because we still don't have an obvious top 3) in this case, it would not get interesting until April 20266/24, 2:54 PM ET, New York time here's basically how this problem gets solved 1) there are 3 scenarios that are worth talking about 2) the first one is chart above in black 3) it requires that this curve will hold:4) the binary for that move above, which moves for 6200-6400... 5) starts out faking to 2870, but finishes the same way, like this:6) BUT THE SITUATION NOW IS CRITICAL:1) so here is post for that:2) again, once price moves under #2 3) which is 3075... 4) is when it gets interesting
Binary_Forecasting_Service

1) features 2877 low for gold 2) 31.45 low for silver 3) by end of July 4) with entries coming end of September 5) long to March 15th 2026 6) gold to 6655 7) silver to 144.55 8) if both charts hit to September 9) I'll have something going on then10)) for the record, you want to get silver when hits 31.xx 11) which would be end of July, maybe first week of August 12) because you would be paying $34 September11:12 PM ET, 06-12, Israel vs Iran and we are 3450 and climbing... a) yesterday was when the news came out b) and seeing that I wanted to post a note that c) it would take REAL WAR for yellow route to be on time d) and tonight we have REAL WAR06/15/25 -- so where are we now? 1) first, war is a distinctively gold not silver situation 2) meaning gold has war premium and silver does not 3) this means that the next gold & silver dual top 4) should still feature a gold lead to the high 5) this will have the effect of stretching out the blue route for silver in chart at top 6) pushing the silver high into september 7) but doesn't really add any vol, if anything would reduce it 8) so to get silver out of the way, I think it should be like this9) as for gold we are going to 5175, likely by 09/25 10) but for the title 11) let's call lit 5175 BY HALLOWEEN12) at the same time the rally would be INCOMPLETE 13) so I have to call 12750 for September 2026 14) does silver get a bump up? 15) it is not unrealistic to imagine a 350 silver price 16) but you can't call higher than 175 and then we will see17) the reason is, it is obvious to me that the call SHOULD BE 18) 5188 FOR GOLD ON OR BEFORE 10/21 19) and I would not be at all surprised if it hit 30 days early 20) but it's NOT OBVIOUS TO ME SILVER CAN BREAK ABOVE 41.50 21) and if it does, 45 then 48.50 then 51.25-51.50 22) and I mean at the same time gold runs to 5K± .23) while that range is 4944-52xx, my call is 51889.09 AM, 6.16.25, I HAVE THE PERFECT WAY TO EXPLAIN THIS... 1) just no time right now 2) but basically, we need to know if 3500 .... 3) marks the ending of the run since November 4) other wise we can't call when or how high the following top is.... 5) bc 5200 doesn't have to be the top 6) we are starting to stretch into 6K.... 7) but we need to know where the previous rally ends 8) we still don't know that6/17, 11:06 AM ET, 6000 BY HALLOWEEN 1) price trading 3387 as I type 2) silver ALREADY MOVED UP... and gold still treading water 3) but this took me a lot of time to justify 4) but I haves strong conviction in the math 5) it's going to be 5900-6300 6) and it's going to take all of October as well06/17/26 -- WHAT I I KNOW NOW 1) we are in the explosive time frame for gold and silver 2) the only questions are exactly when and how high 3) I know now that this rally ends in October with gold circa 6200 4) I assume somewhat dangerously that 51.50 should hold silver's high 5) that I do not really know 6) but THAT IS WHERE SILVER'S 45-YEAR TREND LINE IS 7) THIS HAS GIANT IMPLICATIONS FOR 2026 as evidence shows 8) that the run to this October is NOT NEAR HALF WAY 9) so there's thatLAST POST BEFORE CONTINUOUS COVERAGE:1) chart above is link to prepwork 2) before I start continuous (semi) continuous coverage again 3) so keep that in mind
Binary_Forecasting_Service

If you are reading this, it is because you have followed my gold forecasting for some time and you also realize we are at A SUPER CRITICAL INFLECTION POINT for both gold and silver as precious metals attempt to reclaim their rightful position in global asset allocations. That is to say, the possibility for wealth accumulation in the incoming 7-year window in the precious metals market is a "once-in-a-generation" opportunity. I am writing this because the opportunity is so gigantic that it is too hard for me to walk away from this and I would regret it for the rest of my life should it come to pass and I did not express my view on it at the outset. So for the people who have followed me in the last five years, I am here to finish this journey with some preconditions. But before all of that, let's clarify where we are first. Like usual, I will add as we go. However, be aware that I am much less concerned with daily price action as I usually am. At least until I have resolved "the silver question" first. And let me be absolutely clear, as of RIGHT NOW THIS IS STILL UNRESOLVED. I would be lying if I said it was resolved. I would also be a fool if I didn't recognize the the counter argument. So let us get everything worth saying on the table. Will add soon.06/03/2025 - PLEASE SPREAD THE WORD FOR ME 1) please like/boost this post 2) please refer this work to people who are interested 3) because despite reaching the height of my forecasting ability 4) I cannot continue indefinitely if this work does not lead to a career 5) the best you can do to help, is raise awareness/views of my posts 6) once again thank you for your help06/03/2025, 1:45 PM ET, New York time, let's start with gold:`22) in chart above 23) that is if and only if we consider gold by itself 24) in this situation 25) we can no longer do so because we have a conflict 26) between gold and silver 27) that requires silver to move to 44+ in...33) 06/03/25, 6:34 PM ET, SO LOOK AT CHART AT TOP 34) I marked with 2 RED LINES ONE BOLDED, ONE DASHED 35) at what happened IN THE ONLY SCENARIO WE HAVE IN HISTORY.... 36) where gold broke out massively 37) and silver actually dropped in that window 38) this marked first the silver high and then the gold high in 2011 39) this is why the past two months have been so annoying to me 40) because this fits further into the popular "reset" thesis with SPX dropping by 45-55% 41) and gold dropping 1000 to test its 45-year line that... 42) on this scale of time, has not been tested 43) am I supposed to believe gold move for 5100-5200 without testing 45 year line? 44) because since gold moved from 1610 in November 2022 to 3500 45) silver moved from 17.xx to 34.xx almost 35 46) so silver is saying now that it's moving for 38.xx in June, 39.75 in July, vol in August 47) but followed by 44 in October to what looks like 48.50 in November 48) but again if I have to call it, I would say 51.50 49) what that means is gold will go to 5000+ 50) I would put gold at 5175 51) why is this important?52) THIS IS A SERIOUS SERIOUS TECHNICAL DISAGREEMENT 53) that has produced one outstanding view... 54) a bearish case FOR EVERYTHING AS A LONG TERM RESET 55) with SP500 dropping 45-55% and gold dropping 1000, 1100, or more etc... 56) but I have been writing been about that "1000" point reversal since December 57) AND TODAY I HAVE EVIDENCE FOR GOLD 5175 AND SILVER 51.25 THIS NOVEMBER58) 7:26 PM, back in January-February window if you remembered 59) my very first reaction to gold's break of 2790 ceiling was to call the daily route to 2950-ish 60) during which I stated that this would mean gold's high for this rally is 5100 61) and then ball-parked it at 4700-5500 62) but having all gold's explosive routes past 3850 shot down before 63) I stated that I would make price action prove it 64) I am at that juncture where I can call gold 5175 in November with strong conviction06/04/25 - 1:11 AM ET NY time and 13 hours ago BofA came out with its dual 4000 gold 40 silver in 2025 forecast... 65) I am not impressed because that's the easy call... 66) calling gold for $4000 after it tagged 3500 and got bought successively at 3150 and 3240 and 3330.... 67) it would obviously make 3760-3770, and natural extensions would bring you to 3970 68) at 100:1 that would mean $39.70 silver 69) now if they call it in July or even August, I would be impressed 70) meanwhile...10:05 PM ET, NY time, 06-05-25, I don't like what happened with gold today... 1) it failed to hit 3410, which in itself not terrible 2) but the the drop to 3340s again is a signal for something else 3) and this despite silver's move to 13 year highs 4) what gold is saying is that ... 5) NOTHING PAST 3765 is obvious this month, or July, August, September, October.... 6) so I started at the top describing gold's chart 7) and BY ITSELF, it's still saying the same thing 8) so be aware 9) in the mean time, 3760 should get hit in June 10) but I could see how this could get pushed "sideways to up" into mid-July 11) long story short 12) we are going to have to see 13) which chart is right come end of June and into July 14) for the record, until silver crushes gold's momentum on the way up 15) we cannot say gold has to respect what silver is saying it's going to do...16) furthermore, if we move to 3500 come Sunday night or Monday 17) I see this hitting 3525-3535 before stalling 18) maybe even a bit more8) the case of red vs black in chart above 9) can only managed "continuously" 10) I am not doing that, but at 8:51 AM ET NY TIME, BLACK IS BASE CASE3:22 PM ET, SUNDAY, 06-08-25, all around update 1) first, I will not update continuously intraday 2) so please don't send intraday questions 3) I will simply ignore them 4) second, Friday ended up with red route 5) the problem is that silver did not complete its check down 6) we know that despite what silver is doing 7) and what it says its going to do 8) meaning 38.50, 41.50, and a 45.00 as the outlier... 9) we know gold will not respect silver strength 10) so IMMEDIATELY that means that gold's floor is 3235 11) I noted before Thursday that if gold held under 3350-60 12) that meant a route to 31xx was possible 13) however unlikely 14) but gold did hit 3405+... before checking down 15) so the realistic floor is 3235 16) and bears have 16 hours to tag or its not going to hit... 17) so gold looks like this:18) I had noted previously in last post 19) that hold would have trouble with 3400-3410 20) before higher and higher 21) but with silver taking no prisoners 22) it was difficult to call for lower than 3333 23) unless that moved was covered continuously 24) I had also said that 25) 3750 would hold for June July August September and October 26) let's make that 377527) that 3235 should be 3245, just a tad higher28) and that's an IF inside 16 hours or around NY OPEN monday3) so what does that mean for us?? 4) it means that $25000 gold and $700 silver for year 2032 ... 5) is off the table 6) because August 2026 would be an extreme for both metals 7) on very long time scales 8) that I have to believe that gold would need a 10 year correction 9) before moving for the final run to 2500010) so what we have in front of us is the blow off for this cycle 11) which began in January 201612) in chart above, silver is a "get in now" 13) with few realistic check downs for re-entry 14) the notable part here is silver has a June high WITH another high in August 15) the next big check down doesn't like it will happen until $44 to $48 16) for example: $48 to 41.50 in October17) silver route tree, 3-hour bar:4) continuing in chart above on 06-10-25, 2:21 PM ET 5) first silver on the right, the arrow points at $37.50 worst case scenario in October 6) price is trading UNDER THAT NOW 7) so hence, the entry for silver is BASICALLY NOW 8) for gold, it's going to be a complicated few months 9) I am looking for an irregular quad top 10) the specific thing is, FROM HIGH TO LOW 11) gold should CORRECT MORE THAN SILVER 12) about 6:5 in percentage terms 13) so for example if gold corrrects 18%, then silver would correct ONLY 15% 14) I this scenario is not what I thought it was going to be 15) meaning some setup for a really long run to 25000 and 700 respectively 16) so that's a wrap for this, I won't update again until 6/2517) one more thing to watch out for 18) when gold and silver diverge, it's generally a bad situation for the one going down 19) I recognize this, so with today's close at 3322.xx 20) the level you want to go in is 3333 with t a stop RIGHT BELOW IT 21) especially if this remains the case until 8:30 AM 6/11 (CPI RELEASE tomorrow) 22) I added this because I see the need for continuous coverage for the next 18 hours 23) so be aware6/11, 8:12 AM ET, 3333.XX AND I HATE THIS LOOK NOW, here's what it's trying to say 1) the odds no longer favor this route 2) so if CPI reaction forces under 3333 3) this means 2877 DUE JULY 30TH FOR GOLD; 4) so almost 18% correction 5) that implies silver would move to 31.456) this has the effect of squeezing the calendar forcing the highs to come IN MARCH 2026 7) so the highs would change like this: 8) gold would cap at 6655 in March 2026 9) and silver, hold on...10) $144.55 in March 2026 11) that places gold's entry END OF THIS SEPTEMBER 12) EVEN THOUGH THE LOW COMES END OF JULY 13) nothing would happen July to September8:32 AM, REACTION TO CCPI at 3349.xx, 14) so it looks like we have a decision 15) but gold is late, so it if it wants to keep 3775-3100-7250 route 16) it must go vertical up today, tomorrow, Friday, and Monday 17) to catch 357518) but gold is trading 3355 above 3333 19) yeah, and it needs to keep going to prevent blue outcome 20) there's only 2 outcomes left a) bull case means 3775-3100-7250 b) bear case means 2877-665521) that means silver SHOULD DO THIS:22) so that's a wrap for this post 23) if those targets hit, I will see you END OF SEPTEMBERuntil then, this needs to hit perfect perfect:24) that post is what needs to happen for me to get involved in September 25) I am not going to update it 26) if it hits, see you in September
Binary_Forecasting_Service

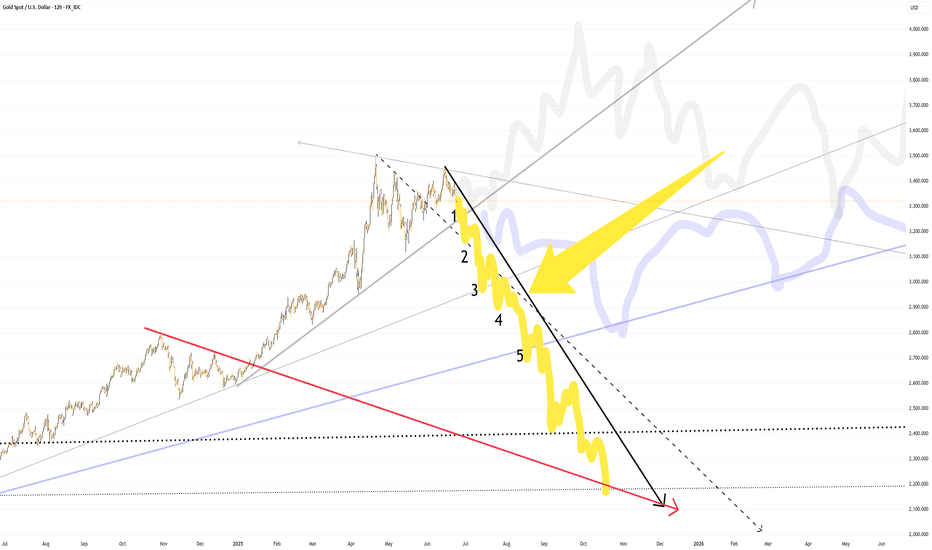
Bulls are favored as long as prices remain above 3320 ahead of FOMC. However, since U.S. aftermarket close, bears have dropped price $50 already but they still need $65 more. It's FOMC tomorrow at 19 hours out from publishing this post and chart above is the binary outcome. Bulls' route to 3760-3850-3965 have only appeared in the last 18 hours, but have strong implications that February 2026 will see $7250 gold prices, or higher. This continues directly from previous post. However, I am running out of time.7:13 PM ET, THIS IS MY LAST POST 1) I will only add should I have time 2) so be aware 3) tonight, we are watching to see what Tokyo will do with this setup 4) bulls need to keep it above 3338 to be strongly favored 5) bears need 3240s again to prevent the double blow off10:53 PM ET 5/7 ... WHAT THIS WORLD IS COMING TO?? 1) I can't make sense of the geopolitics 2) I can't grasp all the knock on effects 3) but I can tell you we are moving for 3850-4000 in 20 days or less 4) and that would set us up for 7500-8000 5) next February5/8, 10:13 AM... here's a break down of all scenarios starting 1) base case should be mid June 3965 high 2) followed by correction 3) followed by June 2026 7450 high 4) but the LOW RANGE is still 2790 floor until it's eliminated 5) the odds of this 2790 followed by 5300 high 6) are insignificant but worth pointing7) out8) only bc of the delayed check to 3320 overnight 9) but what ever odds bears have before FOMC 10) are much lower now5.11 SUN night and under 3300 with several lines of bad news for gold... 1) India pakistan agree to peace deal negotiations 2) zelensky agree to meet putting 3) China agrees to substantial progress of trade talks in Geneva 4) Trump reveals that he has several many cards to play etc... 5) silver doing exactly nothing 6) so it looks like gold is deciding between a 6600 and a 7400 high next year, 7) but the short term is getting very convoluted 8) this coming week will reveal a lot5/13, 11:17 AM ET, so here's what can be said... 1) gold absolutely favors 7150 OR HIGHER AS NEXT MAJOR HIGH 2) that is counting 3500 as a "major high" 3) we also know that the WEAK WINDOW LEFT IS NOW TO JULY 15th 4) and price does not have to "consume the entire window... 5) especially after June 25th... 6) so basically with today is 5/13, we have about 40-60 days of weak trend left in both gold and silver 7) with gold seemingly weaker8) I titled this post, at top, 2790 vs 3965 with extension to 7250 9) what I am basically seeing is 2790 can get hit or even worse 10) but price still end up at 7150 next June1) in chart above, after 2850(2565 extension)... 2) it would be 3700s in October again 3) and 4700-5100 in February 4) and 7000+ in June7:41 AM 05-14, 3230's and in chart above.. 1) the next 12 hours decides whether it is BLUE OR 2) GRAY-YELLOW (both basically the same route with varied 2 way vol) OR 3) ORANGE-RED (actually the same but needs refining 4) gray-yellow to 3050ish is favored5) continuing in chart above, I marked the four levels that need to be watched 6) on our way to that next bounce 7) in theory, the bounce should come between 3020 and 3040 8) however, the target is 2960 and not "that far down" 9) that being said, IT IS STILL AN OUTLIER TO GO STRAIGHT TO 2960 10) so base case would be bounce between 3020-3040 about 140-ish 11) BEFORE moving for 2960 12) meanwhile in silver...13) in last post... 14) I wrote that silver "needed to go to 26 in May" 15) but that was not a "call" 16) I just thought that I would make everything fit well together 17) regardless, the Fed have rates at 4.5% while inflation coming in at 2% 18) so rates are a real 2%+ 19) do we have liquidity crisis yet? 20) especially with Europe pulling out that "trillion dollar" FDI meant for the United States 21) too many questions 22) that can only be cleared up once we see 296023) so a 9:12 AM ET, we are at a critical level so to speak 24) if 3200 does not hold the bounce here, then all expectations change25) that 3025 level should just be 3050 flat26) so this means that Friday floor is 3140 27) this results in "the long way to 2960" 28) and ONLY IF 3125 breaks late May or 29) very early in June7:28 AM, 5-16, here is what it looked like 5 hours ago:1) in chart above, price is saying that 3140 holds but the first bounce ... 2) will get sold to 3095 on Monday ahead of the third top 3) this looks a bit suspicious4) I want clarity on when 3095 gets hit 5) to call a third top 6) instead of a slower route to 3095.. 7) follpwed by hard bounce but 8) resolve by a a crush to 3025 9) ultimately... the question is still 10) when to we hit 2960 11) because the 7125 target stays put 12) and the only retrace that happens 13) in 19 out of 20 scenarios 14) is 296015) counter intuitively... 16) if 2960 holds ahead of 7125 rally 17) that really means 7125 should come by February 18) that also 7125 is an ultimate high 19) for YEARS..20) in the 20th scenario, we make new high and retrace to to 30xx or 31xx 21) meaning we never hit 2960 22) and that would mean 7125 COMES IN DECEMBER4) continuing in chart above, this would make 3rd top 5) and for the record, if you scroll up about 7-8 charts 6) I discussed this route as, "THE CRAZIEST PATTERN IS THIS"... 7) because we don't have 3 descending tops 8) we have triple crown with low top in the middleSo for Sunday night into Monday NY close: 1) bulls really need 3275 by London open 2) circa 3 AM ET NY time 3) if they don't do this they have 2 more 6 hour cycles 4) to form less impressive 3rd top formations 5) but since they own the spike setup as well as long term 6) for every failure to break up is a guarantee of 2555 getting hit in June 7) especially of bears open Sunday night with a move straight to 3125 again8) do the first 10 hours after open are super critical for both sides 9) my call is 2555 in June until this changes9:51 PM ET, 3221 AFTER STALLING AT 3249.XX 1) as of RIGHT THIS SECOND bulls still own the short term setup 2) so if they don't hit 3275 in 5 hours, that's a problem 3) the move that is not obvious to see is 100 straight down from here 4) to 3125 again 5) and if they surrender this setup for 3460 6) it's really hard to see 2960 get defended a third time... 7) counting April as the first time8) and late May the second time9) long story short there's 2 moves I can see 10) it's either +55 to 3275 or 11) -95 to 3125 12) in next 5 hours13) sideways stall result is tough to call 14) but would buy bulls 12 extra hours to find a way to 346010) continuing in chart above, the "implied blue route" is:11) so in chart above, my read is that bulls do not have enough to make it this time 12) yesterday, I said that the first 10 hours were super important for both sides 13) that means until 3 AM ET, and if bulls do not make it to 3275 AND PRICE STALLS 14) bulls would buy TWO MORE 6 HOUR CYCLES or ... 15) to 9 AM ET and then 3 PM ET, we have already finished the first one 16) and it's 10:14 AM ET as I type 17) so technically, bulls have 5 more hours to attempt this break of the black dashed line 18) so be aware of that 19) but I also said yesterday that with each failure of this break out (which means move to 3470 now) 20) this means 2555 in June... and why? 21) it is simply a "reinforcing this dashed line down as the total resistance 22) because bulls "basically" have a perfect setup for 3470 now 23) not moving here would simply mean there's no more demand 24) and the only way is down25) and that move would start with 3060 before Thursday 26) in other words, by Wed night or Tokyo session8:30 AM ET 3242.XX AND HEADING FOR 3275-32901) and by extension 3460 2) last 5.5 hours saw bulls took basically perfect setup to perfect 3) which does 3 things 4) one, break that dashed line 5) two, reverse a perfect bear setup 6) three, RAISE THE 3460 ceiling6) in chart above, I don't know what happens here with the trends that form the bear route 7) because they have to get resolved 8) there two ways to resolve them 9) the first is completely vertical up10) but I cannot "call that", you can only follow it on 1 to 4-min bars 11) because it's a continuously changing situation12) 2 thing need to happen to call price action here 13) hitting 3375 and judging first reaction to 3375 14) the rest is entirely unresolved15) cannot say when 3375 gets hit 16) can't even say if it will get hit 17) can say if it gets hit, it would be Thursday or Friday, perhaps Monday 18) everything else is convoluted8) continuing in chart above, so I close this post and everything else with 9) there are 3 moves left 10) long to 3600 11) short to 3000 (because it could easily be 3650 high) 12) long to 7250 13) the only part left that I see there is wiggle room is that 14) in theory, bulls can't break red line until next week 15) that means that even though 3375 CAN GET HIT this week 16) it would be rejected for retest which is probably 3250 17) before moving up to 3400 18) in this window, if bulls are not strong 19) then bears can push the move down like this, but NOT MUCH:20) but let's go over that anyway in case it happens 21) if 3500 is the top in, then THE FLOOR IS 2875 OR HIGHER 22) and should come in June or August more like this:23) that's all I got and I am done with paying for the right to write about it 24) the end3:11 PM ET, so let's sum this up right now because I am really done writing more about this:1) I see silver breaking out as gold moves up 2) along with that, I don't know that this stops at 36xx 3) if I am being honest, I have to say 3820 4) because I misread the October check down 5) I can't see it hitting ANYTHING UNDER 3100 6) so that basically means that it is going to be 38xx with the next floor at 3140+++ 7) this also means that whatever high is coming next year, it's going to be above 7500 8) end of this story5/22 NO CALL:1) in chart above is silvers perfect arc for 15 years 2) and what does it say? a) this rally will last for a min of 30 more months b) a maximum of 8 years c) ball park is 5.5 years or end of year 2030 d) with the final high range from 450 to 1450 e) the likely high under $685 f) meaning the call should be $683 by DEC 2030 g) the problem is the window from here to THIS OCTOBER h) specifically before 08/09 with max vol i) about $26.653) no one is debating the ultimate path of precious metals 4) the problem is gold vs silver 5) the 15 year arcs vs gold 45 year trend line 6) I cannot explain why silver did not hit a new high when gold hit 35007) 3 month normal vol says silver can break this arc before September8) what does this all mean? a) before gold and silver head to their ultimate destination b) there must be a transition period that c) occurs where silver strength surpasses gold strength d) and what happens immediately before this e) is when silver weakness WEAKENS more vs gold f ) meaning that there must be a correction from here to JANUARY 2026 g) where silver corrects LESS THAN GOLD corrects9:57 AM ET that does not solve what happens from here to July because 1) there are two scenarios both legitimate 2) first one is rally to July and correct hard to October 3) meaning one more high 3760 or higher with a silver breakout 4) the second is continue correcting until a bottom in July or August 5) but the technicals do not reveal anything hence the no call 6) what we do know is decision comes next week 7) and I've already discussed what that looks like 8) this is the end of the road for me 9) good luck to you and thanks for reading06/03/2025, FOR ALL THE PEOPLE THAT KEPT COMING BACK DESPITE ME NOT UPDATING THIS: 1) first, in notes above at "3) meaning one more high 3760 or higher with a silver breakout" ... 2) that is where we are 3) but to restart this work with a more sustainable approach ... 4) here is my next post before things get really interesting:5) chart above is a comparison between gold and silver price action, all-timme 6) I will continue there
Binary_Forecasting_Service

This continues directly from post #12. Considering what is happening in S&P 500 as well as silver, this should be the favorite right now with 46xx ceiling in April of 2026. Second place is 2960-3160 floor with 5000+ ceiling. I just do not see how we move "massively up" without some kind of wipe out in this window. As usual, I will add as we go. But be aware that I am very short on time and just because I see something does not mean I have time to write about it. SO USE THIS POST WITH CAUTION. To sum it up, moving to 3500 this way puts a top in. There are fluctuating odds for a 3550 high which very well may happen in the following 3 days. Whatever the case maybe, it is my view that 3165 will become RESISTANCE by mid-May prior to sharp leg down to 2565 in June and maybe a second time in July. The red line breaking is signal for entry for 4600.04/22/25, 1:30 PM ET, 3400.XX after 3376 low BUT AFTER 3500 HIGH: 1) so odds really favor "top in" but ....' 2) simultaneously favor one, or even two more tops to unwind the daily/weekly trends 3) after that gets un-winded, the first target should really be 3075 4) I have a lot I want to add about SPX, silver, etc.... 5) but I do not have any time, so take it or leave it 6) have a good one4:19 PM ET, there are 2 routes down .... 7) it's not obvious which one will play... 8) so... here are the differences9) so... I don't see how bears can take out 3315 10) this almost guarantees one more HIGHER high... 11) in any case, we need 3 highs that will stretch into first week of May 12) which PUSHES THE 2565 CHECK INTO MID JUNE13) TYPO.. MID JULY... 14) so this likely means 3585-3607 IS STILL IN PLAY5:58 PM ET, NOPE... I just proved the retrace is very unlikely to be more than 300 1) so what do we have now? 2) we have nothing ... NOTHING! 3) this is what is knowable: a) first, this "top" is not obvious yet until it has 3 OR 4 tops b) its ceiling is 3585-3607 AND IT DOES NOT HAVE TO HIT IT c) so that helps none d) and once top is "recognized" e) a complete retrace would be 275, 280 draw down f) anything higher is not likely g) this means that price is aiming 5000-5500 for February high h) so this post is dead immediatelyOrdinary-Human , we just gaped down to 3315 and it's not going anywhere bc:4/22, 8:21 PM ET, if we play fair with the patterns... a) it's 3340.59 as I type b) this "900 point retrace" is alive c) but it needs price to 3265 by NY tomorrow d) to keep the odds realistic e) I do not think 3295 is enough1) in chart above, ignore everything except black route 2) we are in a very particular setup that does NOT ADD UP 3) so we can only go one step at a time 4) right now the door is open for 3265 5) this is extremely important bc it will keep all bear routes live 6) miss this window and the hard floor rises from to 2585 to... 7) everything under 3165 as very very unlikely8) but if bears make it to 3265 soon 9) they can hit 3165 by Thurs in London 10) which keeps all options for bears alive4:48 PM, 4/23 current look:10:37 PM ... CANNOT EXPLAIN SILVER RIGHT NOW 1) so I don't have a valid view 2) the end1) so it's 10:08 AM ET 4/24 2) bears have missed the first window for 3165 3) bears have missed second window for 3205 4) and price is barely leaning red outcomes 5) black is current extrapolation 6) while I have doubts rising in silver and sp500 7) to keep odds favoring bear outcome to 2565 8) we need to see 3205 9) we need to see statistically respectable ... 10) route to 3165 and 3075 11) other wise something else is going to happen 12) and honestly I can't add it all up13) in chart above, that's not the same as saying... 14) I forecast silver to 26 15) because while gold dropped 7% 16) silver actually bounced up at the end 17) this is why I don't have a valid view10:15 PM SUN, 04/27/25 I HAVE A VALID VIEW 1) but let's see 3205, 3165, and 3075 first 2) the speed to these targets determine the violence .... 3) from here to late June or early July4) the critical part is through first 3 weeks of May 5) the live target is actually 2450... 6) but that seems so crazy to me 7) but that's what a liquidity crisis would produce 8) a rush for dollars9) for those that think gold can't move like that 10) go look at January 1980 11) when gold hit its high and dropped 30% in a week 12) I am not saying gold will be at 2450 by May 21st 13) I am saying that is my max pain for liquidity crisis scenario10:19 AM , 4/28 short term chart says retest of 3500 first... 1) this will kill the clock and set hard floor for May at 3225 2) probably enough to eliminate all medium term bear scenarios under 3165 as well 3) this is the end for this post11:19 PM, 3309.XX its not over until it's over... a) I don't know how to call this part b) so I will just say what I was seeing c) I saw a setup for 3517-3525 this morning d) that was playing out until the last 3 hours or so e) bulls are surrendering their breakout posture f) so it looks like 3205 is still on the table this weekg) I am not saying it's favored h) I am saying bear case has not been eliminated4/30, 4:06 PM, NY CLOSE 3296 AND NOW .... 1) FAVORED FOR 3205-3165 move once again 2) and 900 drop to late June or very early July 3) is still very much alive1) in chart above, the way this moved down.. 2) has opened up several bullish setups that 3) were not previously obvious 4) it's hard to say that those bull routes 5) are not favorites unless we start with a direct move 6) to 31207) 11:15 PM right after 3230... 8) the window for 3130 or 100 down is effing wide open 9) but only for about 12-15 hours 10) and bears have to press their advantage here 11) miss this window and it will get VERY annoying.... 12) it becomes really complicated13) price action is only interesting IF THERE IS ACTION 14) I really don't want to get into 3 months of sideways15) and remember that (while you Google India Pakistan news...) 16) Friday is NFP and Wed is FOMC 17) with whispers of a FED CUT6.45 PM FRIDAY 05.02, I think we have to go back to 3410‐3440. 1) it is hard to see this move meaningfully lower 2) so the next week should be a move for 34xx 3) it should be sideways to FOMC 3200-3220 again 4) then all at once post FOMC WED and THUR12:00 AM, TUES, 05/06 AFTER 3386.XX and trading at 3360.xx 1) first, the short term ceiling has dropped to 3404.xx 2) but we are at a VERY CRITICAL AREA OF TIME-PRICE 3) where despite silvers continuing weakness...7:30 AM and 3380s again... 4) didn't get a chance to finish my thoughts 5) but doing this part time is not worth doing 6) so until our paths meet again, have a good life1:35 PM ET, 05/06, FOR WHAT IT'S WORTH W/ PRICE AT 3415.xx 1) so price hit that 3410-3440 zone I quoted over the weekend 2) but the speed of which it made it here means price needs a higher high 3) minimum 3645 off the top of my head, extensions to 3770 and of course, original target 3850 4) all of this before 5/27 5) not at all obvious to me what happens after that 6) becareful out there and have a good week7) by the way if I had to choose price/time target, it would be 3760 ON OR BEFORE 5/24 (not 5/14, corrected typo) 8) and this has to be some kind of a top, but intermediate floor would rise to 3300-ish5/6, ,3:06 PM, NO.. .THAT'S NOT TRUE... 1) because this setup is riding on a strong reaction to FOMC tomorrow 2) while that is one of the possible scenarios, it is not obvious that it's the favorite 3) nothing can evaluated until after FOMC4) I just cannot do this on so little time 5) so the coming 8 hours is pretty critical bc this move is still live:4:40 PM, there's just not enough time to do this right. Good bye.5:41 PM, It's setting up for 6000-7000 by March 2026. 1) so before Tokyo closes tonight, if 3400s hold... 2) that will kill the outcome above for move to 3000 floor 3) that means in May we move for 3755-3850 ish 4) that means 6000-7000 will come in spring of 2026 5) HOWEVER 6) the question is what will the correction be after 3800s? 7) I just don't have enough time8) in chart above, this is what is being decided from here to FOMC 9) bears are not dead, they can still drop this bounce 100 points ahead of Fed meeting 20 hours from now 10) but even at 3333 tomorrow IF IT HITS...Closing this adventure in style:1) chart above is link to my last post 2) enjoy!
Binary_Forecasting_Service

All the details necessary to understand this draft, I have written in closing notes of DRAFT #11 (previous draft). On an ALL TIME BASIS, it's not obvious top is in. However, the record high volumes (across all markets, or otherwise understood as cross-market volatility) has me convinced that top is in and we are going down to 2163 BY SEPTEMBER 26TH. All that said, price MUST STILL RESOLVE THE ABSOLUTELY BULLISH POSTURE BY FOLLOWING RED ROUTE IN CHART ABOVE with 2 outstanding requirements: 1) make it down to 2975 or less (as deep as UNDER 2955) by London open on Tuesday 2) make it back up to 3115 or more ( as high as 3131) by London open on Wednesday At this point, it IS STILL NOT OBVIOUS PRICE WILL WILL GO DOWN, but that's enough to resolve the 2-way vol for a crushing 550 point drop to 2580 (3130-2580=550) BY NEW YORK SESSION ON MONDAY APRIL 28TH. AS USUAL, WILL ADD MORE WITH TIME.9:55 PM ET, for the record... 1) SP 500 topped first on 2/19 and is now in bear market 2) has not filled the gap down despite gold now above Fri close 3) and gold topped 4/2 4) so what is obvious ??? 5) spx trend still DOMINATING6) so I feel pretty good about this thesis 7) with two things worth saying: A) IF THERE IS A DOWN SHIFT, that means FASTER TO FLOOR B) June is already at 2400, faster MEANS JUNE BOTTOM8) which was basically this route before... 9) I changed it to September 10) what that also means full recovery by 11) end of year1) Rajid asked me about why I went from long to short... 2) bc spx trend was dominating 3) I have first clue that sp 500 MAY HAVE BOTTOMED 4) so what does that mean? 5) blue route to 37776) but THIS IS DEPENDENT ON SPX CALMING DOWN 7) I have 1st clue only, NOT SOLID EVIDENCE 8) so be aware04/08 - 8:06 AM ET. Much was revealed yesterday between VIX, ES, GC and by extension SI. 1) will write a lot today to update everything 2) dont have time for another 2 hours 3) but basically, VIX-gold rejected by dollar liquidity requirements 4) so we are AN EVEN MORE BEARISH RED ROUTE TO JUNE 5) and time is almost out for bulls to change this 6) bc all likely bull routes are dead except one4) so the drafted blue hi-lights were in anticipation of a market-wide bounce 5) THAT IS OBVIOUSLY NOT WHAT WE HAVE:6) chart above left side is gold that has rejected blue route 7) and the 3115-3131 ceiling now looks like 3072 AT BEST 8) AND IT'S NOT AT ALL OBVIOUS THAT PRICE CAN GET ABOVE 3037 9) meanwhile, SPX trades 5288 OR 9.44 % OFF THE LOW STILL UNDER 5400 limit 10) that price needs to get furiously above to destroy the super bearish setup 11) gold is trading 3013 as is PAST DUE FOR ITS BOUNCE UP 12) meaning as of right now, there's simply no reason at all to expect gold to 13) turn bullishly and get out of this crash setup to June 14) SURE VIX 60 is good for a bottom in the S&P 500, but that's A BOTTOM, NOT THE BOTTOM 15) there's no evidence yet to say that this 9.4% bounce is anything more than a technical bounce16) in chart above, this idea that VIX 60 means we are in the clear? 17) I need to see SP 500 above 5500, AND HOLD TO MAY 18) to take this idea seriously 19) so after thorough examination of what has happened 20) the base case looked like where I go to at the near the end of DRAFT 11 21) that is gold furious crash to mid June22) I am out of time to comment a lot on silver 23) so let me say this, there's 4 levels silver is aiming for 24) $21, $18, and $14.40 are the most obvious 25) under 14.40 I cannot see how $11.55 COVID LOW CAN HOLD 26) and that means $9.20 silver 27) whatever it's going to be, I only have enough time to focus on gold and comment on S&P 500 28) I will pick up silver when it needs to be picked to up 29) AND NOW IS NOT THE TIMEON THE OTHER HAND.... 1) I just started new work I accepted last week 2) despite the important situation happening in financial markets 3) I could care less because interest in my work is not growing 4) so with each passing day, I do not have reasons to keep this up 5) so if you are reading this and interested in my work 6) join my group and tell how to continue doing this 7) have a good one12:04 PM ET, so that bounce doesn't seem like it's coign 1) so in chart above it's not going to look like that 2) I think more like this, I am just not done with drafting:12:37 PM ET, it looks like STRAIGHT TO 2790 from here 3) that's what I see 4) I have no time to add any more3:51 PM TUESDAY WRAP UP, WHERE WE ARE NOW: 1) so red route in chart at top is DRAFT 12 you are reading... 2) with SEPTEMBER LOW was reasonable route 3) when I first drafted, I drafted it in black here from notes in DRAFT 11:4) we are much closer to original draft only except worse:5) in chart above there are five arrows 6) we are at first arrow, the break of 2950 7) which leads to 2780 THIS TIME NEXT WEEK 8) that's the second arrow arrow which will slow the move for a bit 9) before heading for what should be 2400-2500 10) somewhere in there, so let's just say 2450, bc 2400 seems a bit deep 11) and that by MAY 7TH, and today is APRIL 8TH 12) that's a wrap13) in the meantime, S&P500 has surrendered 300 points since the 5310+ high this morning 14) now trading 5010-ish as I type15) 7:42 PM ET, I am not sure it will take that long 16) I do not have good reasons why it's not this week17) meanwhile gold trades 2973 in Tokyo as I type 18) and the last bull route is disappearing right now 19) especially if bears make it under 29526:43 AM so with treasury market signaling liquidation 1) everything screams incoming liquidity crisis 2) but price is spending too much time above 3037 3) the next move should be drop under 2920 4) but bears only have about 6 hours before odds go to 50/50 5) between crash and sideways for 2-3 days6) if I read everything together, the call is incoming crash 7) but price has to respect trend, so above 3055 means wait it out12:35 PM, I don't have enough time to do this right. 1) there's several diametrically opposite things going on 2) and I can't call this right doing it part time 3) and full time service will not come close to my earnings 4) so the right thing to do is to stop 5) but let's wrap this up right1) replay chart at top 2) it's still a weaker red04/09, 12:41 AM, 3122.65 after scratching 3131...1) I'm going to give you my entire thoughts on this 2) but first replay chart at top 3) AND THEN READ THE INTRO including the first chart after I said "will add with time" 4) be aware that SPX is trading 5450-ish as I type with another furious spike today after 5) Trump's 90-day extension whatever+125% China tariffs 6) and please be aware of what this means vs what Trump is trying to do 7) ultimately there are two outcomes here and they are both in chart at top 8) and I do not know how to call this because the last two surprise moves 9) both originated from Trump himself 10) and ultimately I can only call it if I dedicate myself fulltime 11) and that I cannot do because my time has been bought and paid for12) but what can be said is that if bear route is true, it MUST BE STRAIGHT DOWN FROM HERE 13) because bears have fulfilled the two conditions I named in chart at top 14) so they are totally setup for their move down but must move soon 15) long story short, if they are going to do it, it should be entirely obvious 16) and run along red route in chart at top down before exceeding it 17) the other outcome is blue route in chart at top 18) and starts out as I illustrated in the beginning of the notes19) pretty much in a day or two, this will be settled12:06 AM ET 04-12-25, WHAT NOW? 1) if you remember, our very first target for 4-11 high 2) was 3250 area before getting moved up and down 3) so what now? 4) we are in a liquidity crisis 5) but gold has not completed its structure 6) and it's blowing off vertically 7) because it doesn't have any time left 8) so what finishes a blow off? 9) a blow off's blow off is my only idea here 10) you have to look at the 5 year chart to get what I mean 11) there are no logical moves here except wave completion 12) which means 300 more 13) so? 14) 3500-3550 15) but the tops top must be the fastest 16) so we go 300 from Tues night to Friday 17) that means the top should be THIS COMING TUESDAY18) but this route requires breaking 3251 quickly and convincingly 19) there cannot be stalling in this area 20) why? 21) because price does not jump 10% in 3 days and then stall22) stalling would mean retest of 3165 and it would get very ugly soon after 23) all these calls of gold to the sky... 24) zoom out to 10 year chart, it's already AT THE SKY 25) so be awareSunday, 4/13, 5:35 PM ET, I have really strong conviction that price has 2 weeks to top. 1) the singular question here is how high 2) it's 3251-3607, favoring 3440-3570 3) the quickest top would be TODAY, followed by Tuesday 4) if a top is not obvious by Tuesday 5) then the next date would be Sunday 4/276) the specific levels of this top are 3250, 3380, 3480, and 3580 7) with none being specifically favorable 8) we just go one by one 9) so in 4 days we know if it's 3251 or HIGHER04/13/25, 9:09 PM ET, 3220.XX and I have it solved... a) there are two things going on b) first, there IS A LIQUIDITY PROBLEM, this we know c) but size definitely matters d) second, this TOTAL bifurcation of U.S.-China trade e) is going to unleash gargantuan inflation globally, but no doubt concentration in USD f) and recession odds rises ALONG WITH A DISCUSSION OF HYPERINFLATION g) so?h) THERE IS GOING TO BE A TOP BY 4/28 i) but it's not THE top j) WHATEVER THE SELL OFF AFTER THAT MAYBEk) a while ago, when price broke straight through 2790... j) I had written about several different outcomes k) the VERY FIRST of which was 4900, or 46xx-51xx l) AT NO TIME DID I EVER TAKE IT SERIOUSLY m) because every time I raised targets above 3750-3850, it got shot down n) well now even UBS, Goldman, JP Morgan, the big banks all agree o) there are two ceilings 4500 is on the table end of this year or p) beginning of 2026 q) so?r) we are now in a new world, with hyperflation and liquidity breaks s) so we WILL GET GIANT RALLIES t) but 2-way vol will also explode u) meaning? 200-300 point swings is par for the course v) good luck!x) and oh yeah, a call for MAY 9TH high? y) 3600 on 5/09/25 z) but that's ONLY HALF WAY ...9:57 PM ET... so my high ceiling for FEB 2026 was 5400 but let's call it right now.. 1) 5555 by valentines day 2026 2) this target solves all the patterns of this rally 3) and more importantly, THE FUNDAMENTALS SUPPORT IT11:40 PM ET, 04/13, let's wrap this up: 1) so MAY 2 is NFP 2) and MAY 7 is FOMC 3) so PRE-MAY 7 HIGH is capped 3420 because .... 4) odds do not favor a super strong trend to crush both those events 5) what this means is that the big banks have it right 4500 end of year 6) but my call of 5555 gets cut to 5000 by Valentine's Day 2026 7) that's a wrap OF EVERYTHING HERE PERIOD 8) there's nothing more worth saying for me here or otherwise 9) and why? 10) because GLD calls equivalence for 3800 pays barely 5:1 in January 2026 11) and gold is only 3232 as I type 12) I would've thought that call would pay 100 to 200 to 1 13) that means NOBODY IS GETTING CAUGHT OFFGUARD 14) have a good life04-15-25. 10:09 ET: LIQUIDITY WARNING THIRD SCENARIO 1) there is a third scenario that currently is in play 2) that starts with a move to under 2600 or less 3) and then finishes the run to valentines day 2026 4) that would mean 2600 OR LESS BY 6.18 5) AND THEN...6) running to to 4600-4800 7) as the next rally 8) it's just not obvious when this run would actually finish 9) this has to do with current sp500 and silver position 10) this is the most difficult route to call 11) as the driver for price action would be la liquidity crisis 12) it would start would a gold move under 300013) I will add some notes soon to comment on this fluid situation 14) the question is what matters more? 15) when u.s. China decouples completely? 16) does the liquidity problems matter more? 17) especially at the edge of recession? 18) or the resulting hyperinflationary wave? 19) when both can happen simultaneously04/15/25, 11:04 AM ET, so this morning I bought late June GC puts 1) and my singular hard stop is 3252 2) while I work on this some4/15, 1:10 PM, in chart above, that's gold 4-day vs silver and s&p 500 for 6 months a) silver and spx are in the same pattern on different scales b) why I do not know... c) but the only chart is strong is gold IF GOLD SURVIVES NEXT 76 hours d) which is now to end of this Friday e) I said earlier that my stop is on this new short is 3252 f) well price has not move, but I need bears to close the door on the 3325 spike g) I'll add more when I have timeh) meanwhile:1) if it's gonna go, it has to go like that 2) with the question marks for silver (red), if shouldn't be weaker 3) and for SP 500 (blue) as well 4) I have a really hard time seeing gold saving the day here 5) it's bear curve is not quite as steep as I thought earlier but 6) not that much different:9:22 PM ET, 04.16.25, THIS I POSTED AT THE BEGINNING: 1) so chart above vs... 2) what happened in chart below3) so we took the long way to 3350 zone 4) bc that blue route had it several days faster 5) so what now? 6) now comes the decision for WHICH TOP WE GET... 7) the leading outcomes are 3770 and 4850 8) if we drop hard to 3100 from here 9) then it's going to be 4850, but considering runaway zone 10) 4850 means 4800 to 510011) that means that the MOST BULLISH move here is.... 12) counterintuitive as a 250 pt drop 13) meanwhile, continuing up from here means 3570-3770 14) probably favoring the high end close to 380015) meanwhile, the current MAY high is 3585 16) with RIDICULOUS 2-WAY VOL17) but the next move should be rollover down 18) silver and spx still looks like it wants to die 19) gold just doesn't care YET... 20) but if spx retests the previous floor 21) gold may have to check 3070 before 358522) 11:30 PM I get how to explain this 23) there are two versions of this top 24) a 3600 top and a 4800 top 25) if 3600 is THE TOP, then ... 26) 3200 must hold the retrace and April must see 3450 27) then 3600 would come in May 28) the other scenario involves a retrace of 29) 250-300 points and sideways for 50-60 days before moving for 480010:04 AM ET 04-17-25, This is last chart I posted for coming time frame w/in 36 hours:1) the route closest to current trends IS SOME VERSION OF BLUE... 2) as a setup for 4725 high 3) I am working on it with spare time5:13 AM, 4/21, I don't have anything to add because I haven't had any time. 1) here is what I can say 2) sp 500 is still following bearish outcome 3) silver is not moving meaningfully and has diverged with gold 4) in a BIG way 5) and past 3420, the only level to watch is 3585-3610 6) but going there next ..like next couple of days 7) is going to create a giant question mark for 8) where EVERYTHING is headed nextAND THIS POST HAS ENDED, HERE IS #12B:
Binary_Forecasting_Service

As stated last night, DRAFT 10B would invalidate in 12 hours. This is what this looks like now, with the 4/11 ceiling now lower. Let's get this up and I'll add notes. YOU CAN GIVE ME A REASON TO KEEP FORECASTING - I need a reason to keep doing this - and what I need is attention for my work - so let's make a trade right now - a lot of my time for just a little bit of yours - I will continue to write and and update - as long as views for my work increase on a daily basis - all you have to do each day - is spread the word to another trader that you know - this is the only way I see this working out - so if you are reading this - please keep that in mind1) so at 10:27 AM ET in chart above... 2) there has been no stalling like blue route 3) which means bulls have ASIX HOUR WINDOW FROM NOW TO NY AFTERMARKET 4) so about 6.5 hours as I type at 10:28 AM ET 5) to hit new all time high at 3175 6) meaning low 3050 to high 3175 IN THE SAME SESSION7) SO UNLESS price stalls out like blue route 8) BASE CASE IS 3173 TODAY 9) the problem is that this route (in red in chart above) 10) DOES NOT LOOK LIKE YELLOW OR BLUE 11) but 2 things can be said about this new red route A) the 4/11-4/13 ceiling DOES NOT DROP FROM FROM 3325-3368 B) and is likely to involve HIGHER DAILY 2-WAY VOL (meaning a lot of zig zag)12) so by the end of today's NY session in 6.5 hours, this DRAFT 11 maybe very well be useless4/3, 1:43 PM ET, 3106.XX, so as of RIGHT NOW... 13) red route is under 16:1, so basically eliminated 14) but I am careful to not say eliminated because 15) this run up has had a history of making the move the LITERAL LAST HOUR 16) and if you've followed my posts, have done this SEVERAL TIMES! 17) so with that in mind, a STRONGER BLUE ROUTE (meaning like blue, but stronger) ... 18) is now leading all outcomes3:23 PM ET, 3110.XX, COMMENTARY ON S&P500... 1) it should be obvious now that the only market that is going up any more for this summer 2) is gold 3) and while gold moves for 3400 and what I think is 3965 4) and for the record, I reserve the right to lower this 3965 to 3777 5) the S&P 500 (and by extension ALL MAJOR INDEXES) will setup for a major (but brief) bear market 6) FWIW it looks like this to me:3:43 PM ET, I'm busy for the rest of today so AS A WARNING BECAUSE EVERYTHING ELSE NOT GOLD IS SO DAMN BEARISH... 1) in chart above, I really don't think stocks can "crash without a kiss of death setup" 2) considering where we are with all time vs all trend chart 3) but in case I am wrong about that and the world wants to start going to hell today.... 4) THAT WOULD START BY GOLD HOLDING UNDER 3100 REST OF TODAY LIKE THIS:5:28 PM FORGOT TO POST THIS:5:29 PM, BUT BY NOW:8:31 PM ET... 3108.5... TOO MUCH STALLING, TIME OUT 1) I gotta get in a car 2) cannot analyze right now to see what's going to happen here3) BUT UNDER 3110 IS A PROBLEM FOR THIS SETUP1) so at 8:42 AM ET, 04/04/25, here's what is happening 2) first I strongly believe in my thesis of a "kiss of death coming for S&p 500" 3) meanwhile if you play chart at top, gold IS LATE FOR BLUE ROUTE 4) what this is saying is that my 12-month basis... 5) generically speaking, a major gold top, followed by 1000-1300 pts retrace 6) is shaping up not only in gold, but through examination of cross-market volatily 7) however, equity weakness is pulling down gold strength 8) so FIRST, I no longer see a 39xx high for gold in June to August window 9) I see a 37xx-38xx high 10) and... it's not obvious that it should be one top as opposed to 2 tops 11) but IF THERE ARE GOING TO BE 2 TOPS... 12) that's going to be JUNE AND AUGUST 13) this I have strong conviction in 14) meanwhile15) in chart above, the rejection at 3135 before NFP .. 16) has locked the breakout out for next WED 17) that's all I got right now and chart above is prep work for DRAFT #124) IN CHART ABOVE, IF SP 500 GOES TO 2900 5) GOLD GOES DIRECTLY TO 21606) OR MAYBE EVEN 209004/04/25, 4:31 PM ET, SO LET'S REVIEW... 1) if you remembered in January when I published "this is the entry for 3850" 2) the first run up SHOULD NOT HAVE TAKEN OUT 2790 previous all time high 3) so when it did, my first reaction after that was price was going to retrace 1000 pts 4) there's a draft for 31xx high somewhere I will pull it up later 5) but the problem was THERE WAS NO SETUP FOR IT 6) AND THERE IS NOT ONE EVEN NOW, BUT 7) the price action today has indicated that equity bearishness is causing contagion 8) and gold surrendered a move to 3000 when it had no business moving under 3062 today so ... 9) here's what that means:10) continuing with chart above 11) how do I go to 39xx high, to 37xx, and ALL OF A SUDDEN top in? 12) and straight for 2090? 13) well the 10-20-40 year mean reversion I have previously talked about is at 2090-2180 for June 14) in other words, UNDER 2222 15) in normal price action, the waves would complete the top which would be at least 3770 16) if not 3965 or 4140 and so on... 17) but the price action today is saying that the bearishness in sp500 is bleeding 18) INTO EVERYTHING 19) the drop in the sp500 broke support in a big way 20) that is forcing VERY UNLIKELY PRICE ACTION IN GOLD 21) for example, the odds of dropping under 3062 today to 3000 or 2999? 22) for the trend setup vs Bollingers that we have 23) is WAY UNDER 1%, and probably less than .3% 24) or 1 out of every 300+ outcomes 25) AT ALL TIME HIGHS, THIS IS SCREAMING TOP IN26) and I wouldn't care if not for SPX setup being SO F-ING VERTICAL DOWN 27) so FOR THE NEXT 3 DAYS, HERE'S WHAT TO LOOK OUT FOR 28) (I won't have it up immediately, but soon)8) so I will get to post #12 ... 9) but in chart above, THAT IS NOW OUR 12 MONTH BASIS 10) with ONE OUTSTANDING ISSUE 11) it's not entirely obvious that the low will be JUNE 12) IT COULD VERY WELL BE SEPTEMBER 13) in which case it would be like this...18a) before I get to that 18b) see the blue move? and then the dashed line?? 18c) the red move is a "mirror image of the blue move" BUT 18d) ON A DOWNWARD SLOPE WITH THAT CENTER SLOPE BEING THE DASHED LINE19) final correction 20) it's going to have to be SEPTEMBER, worst case is OCTOBER 21) why? 22) gold's super long term trends too strong to allow a move under 2400 by JUNE 23) MEANING THAT BY JUNE 18TH FOMC, GOLD CAN ONLY MOVE TO 2400 give or take 24) what is at 2400 give or take? 25) THE 45-YEAR TREND LINE!!7:41 PM ET, 04/04/25, so everything said and done gold prices closes Friday at 3037.xx 1) 43 trading hours from all time high 3168 2) and only down 4.135% from all time high 3) still stronger than pretty ALL OTHER MAJOR MARKETS WITHOUT EXCEPTION 4) AND TO TAKE IT DOWN FROM HERE MUST INVOLVE... 5) THE RESOLUTION OF THE BULL MARKET SETUP 6) WHICH IS ILLUSTRATED IN CHART ABOVE 7) so that's the basis for DRAFT #12, for 12 MONTH BASIS WITH SUPER DETAILING 8) that's a wrap, have a good weekendSO DOUBLE FINALLY, HERE IS DRAFT #012:
Disclaimer
Any content and materials included in Sahmeto's website and official communication channels are a compilation of personal opinions and analyses and are not binding. They do not constitute any recommendation for buying, selling, entering or exiting the stock market and cryptocurrency market. Also, all news and analyses included in the website and channels are merely republished information from official and unofficial domestic and foreign sources, and it is obvious that users of the said content are responsible for following up and ensuring the authenticity and accuracy of the materials. Therefore, while disclaiming responsibility, it is declared that the responsibility for any decision-making, action, and potential profit and loss in the capital market and cryptocurrency market lies with the trader.