
Beyoglu_Analyst
@t_Beyoglu_Analyst

What symbols does the trader recommend buying?
Purchase History
پیام های تریدر
Filter
پیشبینی انفجاری بیت کوین: تحلیل تکنیکال و حرکت احتمالی قیمت در روزهای آینده
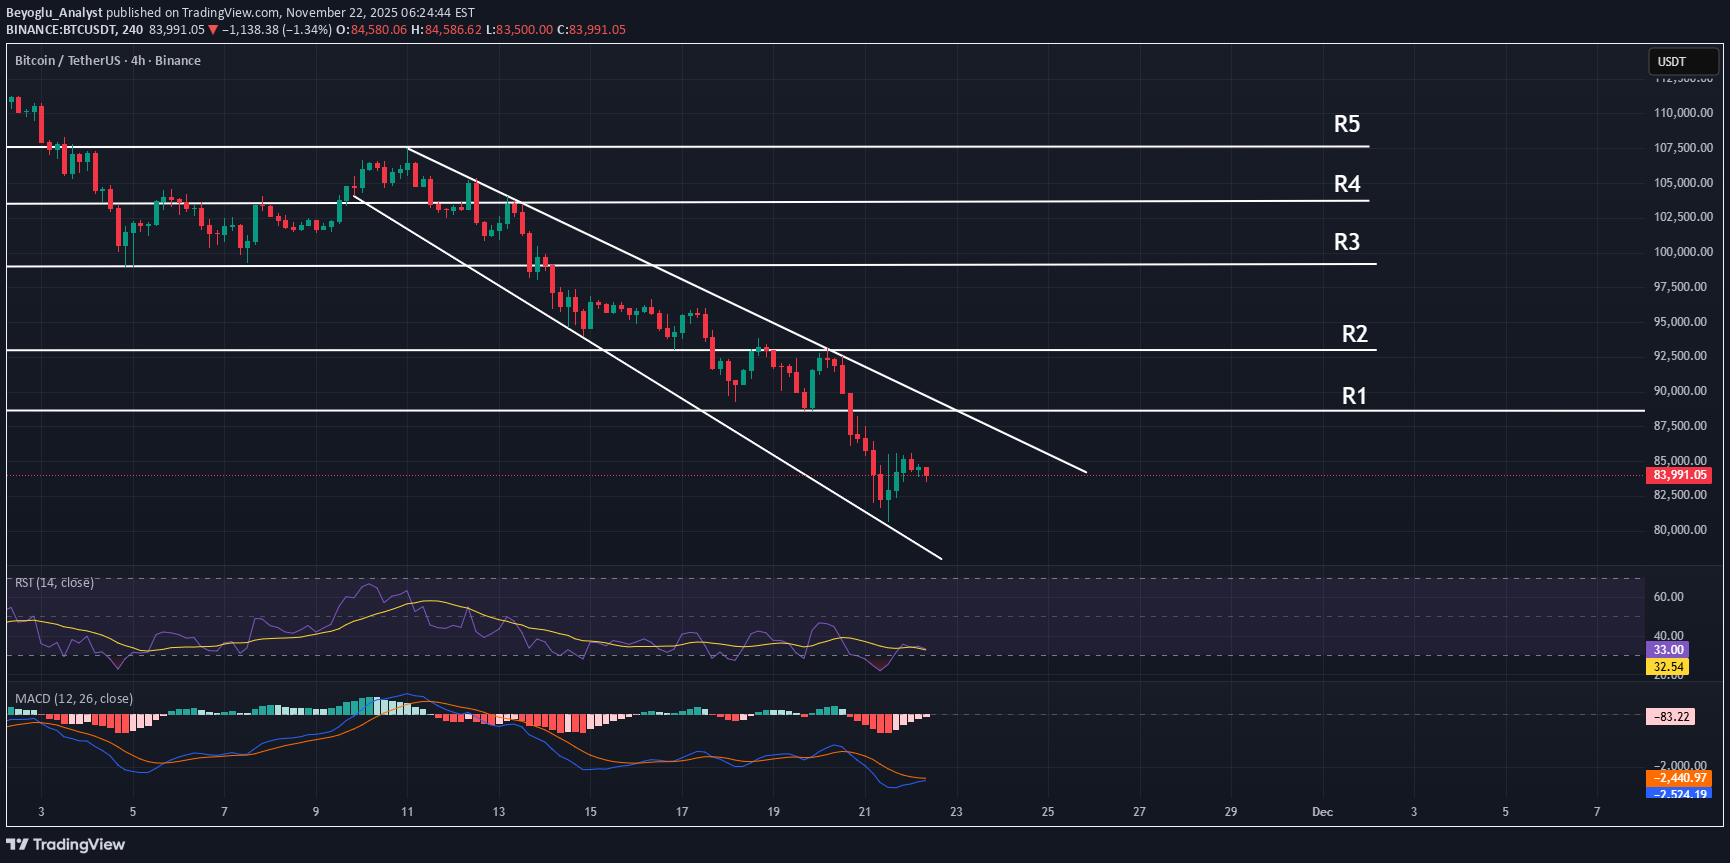
Bitcoin has formed a falling wedge chart pattern that is a bullish reversal chart pattern, Following this down trend since November 9 and has retest the support price level yesterday at $800,600. The weekend pump is really expected due to the highly over sold indication on trading indicators. The daily Relative strength Index (RSI) is at 22 in oversold zone. Moving Average Moving Average Convergence Divergence on 4hr timeframe indicating a short rally is ahead. Bitcoin can retest the resistance price level $880,000 today. however a decline from R1 can result in again fall of price near $840,000.
تحلیل تکنیکال بیت کوین: آیا $BTC به سقف $102K میرسد یا سقوط میکند؟
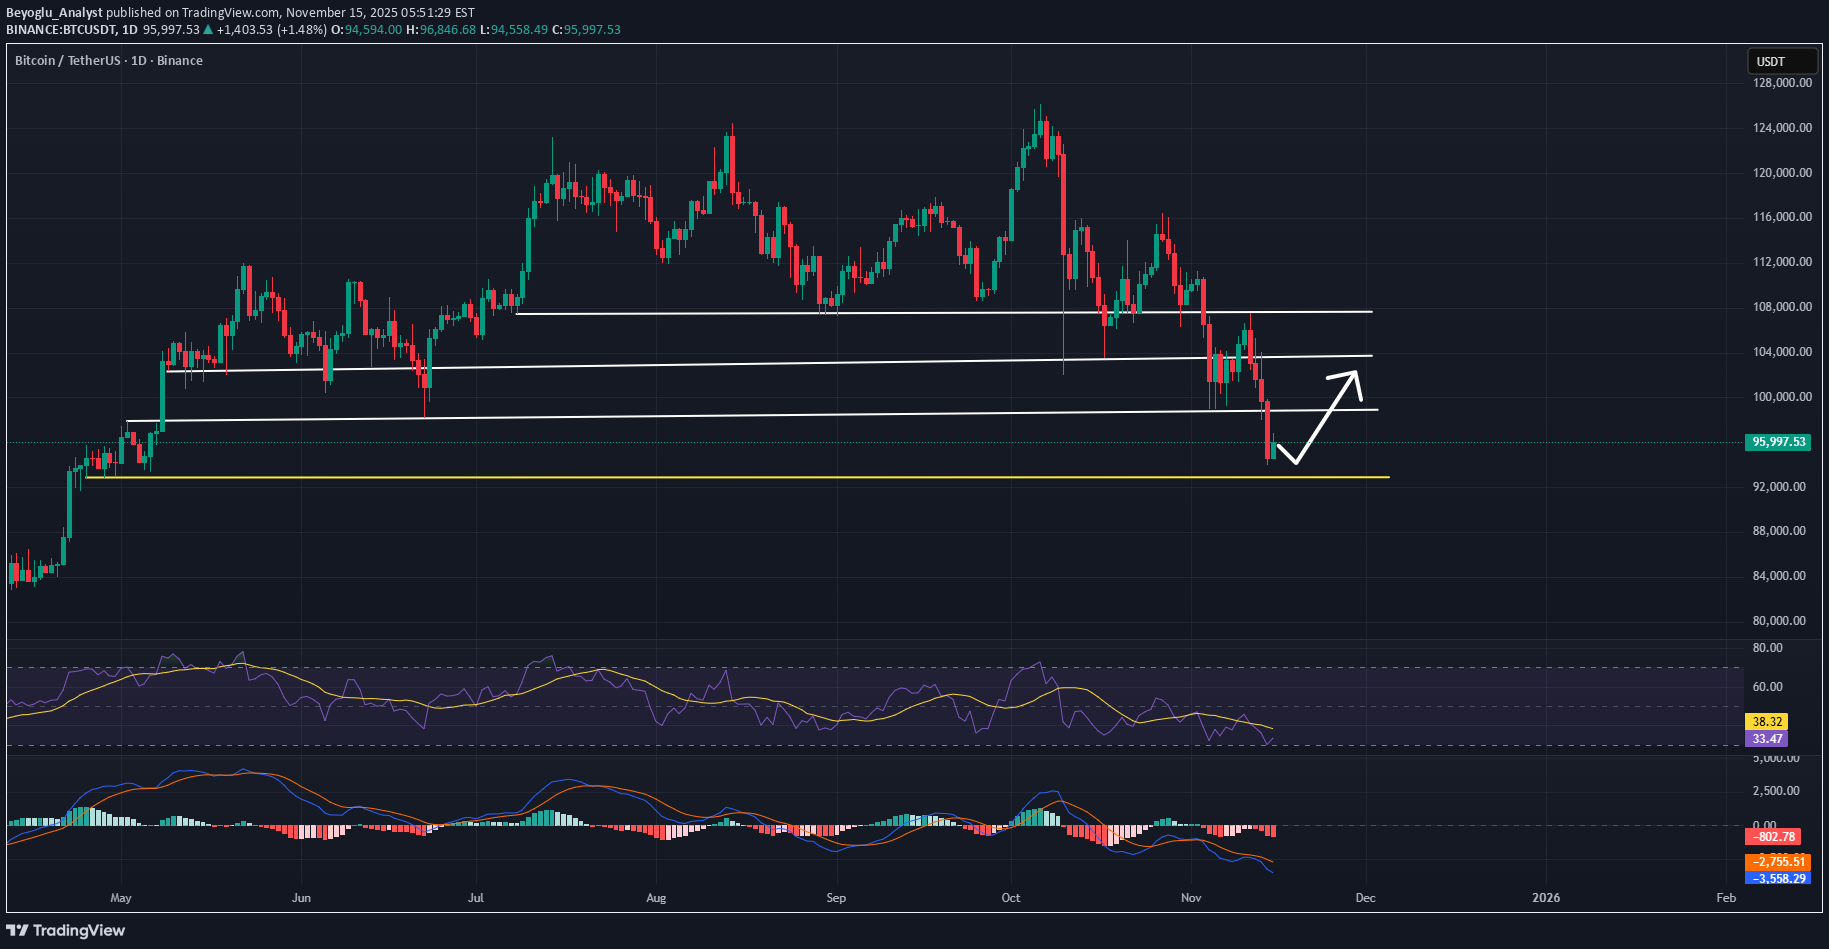
BTC made a yesterday Day closed below $94k. At the time of writing this on Saturday Bitcoin is trading near $95,800. Since last weeks bitcoin is making pump on weekend If bitcoin made a weekly close above $98k, Then Bitcoin will retest again $102k resistance. However a rejection from $98k will extend the decline again towards $92k-$93k. Relative Strength Index RSI is at 33 higher than the level of our bought, Moving average Convergence Divergence MACD is also signaling bearish momentum. Personally I think that the Bitcoin will make a heavy pullback from $92K-$93k.
تحلیل تکنیکال بیت کوین: آیا ریزش به ۹۹ هزار دلار در راه است؟ (پیشبینی قیمت BTC)
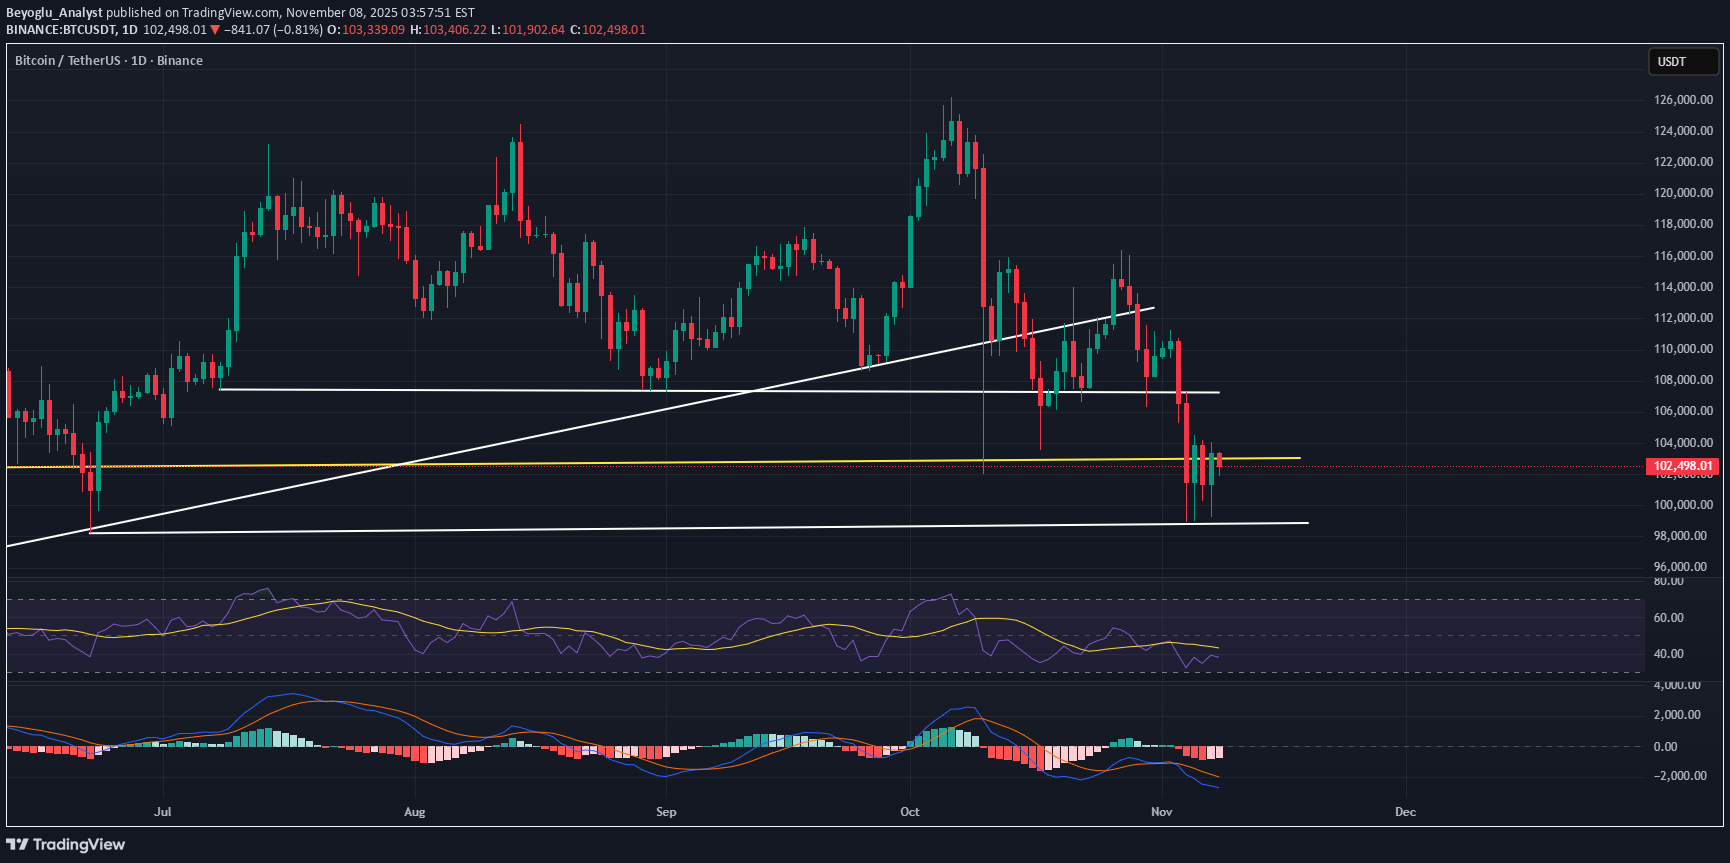
Bitcoin made another pullback from the key psychological of $99k support price level. Bitcoin is struggling to maintain its price above the resistance $104k. BTC has to make a day above this resistance to keep the bullish momentum continue. A day close above the resistance will help bitcoin to extend the rally $107K. However a day close below $104k could result in fall of the price to $99k again. Relative Strength Index RSI is at 37 low then the level of neutral indicating the bear hold in the market. Moving Average Convergence Divergence made a bearish crossover Monday forming weaker histogram indicating that bearish momentum is getting weaker. #BTC
تحلیل تکنیکال بیت کوین: آیا BTC به ۱۱۴ هزار دلار میرسد یا سقوط به ۱۰۷ هزار؟
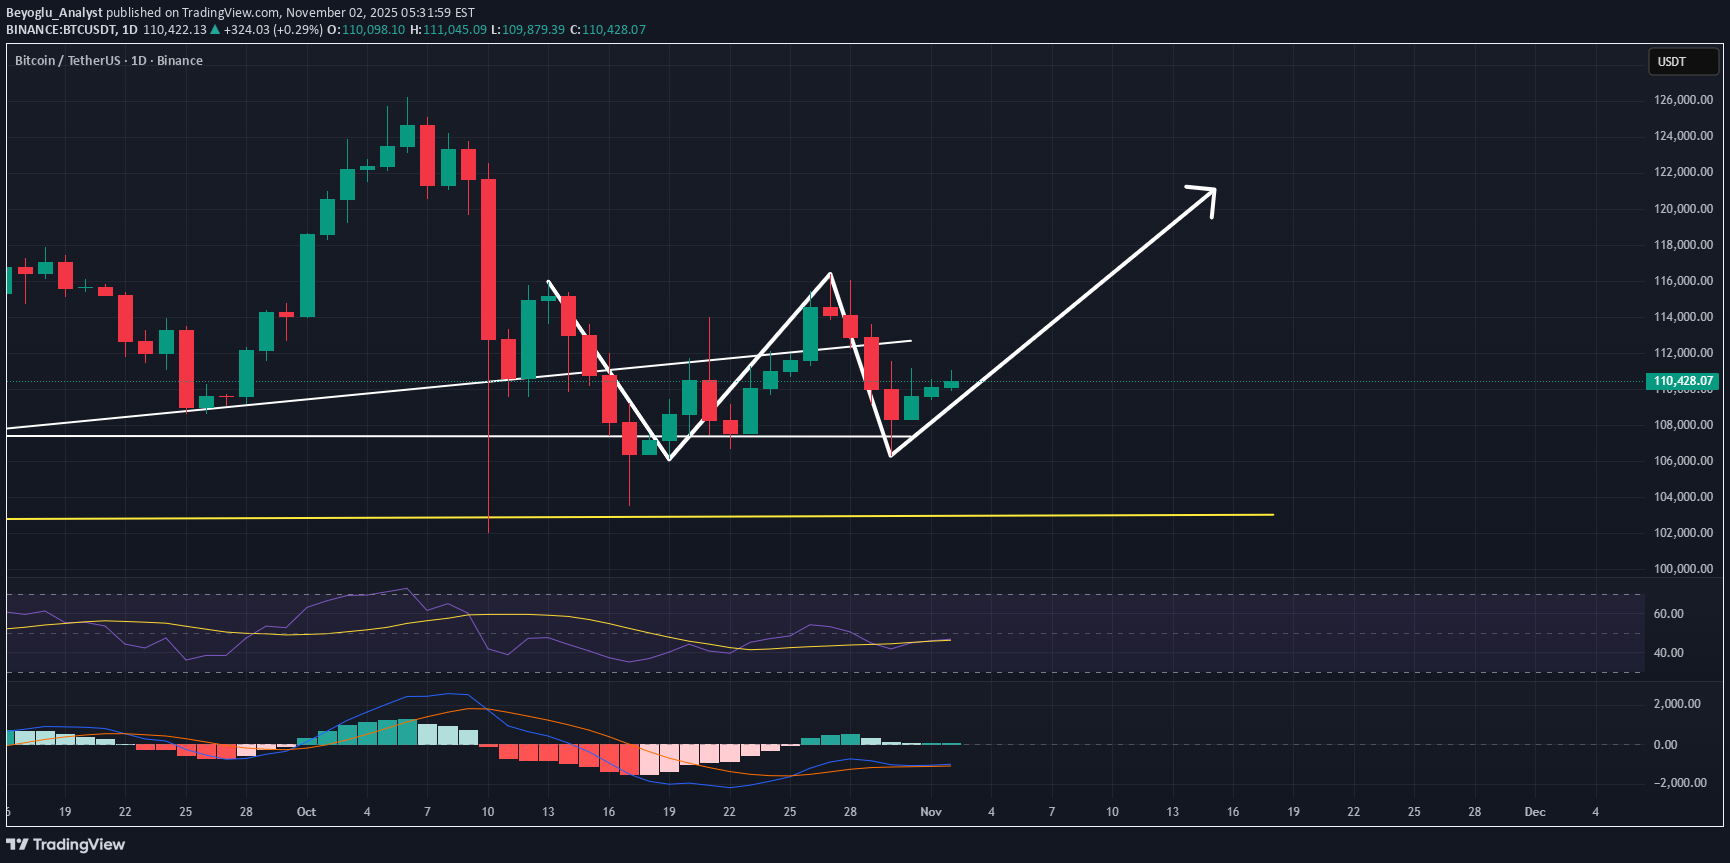
Bitcoin is making a pullback from the key psychological support level of $107,350. Bitcoin has break above the resistance price of $110,550 and made a high today at $111,045. At the time of writing this on Sunday BTC is trading at $110,693. Bitcoin Can extend the pump $114K if it will make a daily close above $110,550. However the day close below $110,550 can take down the price to $107K. Relative Strength Index RSI is at 47 below the neutral level of 50 aiming upward indicating the the bearish momentum is slowly fading away. Moving Average Convergence Divergence MACD is also making a pullback from the orange line indicating the momentum is being shift from bearish to bullish.
بیت کوین به کجا میرود؟ هشدار سقوط به ۱۰۲,۰۰۰ دلار یا فرصت صعود؟
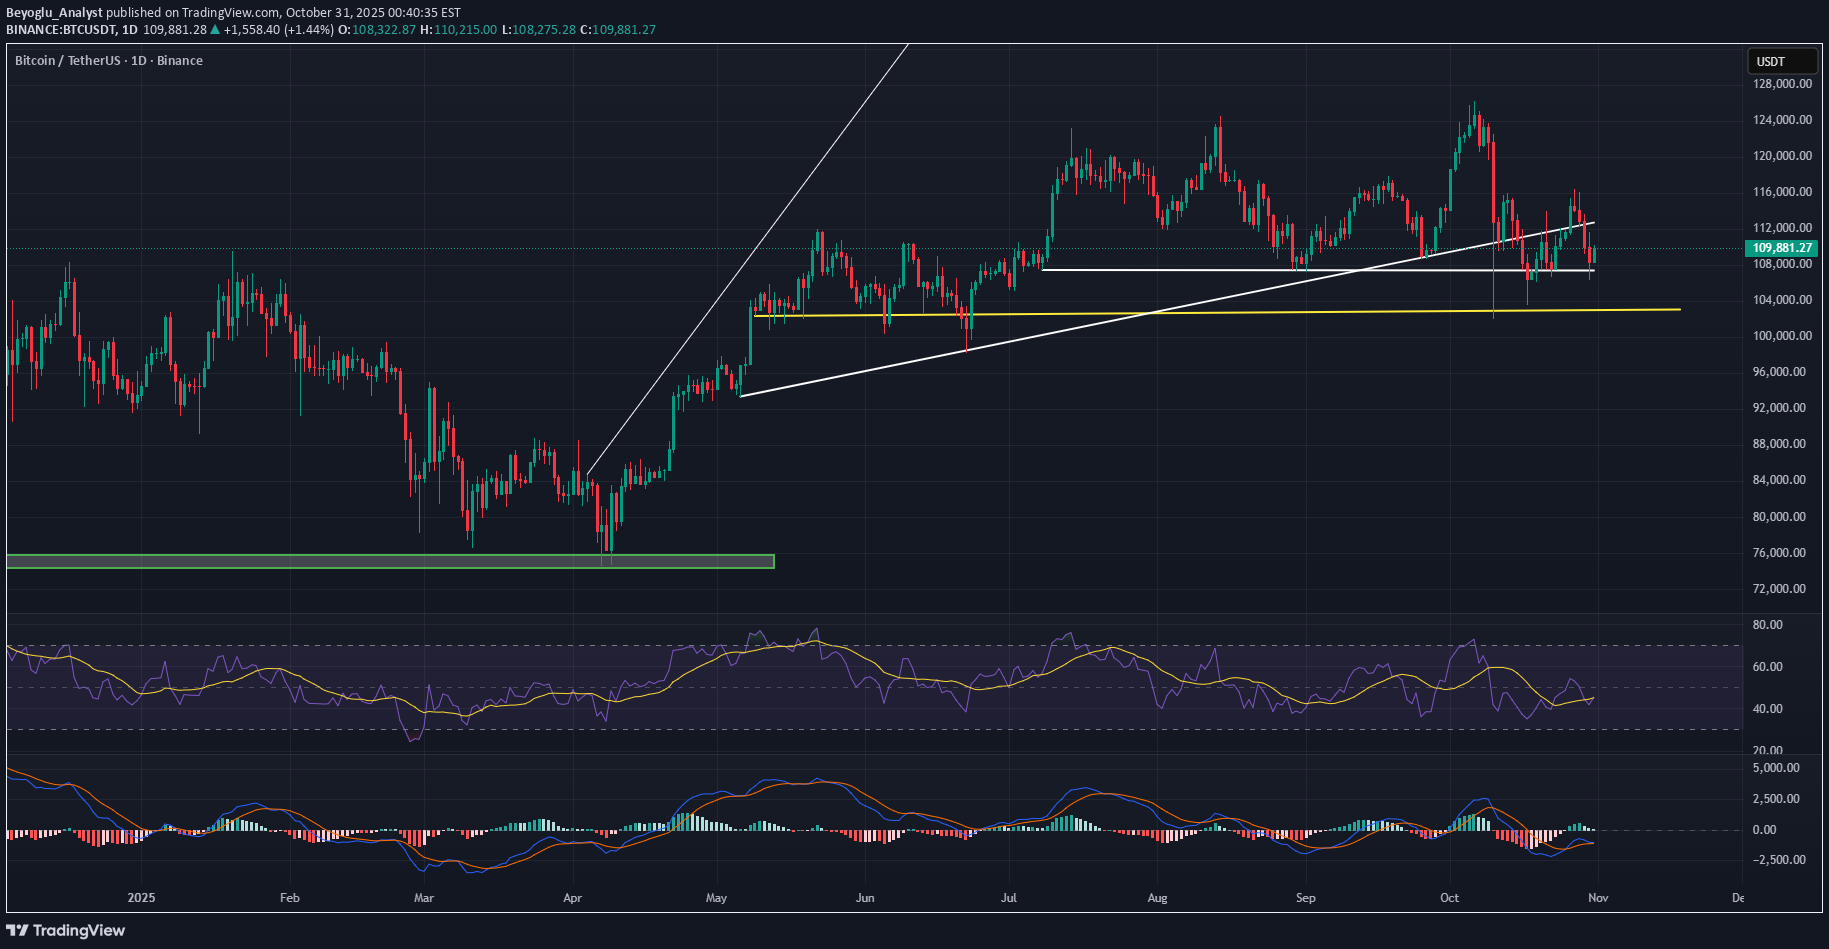
Bitcoin ( BTC ) price trades below $109,000 at the time of writing on Friday after slipping nearly 5% so far this week BTC price was rejected from the Trend line (drawn from the April 7 low of $74,508 to the October 6 all-time high of $126,199) at $115,137 on Monday, and declined 5.44% by Thursday. At the time of writing on Friday, BTC hovers at around $110,000. If BTC continues its correction and closes below $106,453, it could extend the decline toward the October 10 low of $102,000. The Relative Strength Index (RSI) on the daily chart reads 45, below the neutral level of 50, indicating bearish momentum gaining traction. The Moving Average Convergence Divergence (MACD) lines are also converging, with decreasing green histogram bars signaling fading bullish momentum. However, if BTC finds support around $106,453, it could extend the recovery toward the $112,872.
تحلیل تکنیکال ترامپ کوین: آیا ریزش ادامه دارد یا کانال نزولی شکسته میشود؟
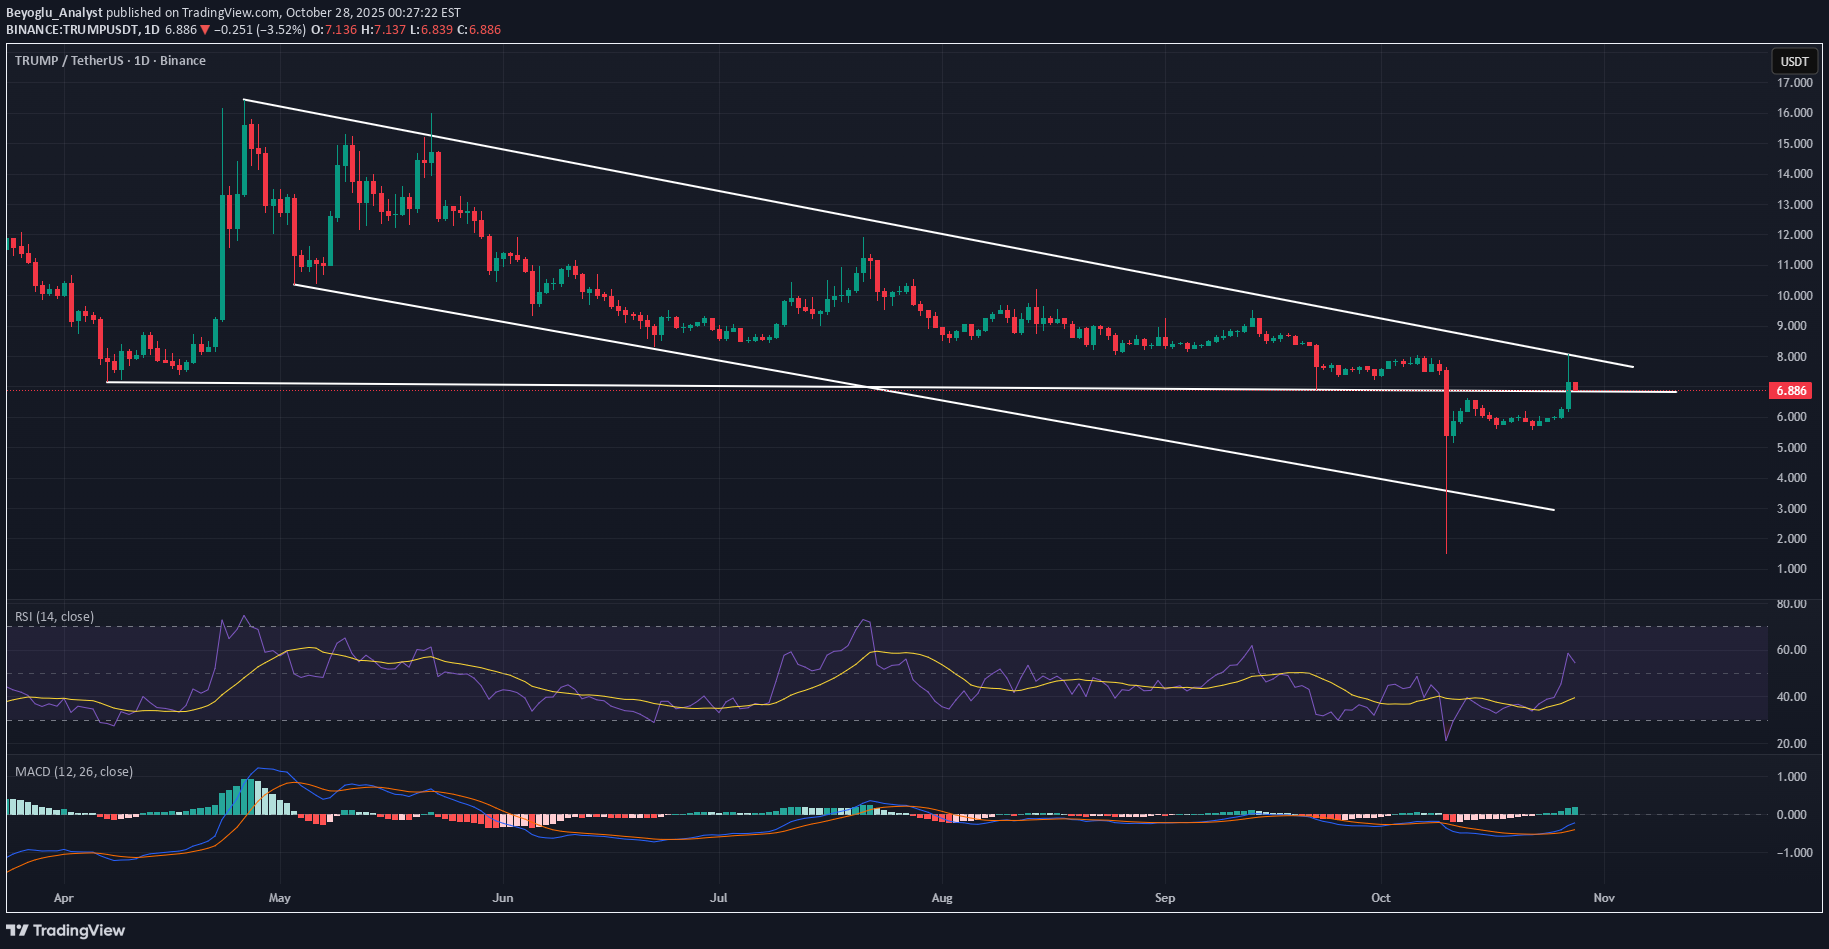
Trump coin is hovering inside the falling channel, On Monday Trump coin pumped almost 35% break above the resistance price level of 6.8$. Trump coin faced selling from the resistance trend line, at 7.9$. At the time of writing this on Monday Trump coin is consolidating above the support trading at at 6.9$. If trump coin gain buying volume from this support price we are likely going to see a breakout above the falling channel. However a break below the support price of 6.9$ can continue the price decline towards 5$. Relative Strength Index (RSI) is at 54 higher than the neutral level of 50, While Moving Average Convergence Divergence indicated a buying signal by making bullish crossover on Friday.
بیت کوین در مسیر فتح قله ۱۲۰ هزار دلار: تحلیل گام بعدی خریداران
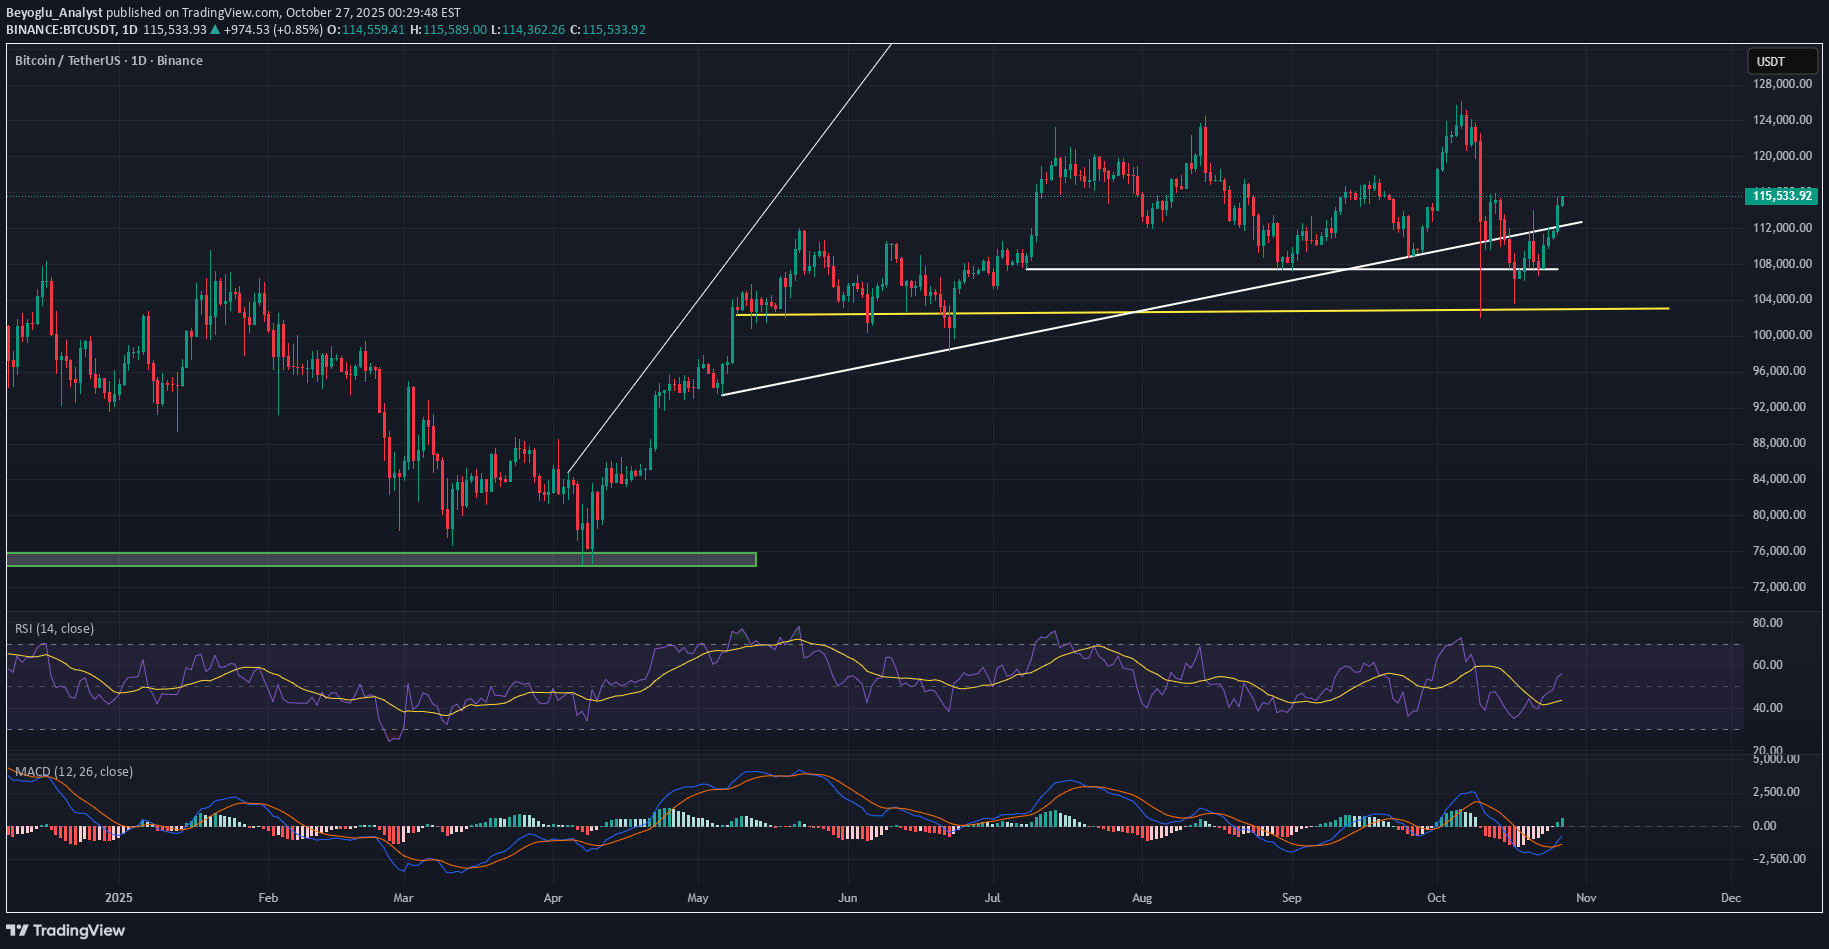
Bitcoin price found support around at $106,453 on Wednesday. BTC rose 6.57% in the next four days and closed above $113,397. At the time of writing on Monday, BTC trades above $115,530, nearing the key resistance at $115,137. If closes above $115,137, it could extend the rally toward the psychologically important $120,000 level. The Relative Strength Index (RSI) on the daily chart reads 56, above the neutral level of 50, indicating bullish momentum gaining traction. Additionally, the Moving Average Convergence Divergence (MACD) showed a bullish crossover on Sunday, providing a buy signal and further supporting the bullish view.
تحلیل تکنیکال پولکادات (DOT): سقوط تا ۲ دلار و پیشبینی مسیر پیش رو

DOT dropped to 0.6$ during the crash last week, and now DOT is showing bearish momentum, 3.5$ was previously reacting as a key support level and now it is reacting as resistance the DOT has faced rejection from this price. At the time of writing this on Saturday DOT is trading at 2.92$ making lower lows and lower highs indicating short term bearish momentum. The next key psychological support level is 2.55$-2.60$, DOT Could retest this support. The price sentiments for Dot are bearish until it will not make a day close above 3.5$. Relative strength Index RSI is at little higher from the over sold level indicating strong bearish momentum. Moving Average Convergence Divergence MACD is also showing higher selling pressure in DOT. #Polkadot
Bitcoin Technical outlook

Bitcoin Technical Outlook: Bitcoin has breakout the resistance price zone of 114k$, on the next day of CPI announcement, The Bitcoin is following an uptrend, it breakout from descending triangle last week, this breakout could lead price to 120k$, at the time of writing this bitcoin is trading at 115.9k$, 115k$ is reacting as support price. Relative strength Index (RSI) is at 54 indicating that the momentum is being shift from downward to upward, MACD is giving buy signal and it is making the bullish crossover. while histogram is also indicating more upward rally ahead. #DYOR #NFA
Bitcoin Cash Price Forecast: Bulls Eye Break Above Key Resistan

Bitcoin Cash (BCH) is up 3% so far on Tuesday, extending its winning streak to a third straight session. The bullish momentum has propelled BCH above the critical $590 resistance level, which had held firm since July 28. A strong daily close above $590 would likely open the door for a retest of the July 27 swing high at $604. If buyers maintain control beyond that point, the next upside target could emerge at the December 7 peak of $640. Momentum indicators remain supportive of the bullish case. The Relative Strength Index (RSI) currently sits at 61 and is trending higher, suggesting upward momentum with room to run before entering overbought territory. However, if BCH fails to hold above $590, a downside correction could take the price back toward the 50-period Exponential Moving Average (EMA), currently situated around $572.
Disclaimer
Any content and materials included in Sahmeto's website and official communication channels are a compilation of personal opinions and analyses and are not binding. They do not constitute any recommendation for buying, selling, entering or exiting the stock market and cryptocurrency market. Also, all news and analyses included in the website and channels are merely republished information from official and unofficial domestic and foreign sources, and it is obvious that users of the said content are responsible for following up and ensuring the authenticity and accuracy of the materials. Therefore, while disclaiming responsibility, it is declared that the responsibility for any decision-making, action, and potential profit and loss in the capital market and cryptocurrency market lies with the trader.