
BeInCrypto
@t_BeInCrypto

What symbols does the trader recommend buying?
Purchase History
پیام های تریدر
Filter
BeInCrypto
بیت کوین در آستانه پرش به ۱۰۴ هزار دلار؛ نشانههای تشکیل الگوی حیاتی در نمودار!

BTCUSD is up roughly 3% over recent sessions, but price action suggests a pause rather than immediate continuation. On the daily chart, BTC is forming a rounded base consistent with the “cup” phase of a cup-and-handle structure. The latest green candle printed a long upper wick, showing sellers are active at higher levels and hinting that short-term consolidation may follow. This consolidation fits the handle phase, where price typically drifts sideways or slightly lower before a breakout. Structurally, the bullish bias remains intact as long as BTCUSD holds above the $89,400 support zone. A deeper loss of $84,300 would invalidate the setup. On the upside, $93,500 is the first neckline resistance to watch. A clean daily close above $94,700 would confirm the breakout. The measured move from the cup projects a target near $104,000, with $107,400 as an extended resistance. On-chain selling pressure is easing, but heavy long positioning in derivatives keeps near-term volatility elevated.
BeInCrypto
اترریوم: آیا رالی ۱۰ درصدی برای تایید معکوس شدن روند ضروری است؟

ETHUSD has started to show early signs of a trend reversal after months of weakness. The price has broken above a descending channel that had guided the bearish structure since early October, marking the first meaningful structural shift in weeks. This breakout was supported by a bullish RSI divergence between October 10 and December 18, where price made a lower low while RSI formed a higher low, signaling weakening selling pressure. However, momentum is not fully clean yet. Between December 10 and January 5, Ethereum has started forming a lower high while RSI trends higher, creating a hidden bearish divergence. This setup often leads to consolidation or a shallow pullback rather than a full trend failure. A close below $3,220 would strengthen this consolidation risk. Key levels now define the outlook. ETHUSD needs a move above $3,470, roughly a 10% rally, to invalidate the bearish divergence and confirm reversal strength. Until then, price remains vulnerable to volatility, with derivatives positioning adding short-term risk.
BeInCrypto
3 Weeks Since Local Top, Pi Coin Price Is Down By 28%

Pi Coin trades near $0.203 at the time of writing, holding above the $0.198 support and below the $0.208 resistance. The token remains down about 28% from its $0.284 local top. Price action suggests consolidation rather than a decisive move. If the downtrend strengthens, Pi Coin may remain range-bound between $0.198 and $0.208. This structure would limit upside potential and delay recovery. Prolonged consolidation could further test investor patience during ongoing market uncertainty. A bullish scenario depends on sustained capital inflows. Continued accumulation could help Pi Coin reclaim $0.208 as support. A successful breakout may drive price toward $0.217, with further upside to $0.224. Such a move would invalidate the bearish thesis.
BeInCrypto
Bitcoin Investors Rotate, But Don’t Rebuild, Price Momentum Stal

Bitcoin is trading near $87,108 at the time of writing, holding above the $86,361 support level. While this zone provides near-term stability, recovery remains fragile. BTC must reclaim higher levels before signaling a meaningful trend reversal. Short-term holders continue to pose a risk to upside progress. If they begin taking profits, Bitcoin could remain range-bound below $88,210. A failure to maintain this structure could result in another test of $84,698, a level already visited during recent volatility. A stronger recovery requires Bitcoin to breach $88,210 convincingly. A push toward $90,401 would signal improving momentum. Achieving this move depends on renewed investor support, which may emerge as value-oriented buyers respond to current price discounts.
BeInCrypto
Zcash Whales Defy Price Dip Below $400, Holdings Surge By 21%

Zcash trades near $396 at the time of writing, sitting below the $403 resistance. The Parabolic SAR remains above the candlesticks, indicating the downtrend is still active. This signal reflects lingering bearish pressure despite improving on-chain and momentum indicators. Whale accumulation and strengthening momentum could counter the technical weakness. These factors may push ZEC toward the $442 resistance. Converting this level into support would be critical. A sustained breakout could open the path toward $500, restoring broader bullish confidence. Risks remain if momentum fails to materialize or whale behavior shifts. Continued weakness could drag ZEC toward the $340 support. A deeper sell-off may extend losses to $300 or even $260. Such a move would invalidate the bullish thesis and confirm extended downside pressure.
BeInCrypto
XRP Price Prediction: These Holders Now Dominate 11.5% Supply

XRP trades near $1.86 at the time of writing, remaining well below the $2.00 mark lost last week. The decline followed a failed attempt to break out of a month-long downtrend earlier this month. Momentum remains fragile under current conditions. The token is holding above the $1.85 support level, which has been tested previously. XRP may consolidate below $1.94 if selling pressure eases. However, worsening sentiment could push price toward $1.79, extending short-term losses. A recovery scenario depends on improving network activity and broader market stability. A break above $1.94 would be the first step toward reclaiming $2.00. Flipping $2.02 into support could drive XRP toward $2.20, invalidating the bearish trend.
BeInCrypto
قیمت هبار (HBAR) روی حمایت مهم متوقف شد؛ آیا سقوط ادامه دارد؟

HBARUSD price has paused after a sharp selloff, down around 17% over the past seven days and nearly 24% month over month. The decline has now slowed near the $0.113 zone, a level that has started acting as short-term support. Momentum remains weak. The Chaikin Money Flow (CMF), which tracks large capital movement, is still deeply negative near −0.32. This shows that bigger players are not stepping back in yet, even as price stabilizes. Recent exchange flow data also confirms fading demand, with brief outflows quickly flipping back into mild inflows. As long as HBARUSD holds above $0.113, a short consolidation or minor bounce is possible. However, a clean break below $0.107 would expose the next downside zone near $0.095, roughly 16% lower. On the upside, any recovery remains limited unless HBAR reclaims $0.155 on a daily close. For now, price is resting on support, but buyers have yet to prove conviction.
BeInCrypto
XRP Price Stalls Despite ETF Inflows as Sellers Hold Key Levels
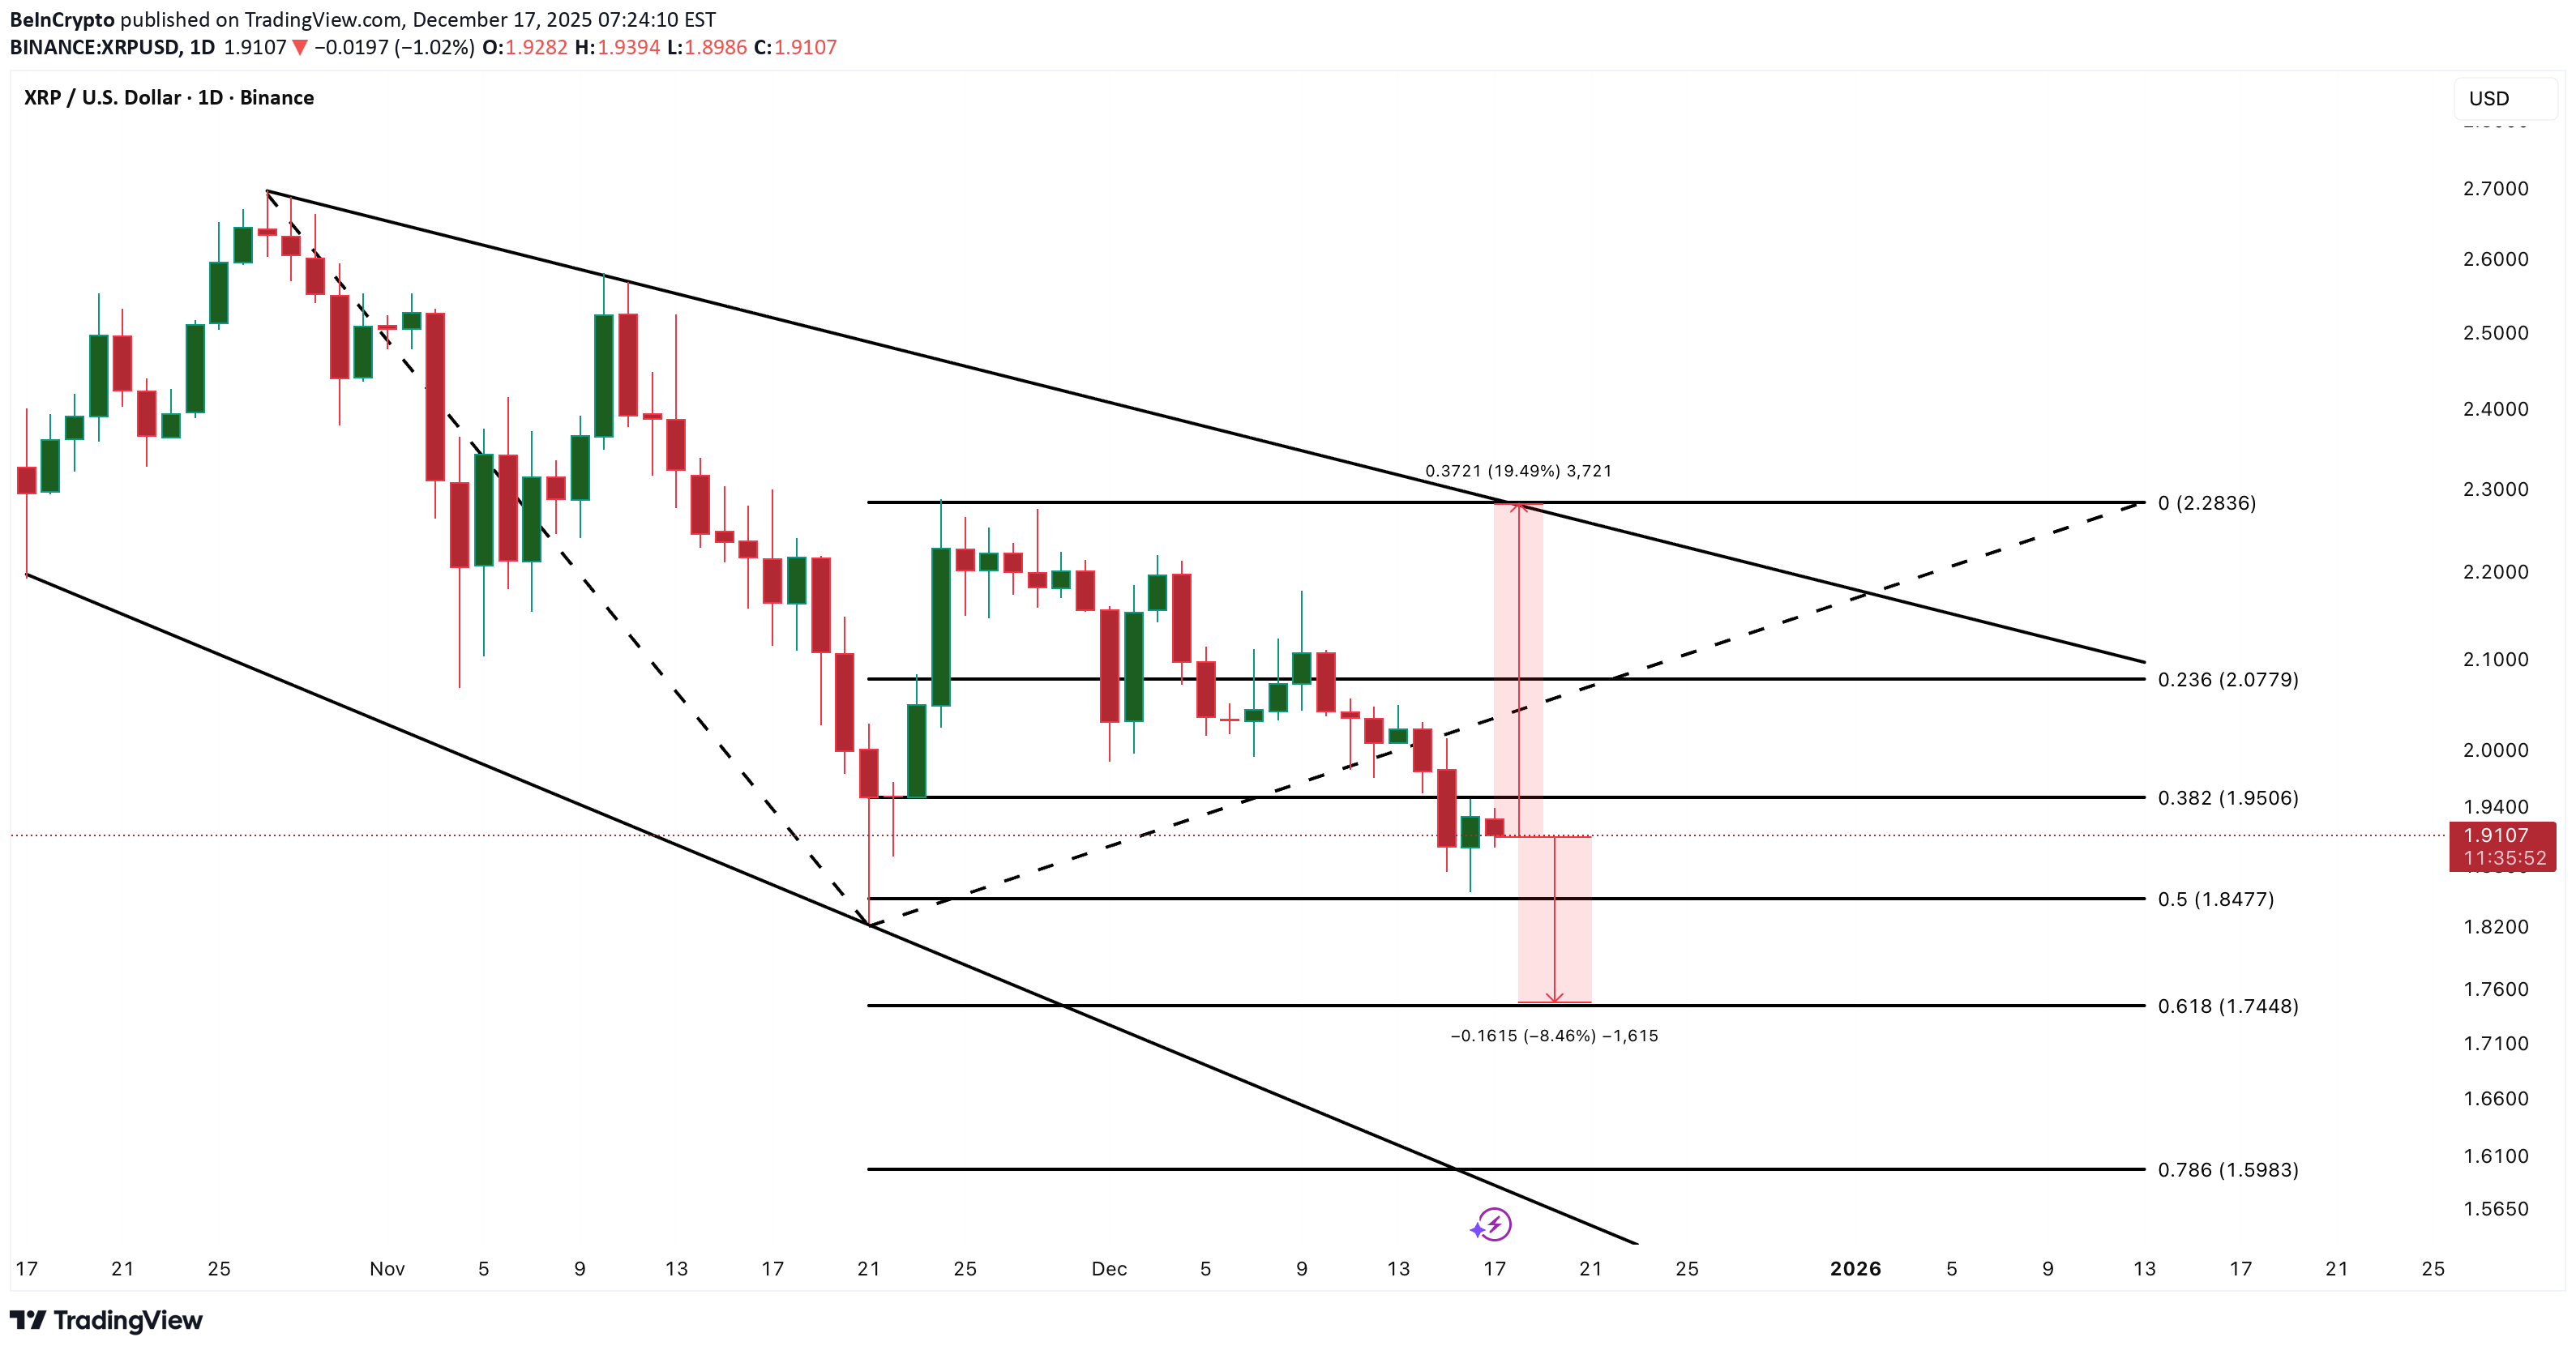
XRPUSD price is struggling to gain traction despite six straight weeks of spot ETF inflows totaling over $1.01 billion. While the token is up around 2.3% intraday, it remains down roughly 14% over the past month. The mismatch between inflows and price action suggests demand is cooling rather than accelerating. On-chain data explains the stall. The share of XRP supply last active over one year ago has climbed from 48.75% to 51.00%, showing older coins re-entering circulation. At the same time, selling from holders active longer than 155 days has slowed, with net outflows dropping about 29% since December 11. This has helped price avoid a sharp breakdown, but buying remains cautious. Technically, XRPUSD trades inside a falling wedge. A daily close above $2.28 is needed to unlock upside toward a 19% rebound. Failure to hold $1.74 risks a move toward $1.59 or lower.
BeInCrypto
Bitcoin Price Prediction: Recovery To $100,000 Could Be Tainted
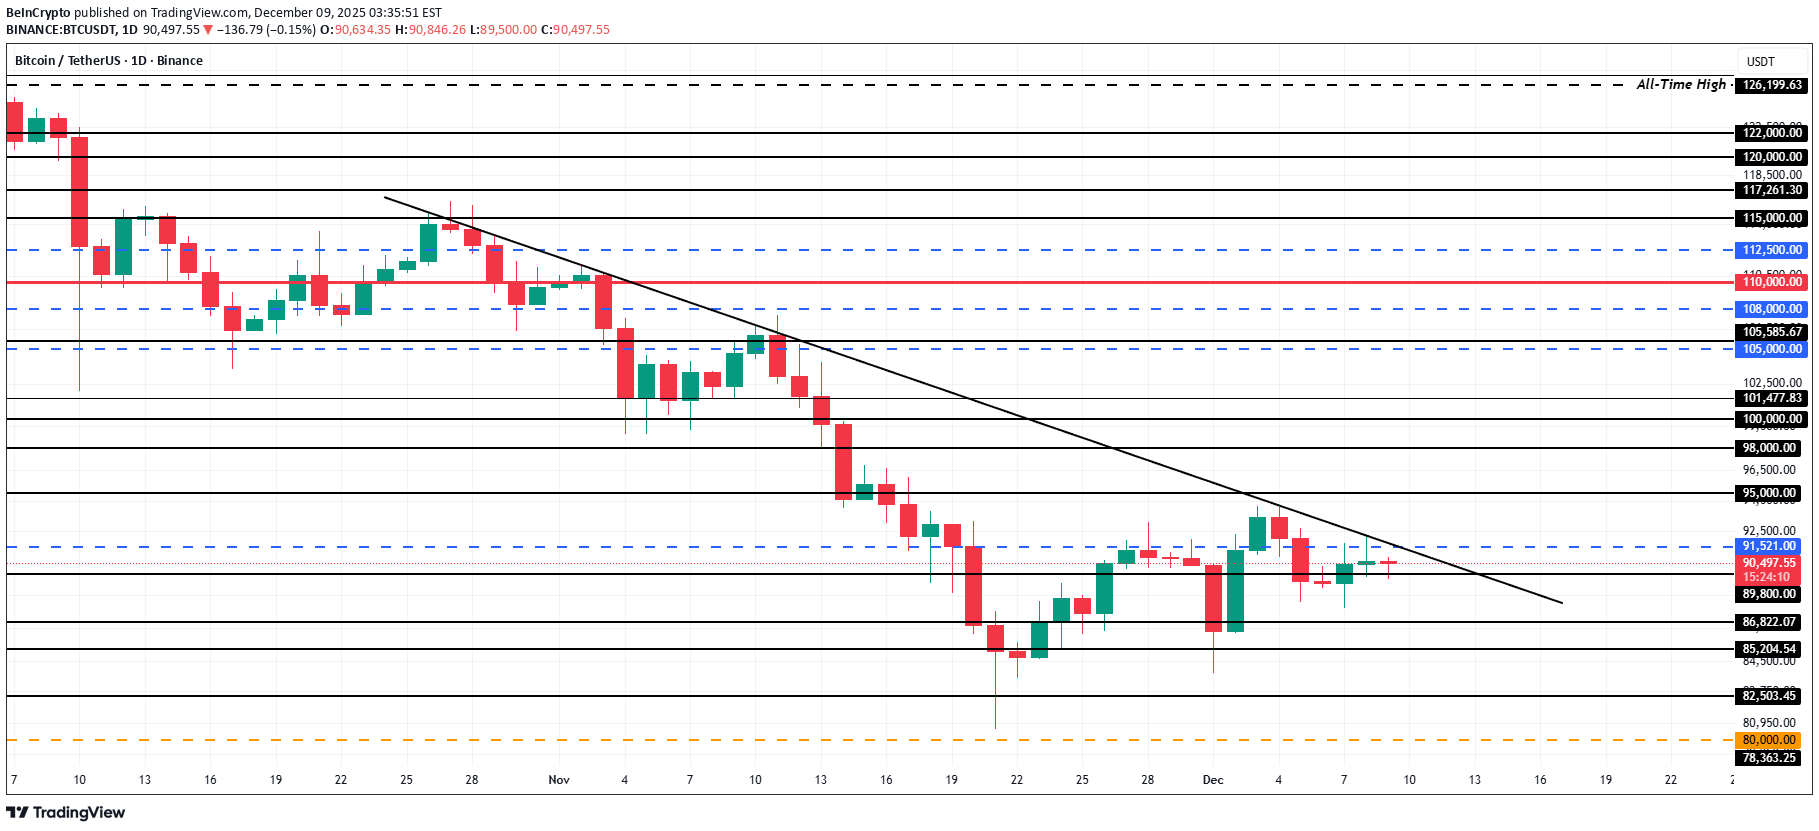
Bitcoin’s price is at $90,399 at the time of writing, sitting just below a downtrend that has persisted for one and a half months. BTC is attempting to flip $90,400 into a support level, which would mark the first step toward reversing the trend. If macro conditions align and rate cuts revive broader market optimism, BTC could rebound sharply. A clean bounce from $90,400 may drive a retest of $95,000, and breaking that resistance would open a clear path toward the long-anticipated $100,000 level. However, if short-term holders sell into strength, Bitcoin may struggle to maintain upward pressure. A rejection from $95,000 or failure to break the downtrend could send BTC back toward $86,822, invalidating the bullish scenario.
BeInCrypto
آیا قیمت بیت کوین زیر ۹۵ هزار دلار با ۲ میلیارد دلار خرید بالا میرود؟
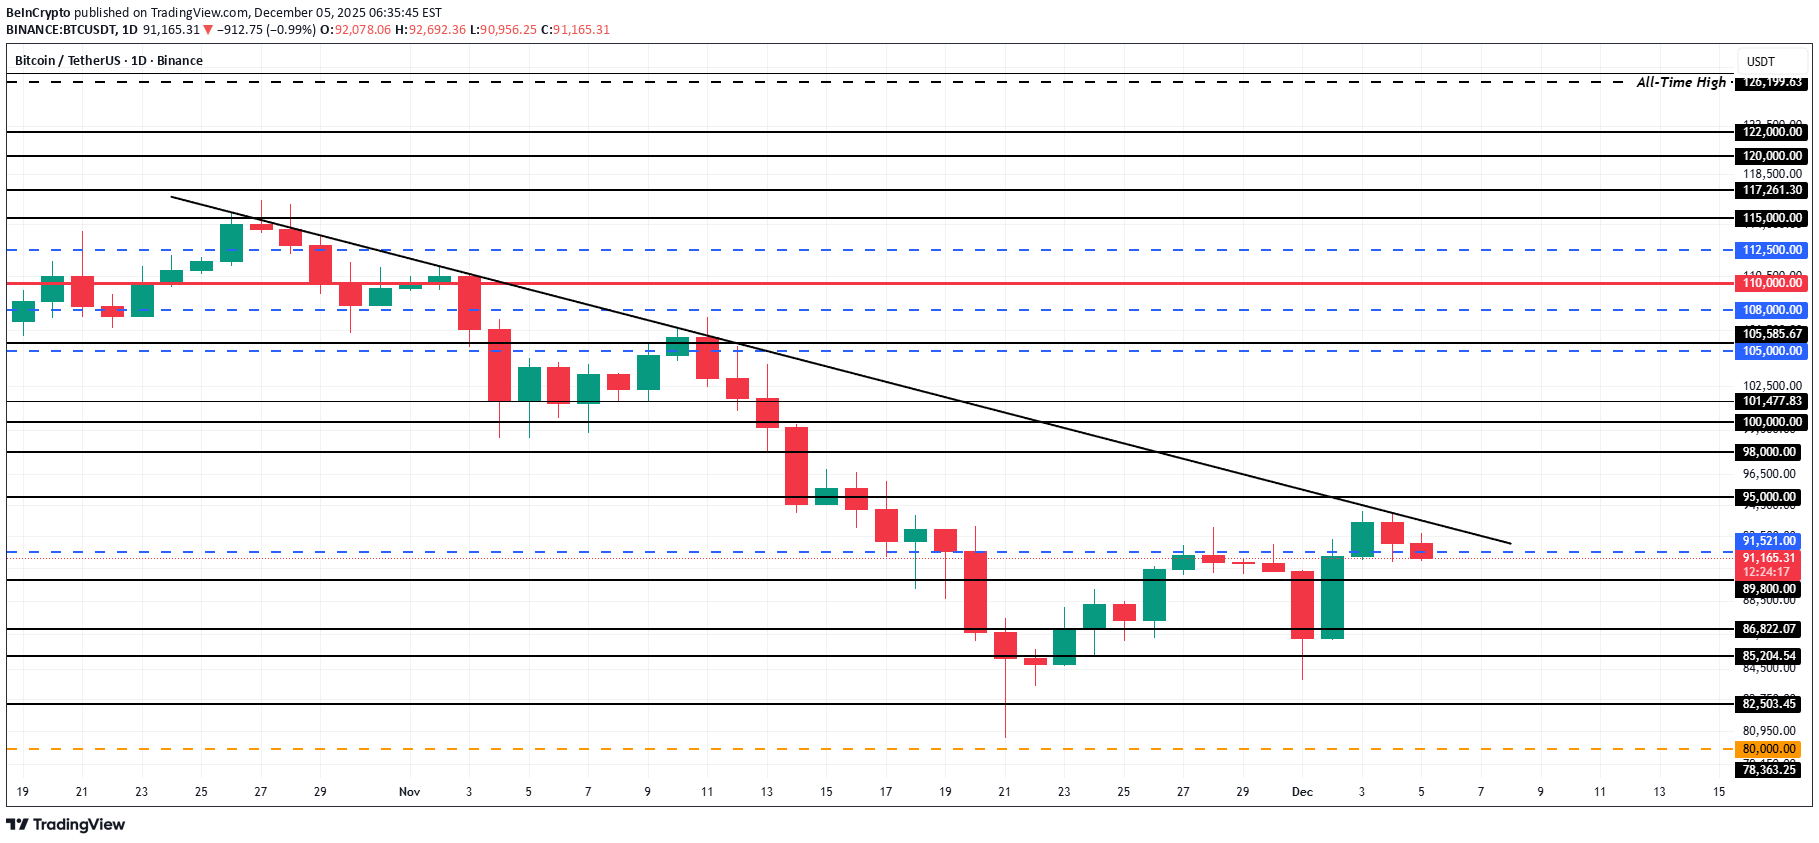
Bitcoin is trading at $92,047, holding above the critical $91,521 support level while remaining trapped under the month-long downtrend. Recovering from this position requires a decisive breakout, which has yet to materialize despite recent attempts. Invalidating the downtrend demands a flip of $95,000 into support. Given the ongoing accumulation and tightening exchange supply, such a move remains possible. Additional support from institutional buyers would further strengthen Bitcoin’s path toward $100,000, restoring bullish momentum. If large holders remain sidelined, Bitcoin may continue to struggle. A failure to sustain support could send BTC back below $89,800 and toward $86,822. This would reinforcing bearish sentiment and delaying recovery attempts.
Disclaimer
Any content and materials included in Sahmeto's website and official communication channels are a compilation of personal opinions and analyses and are not binding. They do not constitute any recommendation for buying, selling, entering or exiting the stock market and cryptocurrency market. Also, all news and analyses included in the website and channels are merely republished information from official and unofficial domestic and foreign sources, and it is obvious that users of the said content are responsible for following up and ensuring the authenticity and accuracy of the materials. Therefore, while disclaiming responsibility, it is declared that the responsibility for any decision-making, action, and potential profit and loss in the capital market and cryptocurrency market lies with the trader.