
Barrenbull
@t_Barrenbull

What symbols does the trader recommend buying?
Purchase History
پیام های تریدر
Filter
الگوی ۳۰۰۰ روزه لایتکوین در حال شکستن است: آیا جهش ۱۴۰۰ دلاری تکرار میشود؟
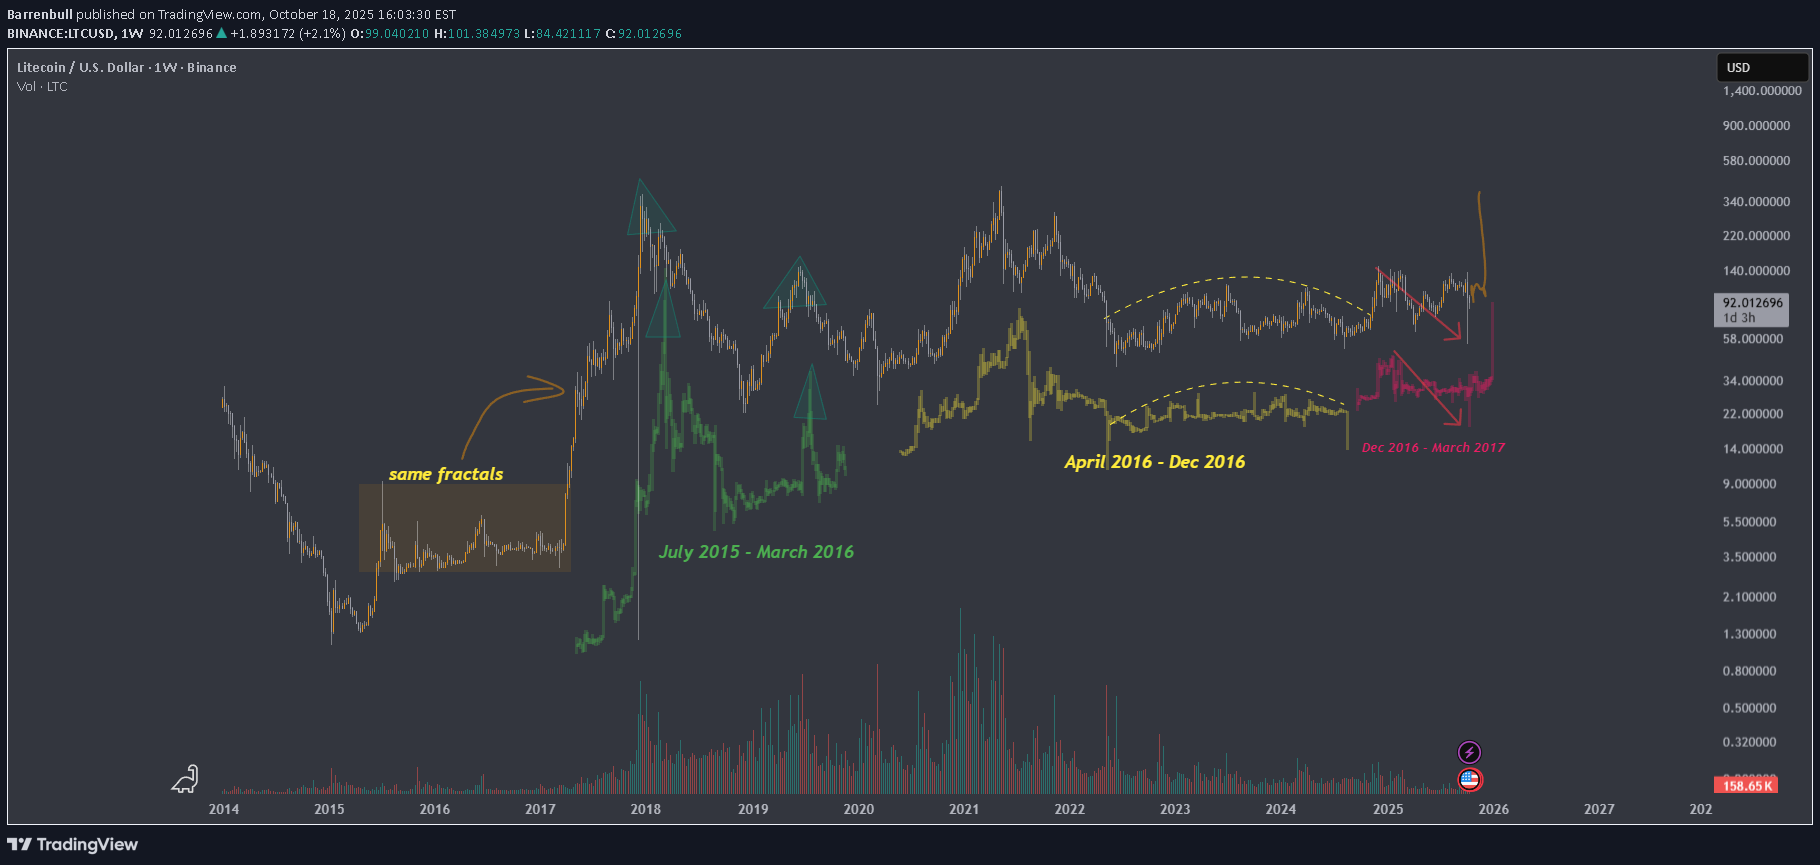
Litecoin has been coiling for almost 3,000 days. The same structure that built up before the 2017 run has formed again, just stretched across a longer timeline. Every fakeout, every rejection, every drop that looked like the end was really the market gathering liquidity and shaking out the weak hands. This is the same three phase rhythm that played out last cycle. Accumulation – long quiet ranges where people lose interest. Expansion – that sudden vertical breakout when liquidity rotates out of Bitcoin and Ethereum. Liquidation – the wipeout that reloads the spring before the next leg. Litecoin tends to lag while Bitcoin and Ethereum take off, then it wakes up when everyone least expects it. That’s its pattern. The same fractal that once sent it from $4 to $400 is here again, just bigger and tighter. If the fractal logic holds, the next expansion could reach between 15x and 25x, putting Litecoin somewhere between $1,400 and $2,300. It’s been years of pressure building in silence, and when that spring finally releases, it will be violent.
3-Phase Litecoin Fractal

We are experiencing 2017 again. coins like LTC just go sideways for infinity while ETH gets sent to hades. i have no idea what will trigger a pump but it just feels so familiar. the phases of the fractal from LTC in 2017 are almost identical (excluding timing).we had a liquidation event, and now the market is consolidating. everything is at a standstill. no one knows what will happen next. i think volatility will pick up in early 2026.
$SNX typical market cycle (psychology)

Pretty clean chart for $SNX. - years of wyckoff accumulation - higher lows - riding weekly MAs in my opinion it appears to be a typical market cycle progressing within the defi space. it's kind of doing its own thing while retail speculates on other coins. This is one of those set it and forget it type of charts. Looks like it wants to break out in the coming months. I recommend more of a position trader mindset. invalidation under 3 bucks (if it decides to turn back over). doesn't hurt to give this one a chance. will you take it?
It's Time To Rebalance

We are at a stage where it pays to be cautious. I've been involved in the crypto markets for 7 years and see consistent emotional patterns playing over and over again. This feels no different. We are not at the mania phase yet but a short term correction is deemed necessary.
Local top is in for BTC

Human emotions remain the same. I believe this is a local top as it was in July 2019. Retail seems to be sucked into a narrative that it has to keep going up. I'm in the position that this is premature and we continue to chop.
One more low for me to take a position on ARBUSD

It looks like ARB is following a descending channel pattern right now. This pattern is formed by connecting the lower highs and lower lows of its price using parallel lines, showing that it's on a downward trend. From what I've observed, I believe that ARB's price might touch the bottom of this descending channel before it starts moving upward towards new highs.
Down the stairs we go for Bitcoin

Another head and shoulders seems to be in play here. 20k would be our target area.
Macro View Of Bitcoin Bollinger Bands | Looking Into Volatility

https://youtu.be/h1Rrv1y1fgs Bitcoin has had phases of low volatility and high volatility. Historically, during phases of low volatility, it has shown to be buying opportunities and the opposite is shown for high volatile phases. Bollinger bands expand on periods of high volatility and decreases risk to reward on your investment. The link above dives deeper into this concept and is a very simple strategy to use to really find some clarity within the crypto markets. The video will explain to dollar cost average in on low volatile phases and take profits on high volatile phases. Check it out for more. (smash the like button! Thanks.) Nate
Bitcoin Bearish Pennant Target $20,000.

A bearish pennant is formed during a steep, almost vertical, downtrend. After that sharp drop in price, some sellers close their positions while other sellers decide to join the trend, making the price consolidate for a bit. Bearish pennants mark a pause in the movement of a price halfway through a strong downtrend, offering you an opportunity to go short. The downtrend then continues with another similar-sized fall in price. Good luck. CREDIT: quora.com/What-is-Bearish-Pennant-in-a-chart-pattern
Disclaimer
Any content and materials included in Sahmeto's website and official communication channels are a compilation of personal opinions and analyses and are not binding. They do not constitute any recommendation for buying, selling, entering or exiting the stock market and cryptocurrency market. Also, all news and analyses included in the website and channels are merely republished information from official and unofficial domestic and foreign sources, and it is obvious that users of the said content are responsible for following up and ensuring the authenticity and accuracy of the materials. Therefore, while disclaiming responsibility, it is declared that the responsibility for any decision-making, action, and potential profit and loss in the capital market and cryptocurrency market lies with the trader.