
BallsOfSteel32
@t_BallsOfSteel32

What symbols does the trader recommend buying?
Purchase History
پیام های تریدر
Filter
احتمال ریزش بیت کوین به زیر ۷۱,۵۰۰ دلار در هفته آینده چقدر است؟
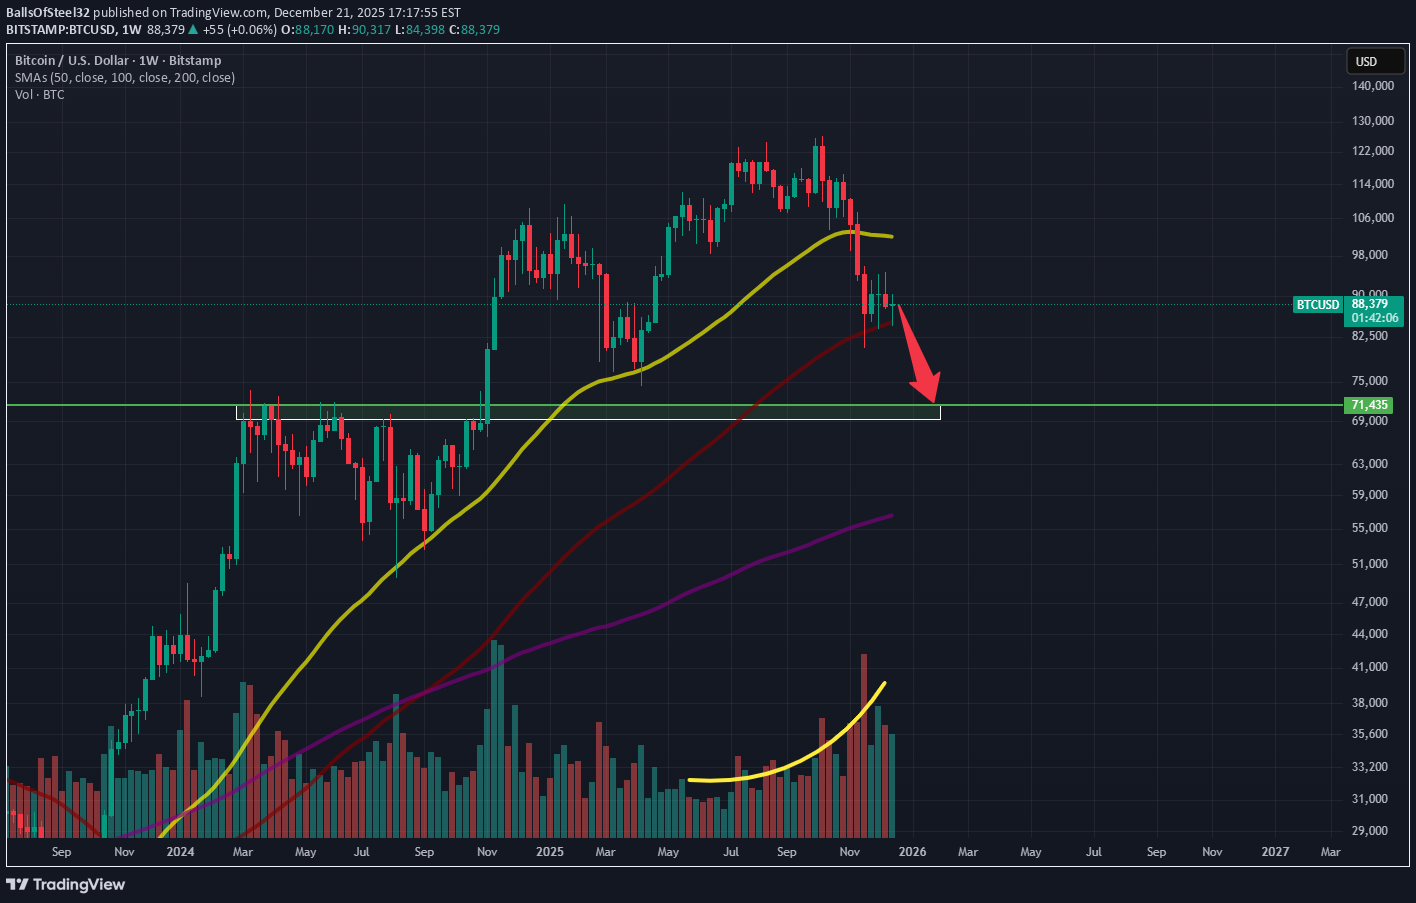
BTC is currently holding support on the 100 sma on the weekly chart. Volume has been increasing as the downtrend progresses signaling increased selling pressure. I think the next weekly candle open will break below the 100 sma and go to test the next support area around 71,500. Not financial advice, do your own dd.
سقوط بیت کوین به ۷۰ هزار دلار در راه است؟ تکرار الگوی ۳ سال رشد و ۱ سال سقوط!
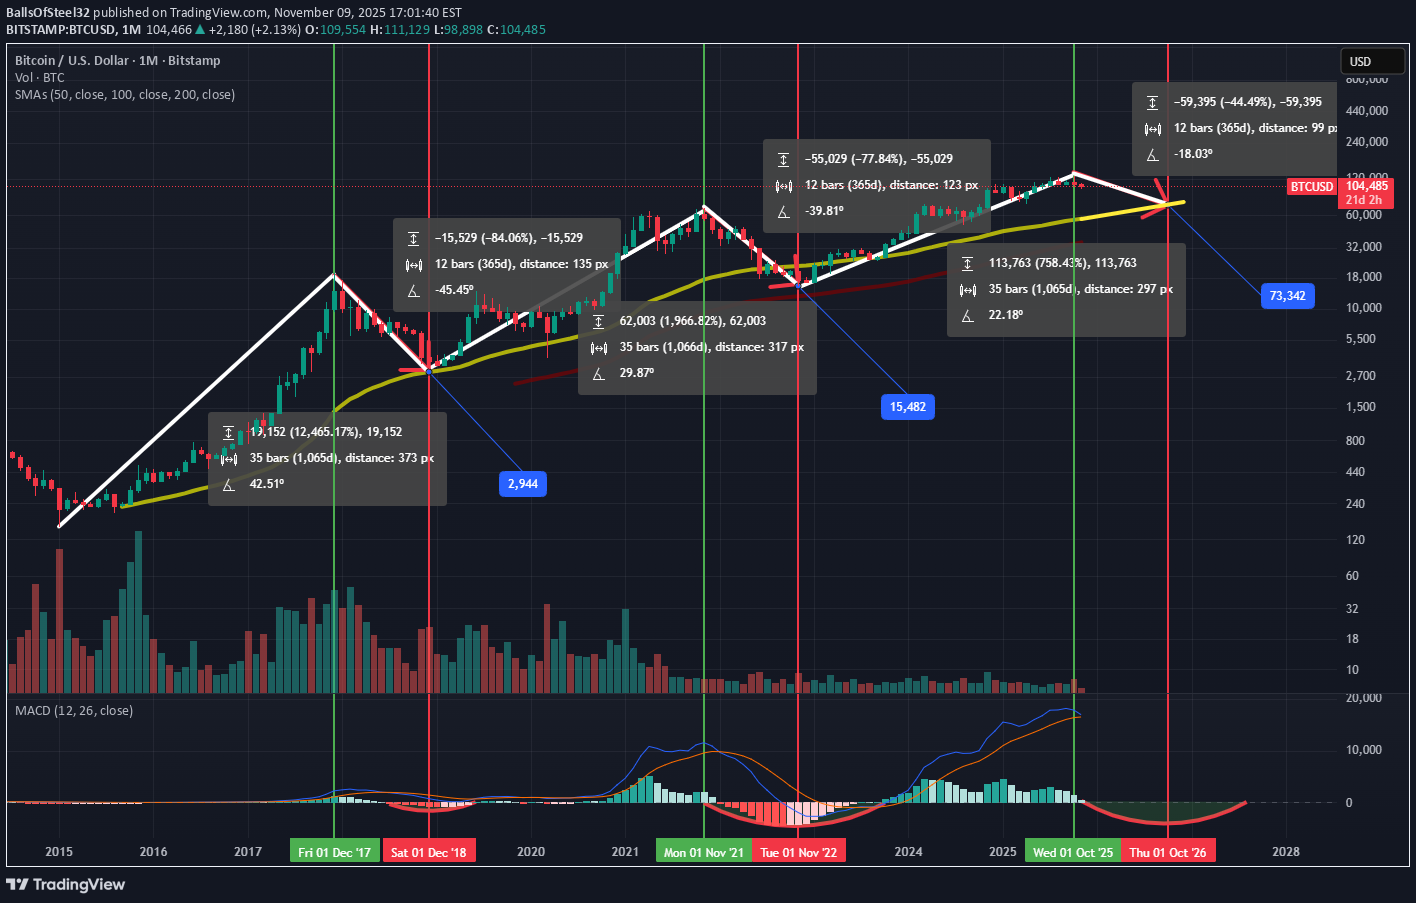
if this 35 bar monthly cycle holds up like it has in the 2 previous cycles, top is in. I was expecting a better performance out of btc this cycle but my bias has changed as we have reached q4. the monthly 50 simple moving average aligns with the top of the previous cycle putting btc at a low of around 70k in the coming year. 3 years up, 1 year down, rinse and repeat. let me know what you think will happen. is it different this time around? or is pattern about to repeat?
XRP Descending Narrowing Wedge Daily Chart
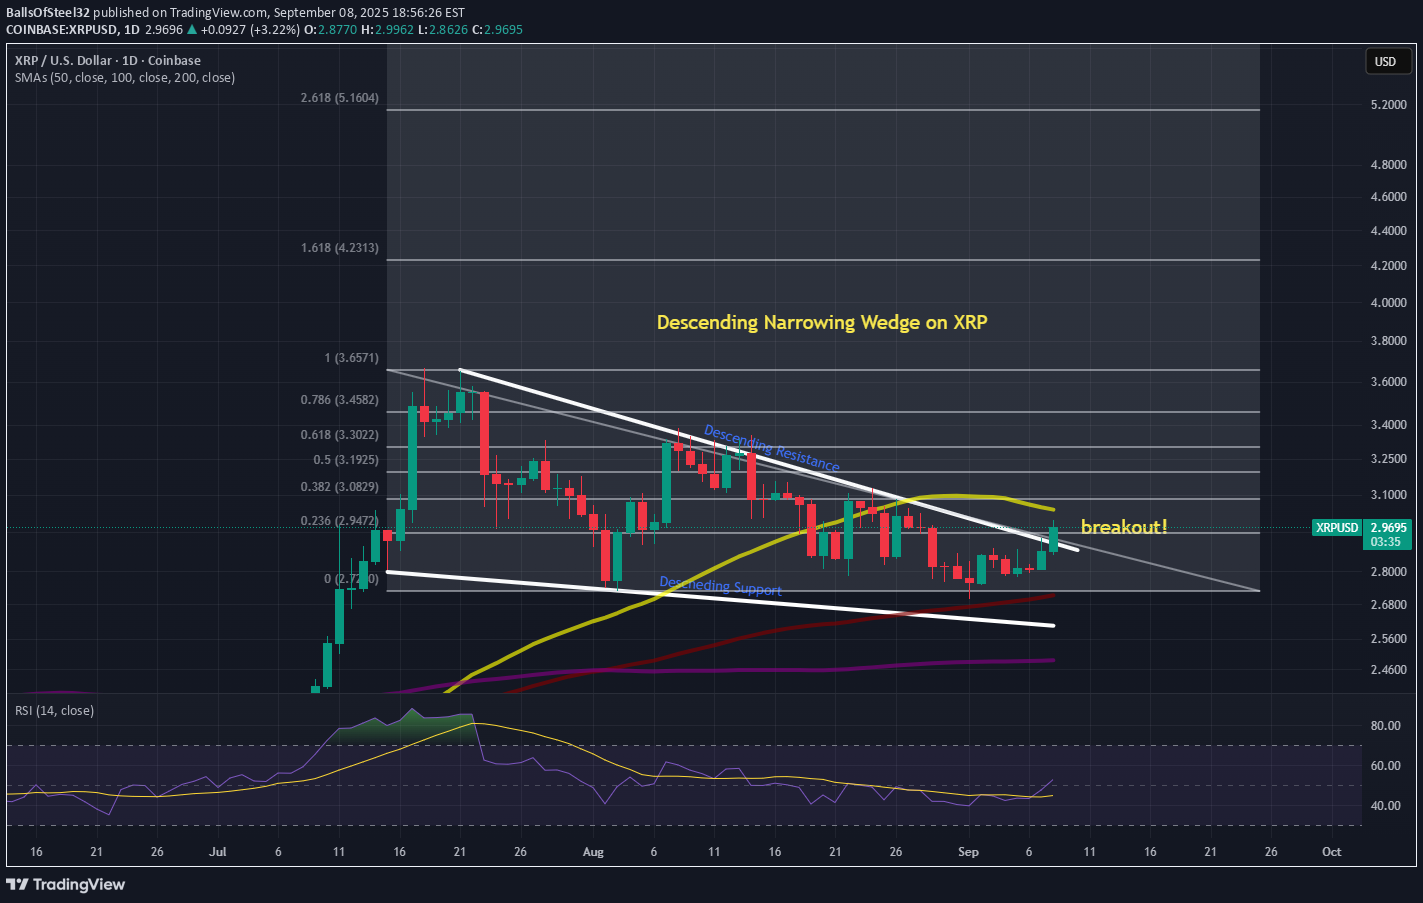
XRP is currently breaking out of a descending narrowing wedge on the daily timeframe. XRP may meet some resistance at the 50 simple moving average as it approaches this level. I expect the price to fly after breaking this moving average. Seat belts everyone! Not financial advice. Do your own DD. Thanks for viewing the idea.
LTC long settup
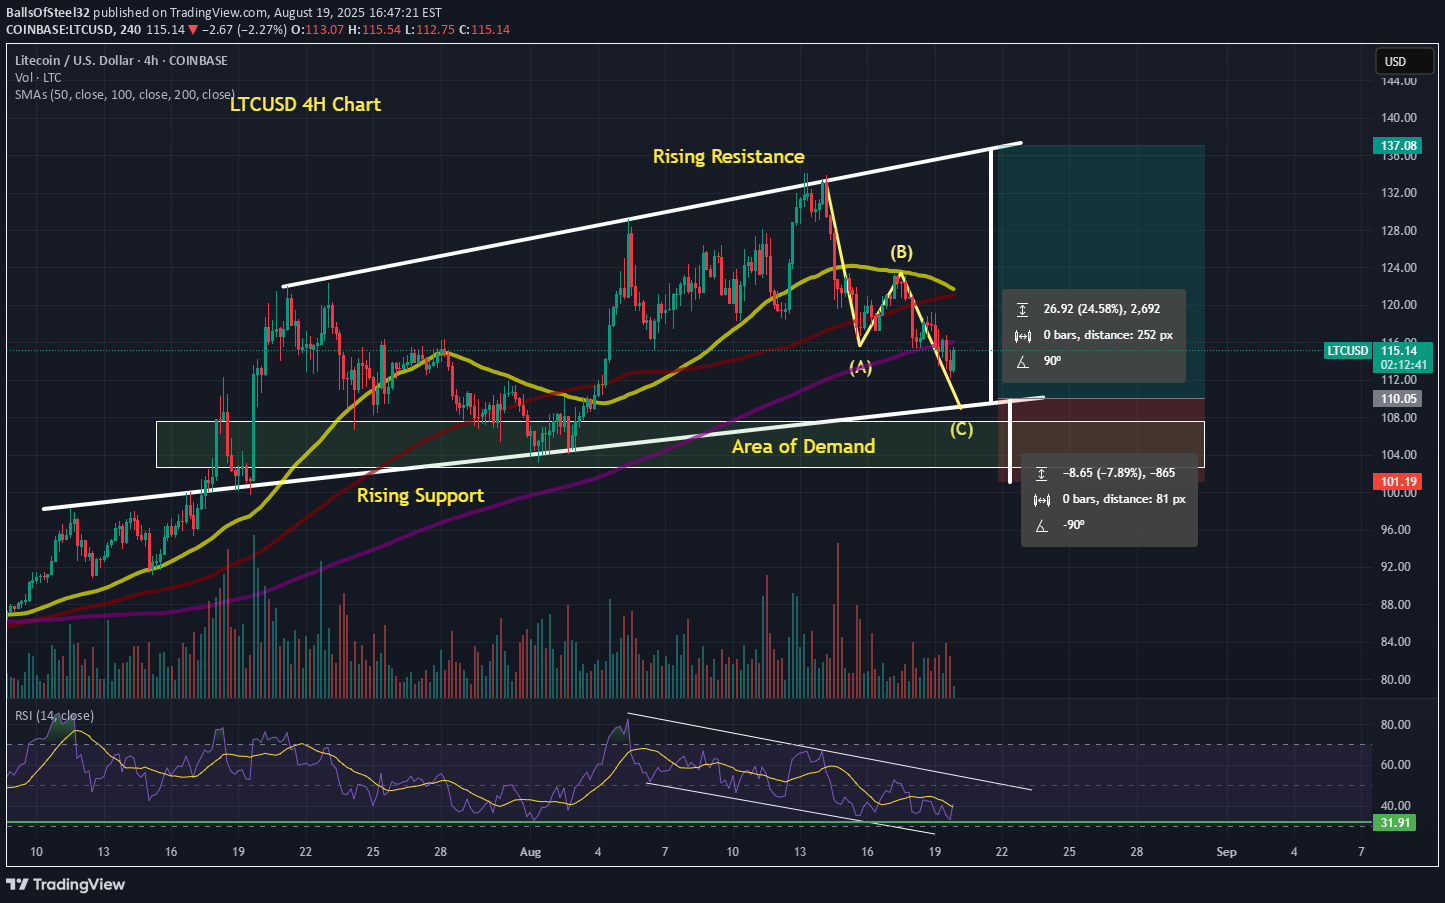
LTC is retracing to a rising support around 110. I will be entering long at 110 with a 1/5 RR settup targeting the top rising resitance line. The stop loss will be set at the 101.19. RR:1/5 TP: 137.08 SL: 101.19 Potential Percentage Gain: %24.5 Potential Percentage Loss: %7.9 Not financial advice. Do your own DD. Thanks for viewing the idea.RR is 3/1 not 5/1
BTC Pullback
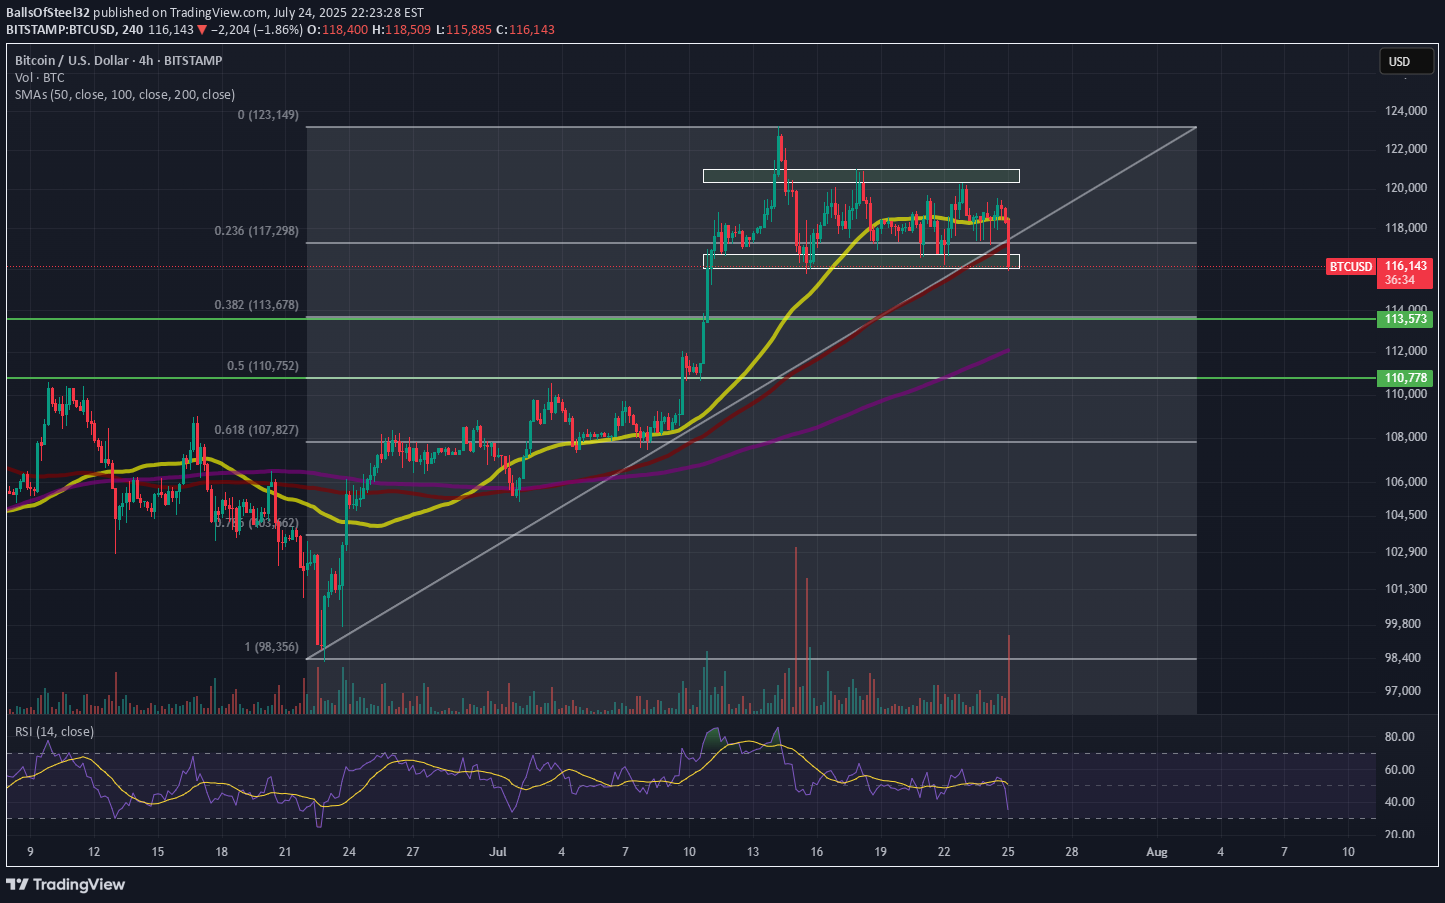
113,500 and 110,800 are the next two levels to watch for and line up with the .382 and the .5 fib level. I think there will be more downside before another push to a new ATH. NFA, do your own DD. Thanks for viewing.
BTC daily bull flag formation
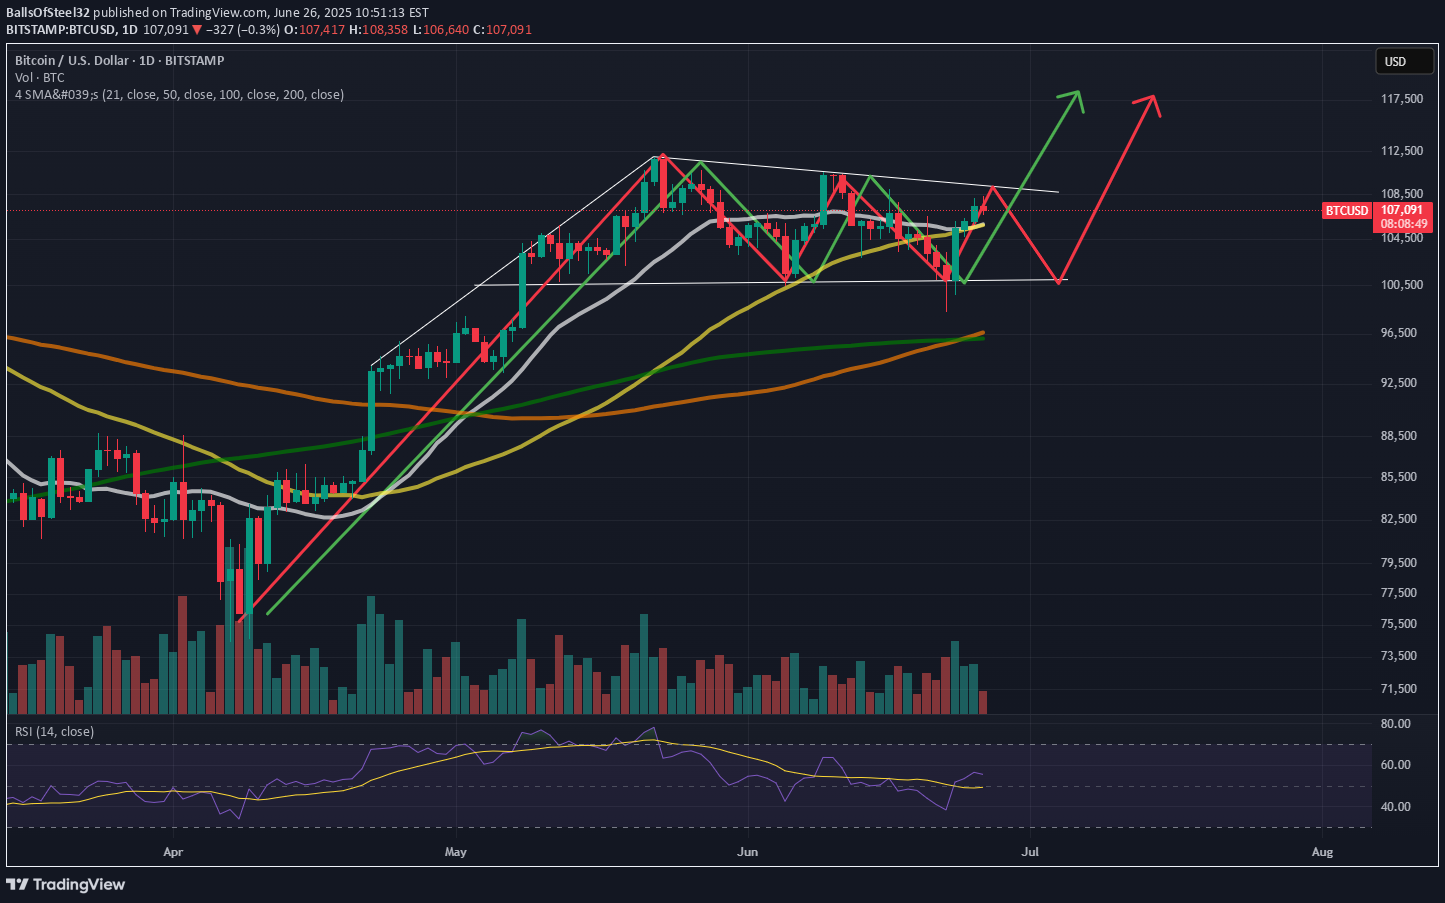
BTC is looking bullish on the daily chart in my opinion. One more pullback might be in order before we test new highs on the daily chart. The 100 sma has crossed over the 200 sma and the 50 sma is crossing the 21 sma. The rsi is neutral at time of publication. This bullish breakout could occur in late july after a pullback in the near term. I think bitcoin is setting up to make another all time high push as summer draws on.Not financial advice. Do your own DD.Thanks for viewing the idea. Comment what you think is going to happen over the course of this summer.

BTC is about to meet a major rising trend line that is converging with the 100 sma on the daily chart. This is where I am expecting the price to reverse. I think the current price is a discount that wont last much longer. Once we meet the trend line and the 100 sma, there might be more fireworks. Keep an eye on this. Not financial advice, do your own dd.Thanks for viewing the idea.
GALA/USD 4H 100-200 sma cross impending

Gala is about to experience a 100-200 sma cross on the 4 hour timeframe. This is also occuring as the coin attempts to break the down trend that has been in place since December 4th of last year. Gala is back to trading above its 50, 100 and 200 sma which is a good sign. RSI is 58 at time of publishing. Levels to watch are marked with green horizontal lines. The top most line is the 1.618 extension of the previous high swing low. Gala could gain as much as 12-30% in the coming days. Not financial advice.Do your own DD.Thanks for viewing the idea.
BTC Daily Bullish Pennant Formation

This is the daily chart for BTC/USD. BTC appears to be trading inside a triangle after a large bullish impulse. Price is currently trying to regain the 50 simple moving average (yellow line). If BTC breaks the 50 day simple moving average, I expect the price to break out of the pennant forming and test higher highs. RSI is nuetral at 52 at time time of publishing. Price action has maintained candle closes on the daily above 92k.Target for the next leg up is the 1.618 extension from the most recent High to swing low. This would put the PA around 120k.NFA, do your own DD.Thanks for viewing the idea.
Gala Weekly Chart Idea

Gala had a large break out after a cup shaped accumulation period. The price has since pullled back the .5 fibonacci level. This level lines up with the neck line of the cup and accumulation period. We have a potential for a reversal to touch the top of a rising trend line sometime around january. my target is around 10 cents. this lines up with the resistance and the 1.786 extension. Ill be looking for a candle close above the .5 fib level. Stop loss will be around .038.Not financial advice. Do your own DD.Thanks for viewing the idea.
Disclaimer
Any content and materials included in Sahmeto's website and official communication channels are a compilation of personal opinions and analyses and are not binding. They do not constitute any recommendation for buying, selling, entering or exiting the stock market and cryptocurrency market. Also, all news and analyses included in the website and channels are merely republished information from official and unofficial domestic and foreign sources, and it is obvious that users of the said content are responsible for following up and ensuring the authenticity and accuracy of the materials. Therefore, while disclaiming responsibility, it is declared that the responsibility for any decision-making, action, and potential profit and loss in the capital market and cryptocurrency market lies with the trader.